
Abstract
Initially inspired by the Atkinson and Shiffrin model, researchers have spent a half century investigating whether actively maintaining an item in working memory (WM) leads to improved subsequent long-term memory (LTM). Empirical results have been inconsistent, and thus the answer to the question remains unclear. We present evidence from 13 new experiments as well as a meta-analysis of 61 published experiments. Both the new experiments and meta-analysis show clear evidence that increased WM maintenance of a stimulus leads to superior recognition for that stimulus in subsequent LTM tests. This effect appears robust across a variety of experimental design parameters, suggesting that the variability in prior results in the literature is probably due to low power and random chance. The results support theories on which there is a close link between WM and LTM mechanisms, while challenging claims that this relationship is specific to verbal memory and evolved to support language acquisition.
Memory researchers have been trying to determine whether working memory (WM) maintenance affects subsequent long-term memory (LTM) representations since the late 1960s. Here, we use the term working memory maintenance as a necessarily theory-neutral descriptor of retaining information in memory over a short interval for immediate use—necessarily theory neutral because questions about how this affects subsequent LTM have arisen in the context of very different theories.
Interest was initially piqued by the Atkinson and Shiffrin (1968) model, in which WM is sandwiched between perception and LTM. Thus, the longer an item is maintained in WM, the more likely it will be transferred to LTM, though the efficiency of transfer to LTM can be modulated by controlled memory processes (see also Waugh & Norman, 1965). Over the following half-century, models of memory have come and gone, but the question has remained relevant. For instance, Baddeley, Gathercole, and Papagno (1998), using a very different theoretical framework, argued WM maintenance is crucial for acquiring the phonological form of new words. The question likewise attracted the attention of researchers working in Craik and Lockhart’s (1972) levels-of-processing framework, on which LTM fidelity is primarily a factor of how deeply the item was processed, and “mere rehearsal” of items in WM should have limited or no effect on LTM. In recent years, the question has arisen in debates about the mechanisms of WM maintenance and the role of attention (Camos, Lagner, & Barrouillet, 2009; McCabe, 2008; Vergauwe & Langerock, 2017).
The result of 50 years of research has unfortunately not resulted in a set of well-established and precisely measured findings, much less theoretical clarity. Rather, the literature consists of a hodgepodge of conflicting results. The confusion can be best illustrated by the fact that in reviewing the literature, different authors have reached diametrically opposed conclusions (Blumenfeld & Ranganath, 2006; Bower, 2000; Camos, 2015).Footnote 1
Indeed, although many studies have found that the length of time an item is held in WM affects subsequent LTM, many others have not (see Table 1). This is true for both recall and recognition memory. Likewise, studies of whether brain activation during WM maintenance predicts subsequent LTM have produced divergent results, with different studies implicating different brain regions, complicating interpretation (Blumenfeld & Ranganath, 2006; Davachi et al., 2001; Ranganath et al., 2005; Schon, Hasselmo, LoPresti, Tricarico, & Stern, 2004; see also Khader, Ranganath, Seemuller, & Rosler, 2007).
Some evidence may come from the Hebb effect, in which WM performance for a list of items improves with repeated trials involving that list (Hebb, 1961). One explanation is that repeated WM maintenance leads to greater LTM for the list, which subsequently supports WM maintenance for that list (Waugh & Norman, 1965). However, because repeated exposure to a stimulus can itself lead to greater LTM, the role of WM in the Hebb effect is unclear, particularly since the duration of WM maintenance does not modulate the Hebb effect (Oberauer & Meyer, 2009).
Although direct tests of a WM–LTM link have been inconclusive, indirect evidence comes from correlations between WM capacity and vocabulary acquisition in both typical and disordered populations (Baddeley, 1993; Baddeley, Papagno, & Vallar, 1988; Trojano & Grossi, 1995; Vallar & Baddeley, 1984). However, these results are correlational and may have a common cause. Experimentally manipulating verbal WM through articulatory suppression impairs vocabulary acquisition (Andrade & Baddeley, 2011; Ellis & Sinclair, 1996), but since articulatory suppression affects many mental processes in addition to WM, it is unclear which is responsible for impairing vocabulary acquisition (cf. Baddeley, Chincotta, & Adlam, 2001; Saeki & Saito, 2004).
The current study
We take a two-pronged approach to gaining some clarity on the relationship between WM maintenance and LTM. The first is a meta-analysis. While the vote-counting approach we took to literature review in the previous section presents a confusing picture, this dichotomization of results into “significant” and “nonsignificant” results in a considerable loss of information. It may be that the statistically null results nonetheless point in the positive direction. Alternatively, averaging across all studies may show compelling evidence for a significant result. Conversely, the positive results could be based on particularly small samples and are likely to be false positives. Thus, we use meta-analysis to quantitatively combine 60 prior experiments (from across 30 papers), giving us a more precise summary of the literature. We also test for several frequently discussed potential moderators.
Meta-analysis inherits any flaws in the literature, most notably publication bias. Because psychologists tend not to publish null results, the literature tends to overstate the evidence for any given effect (Fanelli, Costas, & Ioannidis, 2017; Ferguson & Heene, 2012). Thus, we supplement the meta-analysis with new experiments. Given the substantial number of already-published experiments, one or two additional small studies would not shift the needle. Therefore, we then conducted 13 large-N experiments to replicate and extend the results of the meta-analysis.
Maintenance, retention, and rehearsal
As already noted, we use working memory maintenance as a theory-neutral descriptor of whatever processing humans normally undertake when attempting to retain information in mind over some short interval. Thus, we will speak of “duration of working memory maintenance” and “retention interval” interchangeably.
For some theories, working memory maintenance has a more specific meaning. Most theories assume that, all else equal, information in working memory decays rapidly, either because this is a basic feature of the underlying machinery or because of interference from new information (Atkinson & Shiffrin, 1968; Cowan, 1988, 2008; Lewandowsky, Oberauer, & Brown, 2009; Loaiza & Halse, 2018; McCabe, 2008; Rose, Buchsbaum, & Craik, 2014). Thus, retaining information in WM long enough to succeed in standard WM experiments requires some form of active maintenance, usually understood to involve some sort of rehearsal or other “refreshing” of the memory trace. Thus, rather than measuring experiment characteristics (how long was the subject asked to retain the information), one might wish to measure—or, better yet, control—how much subjects used various maintenance mechanisms (e.g., by requiring subjects to rehearse out loud; using secondary tasks to restrict usage of controlled memory processes). However, as noted as early as Atkinson and Shiffrin (1968):
It has proved difficult to establish how much rehearsal takes place during various intervening tasks. Similar problems arise when attempts are made to control rehearsal by increasing presentation rates. Even at the fastest conceivable presentation rates, subjects can rehearse during presentation if they attend to only a portion of the incoming items. (p. 102)
Moreover, interpretation of these designs is not always theory independent, as which secondary tasks should interfere with active memory maintenance will necessarily depend on the nature of active memory maintenance.
Thus, while we recognize the importance of delineating the mechanisms underlying working memory maintenance, and we appreciate the usefulness of attempting to measure them directly, for the purposes of the present study, we stick to defining maintenance based on experiment characteristics: What were the subjects asked to do, and how long were they asked to do it? While this limits our ability to test the predictions of specific theories, it enables us to measure a phenomenon that has been of persistent interest to a wide range of theories.
Meta-analysis
For data, scripts, and additional methodological details, see https://osf.io/kygt5/ (doi:10.17605/OSF.IO/KYGT5).
Method
Target papers
We sought behavioral experiments that manipulated the duration of WM maintenance in young healthy adults and then tested the effect of this manipulation on LTM. Note that we did not include studies where manipulations of duration were fully confounded with memory set (e.g., Rose, 2010). Otherwise, there were no restrictions. In particular, we did not require that the LTM experiment was unexpected, nor did we restrict to experiments with unfilled rehearsal (i.e., we did not exclude complex span tasks). If any part of an experiment met our inclusion criteria, we included that part: for instance, the behavioral results of a neuroimaging experiment.
Note that we did not include tasks in which subjects were required to engage in “deep encoding” strategies such as mental imagery. From a theoretical standpoint, it seems unlikely that one would want to lump this in with “working memory maintenance”; the whole point of such manipulations is to encourage subjects to engage in a strategic process they would not normally use. Moreover, as a practical matter, there does not seem to be any disagreement about whether these deliberate strategies result in better LTM—the open question has been whether one can still affect LTM without using such strategies.
Keyword searches proved ineffective at retrieving the papers of interest. Instead, we identified potential papers by recursively following citations forward and backward from already-identified papers. By this procedure, we identified 38 papers and 72 experiments (see Supplementary Materials).Footnote 2
Measures and covariates
Meta-analysis requires standardized effect sizes. While the papers in our data set generally do not report standardized effect sizes, most papers provided enough information to calculate the log odds ratio of successful recognition/recall against a baseline of minimal WM maintenance. For instance, for an experiment that considered two durations of WM maintenance, we take the natural logarithm of the ratio between the odds of success at the two durations. If the odds of success was 10:1 at the longer duration and 5:1 at the shorter, the log odds ratio would be ln[(10/1) / (5/1)] = 0.69. In an experiment that considered three durations, each of the longer durations would be compared with the shortest (“baseline”) duration. Following Mahowald, James, Futrell, & Gibson (2016), we calculate these ratios based on cell means only.Footnote 3
Using this procedure, we were able to derive standardized effect sizes for 61 experiments across 31 papers. This excludes two experiments that did not report dichotomous outcome measures, four that did not provide cell means, and five that reported only “corrected” hit rates (hits − false alarms).
Two technical issues should be noted. First, calculation using cell means ignores random effects structure (e.g., correlated errors within subject or item; Barr, 2008). However, hardly any of the authors provided the information necessary to take into account random effects. In any case, Mahowald et al. (2016) found that this simplifying assumption had minimal effect on their results. Second, the majority of authors have assumed that the effect of WM maintenance, if any, will be on veridical memory, not guessing strategy. As such, most studies report only (apparent) memory success (successful recalls, hits, etc.) and do not address guess (e.g., by considering intrusions or false alarms). Our meta-analysis necessarily inherits this assumption.
Our list of covariates was determined by the literature: they cover the primary manipulations used. The following list contains all covariates that we systematically recorded for the entire data set. No others were included in analysis.
-
Δ(maintenance): Difference in retention interval between conditions.
-
Baseline (maintenance): Duration of WM maintenance in baseline (shortest) condition.
-
Memory set: Number of items to be simultaneously remembered.
-
Delay time: Length of delay between end of WM phase and start of LTM test.
-
Modality: Visual or verbal materials.
-
Response type: Whether the delayed memory test involved recall or recognition.
-
Initial test: Were target items tested during the WM phase?
-
Dual task: Was there a secondary (or primary) task during the WM phase (e.g., complex span tasks)?
-
Subject naiveté: Were subjects unaware that LTM would be tested?
As is common for measurements of time, we took the natural logarithm of maintenance duration and delay duration (ln(0) was avoided by adding 0.1 s to every time). Thus, Δ(maintenance) is a difference of logarithms. We confirmed this decision by running the analyses reported below both with raw and log maintenance durations, and obtained a substantially better Bayesian information criteria (BIC) for the latter.
Note also that we calculated maintenance duration from stimulus onset, because stimulus offset was rarely reported. This imprecision should have minimal impact on results, as the offset should be largely consistent within experiment.
Results
Using the above procedures, we obtained 513 log odds ratios based on 191,119 individual responses (see Fig. 1). We fit random effects metaregressions with restricted maximum likelihood using the metafor (Version 2.0) package in R (Version 3.3; R Core Team, 2017; Viechtbauer, 2010). Effect sizes were weighted by sample variance. Significance of parameter estimates and confidence intervals were calculated using robust inference clustered on experiment (Hedges, Tipton, & Johnson, 2010).

Funnel plot of raw effects included in meta-analysis. Regression test finds no evidence of asymmetry (z = −0.25, p = .81)
With nine moderators of interest, it is not possible to test all possible interactions. Thus, we conducted three metaregressions aimed at specific questions of interest. The first was a model with no covariates, which allowed us to test whether—across all 513 data points—there was in general evidence of an effect of WM maintenance on LTM. There was; subjects were 30% more likely to remember an item that had been maintained longer in WM than in baseline (B = 0.27, CI [0.16, 0.37], t = 5.28, p < .0001; see Table 2).Footnote 4
Next, we ran a follow-up analysis with all nine moderators as predictors (see Table 2). Because of missing data for some moderators, this was based on 438 data points. This analysis revealed a single significant effect: Δ(maintenance) (B = 0.18, CI [0.04, 0.32], t = 2.56, p = .01). Thus, larger differences in maintenance duration result in larger differences in odds ratios. In particular, an increase in WM maintenance from zero s to 2.7 s is estimated to increase the odds of LTM success by 19%. The only other moderator to approach significance was subject naiveté (B = −0.24, CI [−0.51, 0.03], t = −1.79, p = .08), reflecting an increased effect of WM when subjects expected an LTM test.
Finally, we asked whether the moderator Δ(maintenance) was itself modulated by any of the other moderators. Our final model included a main effect of Δ(maintenance) as well as interactions of Δ(maintenance) and each of the other eight moderators. (The remaining eight moderators were not included as simple effects.) Of the three models we tested, this “interaction” model fit the data the best (BIC = 658, vs. 783 and 682 for the first and second model, respectively). It also fit better than a model that included all simple effects as well as the interactions with Δ(maintenance) (BIC = 674).
Results are again shown in Table 2. Two effects were significant. The first was the interaction of Δ(maintenance) with modality (t = 2.61, p = .01), reflecting a larger effect of Δ(maintenance) for visual memory, the interaction of Δ(maintenance) with subject naiveté (t = 2.49, p = .02), reflecting a larger effect of Δ(maintenance) for subjects expecting an LTM test.
Discussion
The meta-analysis shows a clear improvement in LTM for items that have been maintained longer in WM—an effect that scales with the duration of maintenance. Statistically, there was some evidence that this effect is more pronounced for visual memory. However, that finding must be treated with some caution because only seven of the 513 data points in our meta-analysis involved visual memory. There was also some evidence that the effect may be larger if subjects expect an LTM test. However, the effect of WM was by no means specific to experiments where subject expected an LTM test. We reran the base metaregression that had no modulators using only the experiments where subjects were naïve. We again found a significant effect of WM maintenance (B = 0.22, CI [0.11, 0.34], t = 3.97, p = .0003).
There were a two null results of particular theoretical interest. In the first comprehensive review of this literature, Greene (1987) suggested that the effect of WM on LTM may be restricted to recognition, perhaps because continued maintenance provides few additional associations or recall cues. However, we find no evidence that the effect of WM is any stronger for recognition than recall.
A second null finding of interest regards the effect of an initial memory test on subsequent LTM. In many experiments in this literature, memory for the items of interest is tested both in the initial WM experiment and in the subsequent LTM experiment. A number of researchers have questioned whether this initial test, through some interaction with WM maintenance duration, is what drives the apparent effect of WM maintenance on LTM (Craik & Watkins, 1973; Maki & Schuler, 1980; McCabe, 2008; Shimizu, 1984). This suggestion resonates with some recent theoretical accounts on which any effect of WM maintenance on LTM is driven by “covert retrieval” during the retention interval (Loaiza & Halse, 2018; McCabe, 2008; Rose et al., 2014). However, we find no evidence that the WM–LTM effect is any stronger for experiments that involve an initial test during the WM phase than in those experiments that do not. Moreover, an initial follow-up analysis of our data set reveals that the odds of LTM success is actually slightly higher in studies that do not involve an initial test (39%) than those that do (31%).
Finally, there was no evidence that the effect of WM maintenance on subsequent LTM dissipates with time. This was despite considerable variation in how long the delay between the WM and LTM phases was, running from a few minutes to a few weeks. Thus, it seems unlikely that the observed effect is due to residual WM activity.
As noted in the Introduction, meta-analysis is limited by what studies happen to have been conducted previously. Moreover, meta-analysis does not necessarily lend itself to clean comparisons, as it collapses across many different experiments conducted in different manners. Thus, we follow up the meta-analysis with 13 new experiments. These experiments do not attempt to cover the full range of questions in the literature, but rather focus a couple. Our primary purpose was to establish whether WM maintenance affects subsequent LTM. While our meta-analysis shows this effect is well-evidenced in the literature, one cannot rule out a role for publication bias (though the funnel plot is promising; see Fig. 1).
Our secondary purpose was to investigate visual memory in particular. As noted in the Introduction, Baddeley, Gathercole, and colleagues have argued that any link between WM maintenance and LTM is specific to verbal memory and evolved for the purpose of supporting language acquisition (Baddeley et al., 1998; de Abreu, Gathercole, & Martin, 2011; Gathercole & Baddeley, 1990). However, nearly all prior work has investigated verbal memory. As noted in our meta-analysis, what evidence does exist suggests a WM–LTM link for visual materials as well, but the data are limited.
Experiments 1–8
In Experiments 1–8, we manipulated visual WM maintenance by comparing items that were maintained in WM with items that were merely attended or passively viewed (see Fig. 3). For data, scripts, and additional methodological details, see https://osf.io/kygt5/ (doi:10.17605/OSF.IO/KYGT5).
Each experiment began with a modified change-detection task, followed by an irrelevant filler task (watching an animated film clip), followed by a surprise memory test for the stimuli studied during the change-detection task (see Fig. 2). On each trial of the change-detection task (see Fig. 3), three stimuli were presented successively, with blank intervals in between. Subjects were to passively view the first stimulus and determine whether the second stimulus and third stimulus were the same. Crucially, while the first stimulus was merely viewed (passively viewed object) and the third stimulus was actively attended (attended object), only the second one had to be maintained in WM over a delay (stored object). The goal of including the attended object is to roughly match the stored object in terms of the amount of attention directed to the physical stimulus, ensuring that both had a reasonable opportunity to be encoded. We do not attempt to control for any differences in the amount of attention directed to the memory traces, since any such difference would be part of the phenomenon of interest.

All experiments began with a change-detection test, in which WM maintenance was manipulated. After an irrelevant filler task, participants engaged in a surprise recognition test, which compared recognition of stimuli as a function of previous WM maintenance

Schematic of a change-detection trial, depicting the Chinese character stimuli from Experiments 3 and 7. On each trial, three stimuli are presented. The first stimulus is to be viewed only (passively viewed object). The second is the item to be maintained in WM (stored object). The final stimulus is the probe (attended object), which the participant must judge to be same or different as the stored object. Thus, this object must be attended but need not be held in WM. By requiring the participant to wait at least 1,000 ms before responding, we ensured that the participant viewed the attended object at least as long as the stored and passively viewed objects
The change-detection task was followed by watching an irrelevant video, the duration of which varied across experiments in order to better ensure generality of results (see Table 3). The filler task was followed by a surprise recognition task. Different types of visual stimuli were used across the different experiments, again in order to ensure generality of results (see Fig. 4; Table 3).

Method
Participants
Participants in Experiments 1–10 were volunteers recruited online through a Web-based experiment portal (gameswithwords.org). Web-based experiments were chosen over a traditional laboratory-based approach, as they allow for much larger samples than in-lab experiments with comparable data quality (Germine et al., 2012). Participants were included if they (a) completed the experiment, (b) were 18–40 years old, (c) reported normal or corrected-to-normal vision, and (d) reported not having participated previously.Footnote 5 These exclusion criteria were determined in advance, and data from excluded subjects were not analyzed. Eleven participants were excluded from Experiments 3 and 7, which used Chinese characters as stimuli, for reporting the ability to read Chinese. Extensive research shows that Web-based studies are at least as reliable as brick-and-mortar studies but allow for much larger samples and thus greater statistical power (Germine et al., 2012). However, for comparison, subjects in Experiment 11 were tested in the laboratory and were prescreened for the exclusion criteria.
Based on pilot and preliminary results, the decision was made to aim for at least 100 subjects per experiment (excluding Experiment 11), though exact Ns depended on traffic to our online research lab (gameswithwords.org). The number of participants included per experiment is shown in Table 3.
Materials
Four different sets of 40 stimuli each that do not have names and which are difficult to verbally describe were chosen (see Fig. 3): 3-D shapes (Experiments 1, 5), greebles (Experiments 2, 6), Chinese characters (Experiment 3, 7, 9), and Fribbles (Experiments 4, 8, 10, 11). With the exception of the Chinese words, stimuli were created by Michael J. Tarr and colleagues (used with permission, http://www.tarrlab.org). Stimuli were presented at the center of the window against a white (Experiments 1, 2, 5, 6, 9) or gray (Experiments 2, 3, 7, 8, 10, 11) background.
Procedure
In Experiments 1-11, the change-detection task consisted of 10 trials (Experiments 1–3, 5–7, 9: 3-D, greeble, or Chinese stimuli) or eight trials (Experiments 4, 8, 10–11: fribble stimuli). On half the trials, the correct answer was “same”; for the other half, “different.” To further discourage verbal encoding, participants in the 3-D-shape and greeble experiments (Experiments 1–2 & 5–6) were asked to repeat the word cat subvocally. There were two practice trials, which participants could repeat if desired, following the same procedure but using a different set of stimuli.
With the exception of the fribbles experiments (discussed below), stimuli were fully randomized across trials and conditions separately for each participant. Fribbles have a highly salient family structure, and piloting revealed that fribbles from different families are easily distinguishable, resulting in a trivially easy change-detection task. Thus, on a given change-detection trial, all three objects from a given trial came from the same family: The passively viewed object and stored object differed from one another on all four appendages, while the attended object—if one was presented—had two appendages in common with each of the passively viewed and stored objects.
The filled delay consisted of watching a short (173 s; Experiments 1–4, 9–10) or long (577 s; Experiments 5–8, 11) video clip from Bill et John: Episode II (used with permission, KBS productions, http://billetjohn.free.fr). They were told to expect a quiz on the video, which did not take place.
In experiments involving Chinese characters, greebles, and 3-D shapes, the surprise recognition test involved the 15 objects from the no-match WM trials (five from each condition) and 15 novel lures. In the fribbles experiments, participants were tested on the 12 old objects (see above) and eight novel lures, two from each of the four fribbles families (one with all novel appendages, one that shared two appendages with the passively viewed object and two appendages with the stored object).Footnote 6
Results
All analyses for all experiments below were conducted by logit mixed effects linear regression, which is superior to ANOVA for analyzing accuracy data and is robust to unbalanced designs (Barr, 2008). Significance was assessed through model comparison. In no case was inclusion of random slopes justified by model comparison, and thus only random intercepts were used.
Accuracy in the change-detection task was high (see Table 3), except for the fribbles experiments, which likely reflects the high similarity among the fribbles stimuli. Of primary interest was whether memory was better for items that had been actively maintained in WM (stored objects) relative to the objects that had been attentively processed (the probes, or attended objects) or merely viewed (passively viewed objects), and whether this interacted with stimulus type or delay length. Analysis revealed the crucial main effect of memory condition, χ2(16) = 100, p < .0001, ΔAIC = 68. The left side of Fig. 5, which collapses across all experiments, shows this main effect: recognition of stored objects is superior to recognition of passively viewed and attended objects.
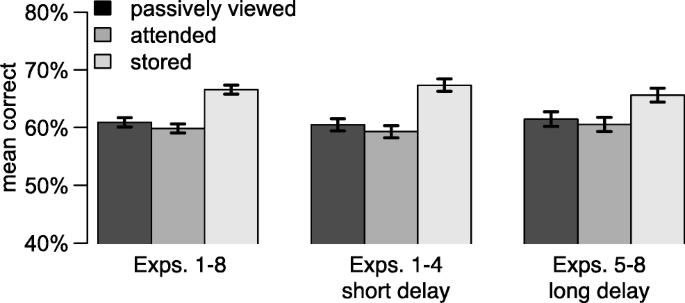
Percentage correct in the surprise recognition test, collapsing across experiments. Error bars represent standard errors of the mean
However, there was also a significant omnibus interaction, χ2(6) = 21, p = .001, ΔAIC = 8. Thus, we investigated each experiment separately (see Fig. 6). A significant effect of memory condition was found for Experiments 1, 3, 4, 5, 6, and 7: respectively, χ2(2) = 16, p = .0002, ΔAIC = 13; χ2(2) = 44, p < .0001, ΔAIC = 40; χ2(2) = 9, p = .01, ΔAIC = 5; χ2(2) = 18, p = .0001, ΔAIC = 4; χ2(2) = 8, p = .02, ΔAIC = 4; χ2(2) = 8, p = .02, ΔAIC = 4, but not for Experiment 2, χ2(2) = 0.5, p = .76, ΔAIC = 4, or Experiment 8, χ2(2) = .9, p = .92, ΔAIC = 3. The stored objects were recognized at a numerically superior rate to the passively viewed objects in six of eight comparisons, significantly so in five cases (Experiment 1: z = 2.8, p = .006, b = 0.3; Experiment 2: z = 0.5, p = .64, b = 0.05; Experiment 3: z = 4.9, p < .0001, b = 0.6; Experiment 4: z = 3.0, p = .003, b = 0.6; Experiment 5: z = 3.2, p = .001, b = 0.4; Experiment 6: z = 2.9, p = .004, b = 0.4; Experiment 7: z = 0.6, p = .54, b = 0.1; Experiment 8: z = 0.2, p = .86, b 0.03).Footnote 7 The stored objects were recognized at a numerically superior rate to the attended objects in seven of eight comparisons, significantly so in four cases (Experiment 1: z = 4.1, p < .0001, b = 0.4; Experiment 2: z = 0.7, p = .46, b=0.1; Experiment 3: z = 6.3, p < .0001, b = 0.8; Experiment 4: z = 0.9, p = .34, b = 0.2; Experiment 5: z = 4.1, p < .0001, b = 0.5; Experiment 6: z = 0.9, p = .36, b = 0.1; Experiment 7: z = 2.1, p = .03, b = 0.3; Experiment 8: z = 0.9, p = .36, b = 0.2).

Experiments 9–11
To further confirm these findings, we replicated Experiments 3, 4, and 8, with similar results (see Fig. 7).

Percentage correct in the surprise recognition test, for a replication of Experiment 3 (left; N = 90) and Experiment 4 (middle; N = 91), and Experiment 8 (right; N = 38). For the first two, the only difference from the original was that the filled delay video (142 s clip from “Kiwi”; used with permission, Dony Permedi, donysanimation.com); the pattern of significance was identical to the original experiments. The replication of Experiment 8 was run in-lab with Harvard undergraduates as participants, and the pattern of significance was identical to Experiment 4 (the short-delay fribbles experiment). Error bars represent standard errors of the mean
Discussion
In Experiments 1–11, objects maintained in WM were frequently better recognized than objects not maintained in WM. The stored items were not always the best recalled items in all experiments (cf. Experiments 7–8). This variability could be due to differences in experimental design across Experiments 1–11. However, random chance provides a simpler explanation. Our 11 experiments involve 22 pairwise comparisons. Observing the same result 22 times is astronomically unlikely in psychology experiments and usually indicates selective reporting or p-hacking (Francis, 2012). Indeed, collapsing across Experiments 1–11 (N = 1,154) reveals an average effect sizes of Cohen’s d = 0.2 for both the comparison of stored and passively viewed objects and the comparison of stored and attended objects. This is consistent with the results of our meta-analysis, where we observed a weighted mean effect size of 0.27 in terms of the log odds ratio, which is equivalent to a Cohen’s d of 0.15. To have an 80% chance of detecting an effect of size 0.2, one would need N = 198.Footnote 8 Thus, while we achieved greater statistical power than typical in psychology, we do not have nearly enough power to observe 22 consecutive significant effects. Thus, the overall pattern of results from Experiments 1–11 is consistent with a small but reliable effect of WM maintenance on LTM.
One potential concern is that retrieving an item from memory may enhance subsequent memory for that item (Carrier & Pashler, 1992). Thus one might worry that testing the stored items during the WM task is responsible for their superior LTM. However, as discussed above, our meta-analysis provides little support for this concern. Moreover, the “testing effect” appears to be specific to recall and have minimal effect on recognition (Chan & McDermott, 2007). Nonetheless, we address this concern directly in Experiments 12–13.
Another potential concern is that participants may have attended to the stored items more than the passively viewed and attended items. Note that it is not clear that more attention to already attended items necessarily results in better LTM (Hyde & Jenkins, 1973; Makovski, Jiang, & Swallow, 2013), nor is it even clear that WM and attention are separable (Cowan, 2008). Out of caution, we had attempted to mitigate this by (a) using relatively hard change-detection tasks, requiring considerable attention to the attended items, and (b) presenting the attended items longer than the stored items were presented (see Fig. 3). However, we cannot directly test whether attention during encoding was equal across stimuli. We address this concern as well in Experiments 12–13.
Experiments 12–13
The outline for Experiments 12–13 is shown in Fig. 8. The primary differences in the method relative to Experiments 1–11 was in the change-detection task. Specifically, the duration of WM maintenance was manipulated by means of a retrocue: On half of the change-detection trials, long after encoding but before the test display, a retrocue indicated which stimulus would be probed (cf. Griffin & Nobre, 2003; LaRocque et al., 2015; Souza & Oberauer, 2016). The cue was 100% valid, and therefore the remaining items no longer needed to be maintained. Crucially, the positive test items were all taken from no-match trials and thus had appeared just once during the first phase of the experiment. As described below, this design addresses concerns about the effect of the initial WM probe.

Schematic of Experiment 12. In the change-detection task (top), participants determined whether the uppercase probe matched the lowercase stimulus previously presented in that location. In the recognition task (bottom), participants decided whether they had ever seen that item before; examples of the five trial types are shown (compare with change-detection stimuli). Note that the use of capital letters in the change-detection task probe and in the surprise recognition test necessitates verbal encoding of stimuli, minimizing the role of visual memory
In order to test generality across modality, we tested both verbal memory (Experiment 12) and visual memory (Experiment 13).
Method
Participants
Participants were recruited and tested online, either through the first author’s Web-based experimental portal gameswithwords.org (N = 295) or through Amazon Mechanical Turk (mturk.com; N = 814). Subjects were included only if they (a) completed the experiment, (b) were native speakers of English ages 18–40 years, (c) reported not knowing Chinese, (d) reported normal or corrected-to-normal vision, (e) reported not having participated previously. These exclusion criteria were determined in advance, and data from excluded subjects were not analyzed. An additional 35 participants were excluded for scoring 50% or below in the change-detection task (all but one in Experiment 12). After exclusions, 342 subjects participated in Experiment 12, and 472 participated in Experiment 13.
Materials
Stimuli in Experiment 12’s change-detection task were 130 novel two-syllable words (e.g., beeru, raygay, mulu). On no-match trials, the nonmatching stimulus mismatched on exactly one syllable (beeru vs. quayru). The memory set in the change-detection task was presented in all lowercase, whereas the probes in the change-detection task and all the stimuli in the surprise memory test were in all caps, thus diminishing any role of visual memory. To further ensure that the stimuli no longer looked the same, the novel words exclusively used letters that look different in uppercase and lowercase in Times New Roman font (e.g., a, e, A, E).
Stimuli in Experiment 13 consisted of 132 Chinese characters. Chinese characters were chosen because they are difficult to name, decreasing any effect of verbal memory.
Procedure
Each experiment consisted of three consecutive phases: A change-detection task, a filled-delay phase, and a surprise recognition task (see Figs. 1 and 8).
The change-detection task consisted of 24 trials across four conditions (cued/match, cued/no-match, no-cue/match, no-cue/no-match). Which stimuli appeared in which condition was randomized without repetition for each participant. Pilot testing revealed that the Chinese stimuli were harder to remember than the pronounceable nonwords, but required less encoding time. Thus, in Experiment 12, participants had 2.3 seconds to encode three nonwords, whereas in Experiment 13, participants had 2.0 seconds to encode four Chinese characters. To familiarize subjects with the task, the change-detection task began with a 12-trial practice session involving unpronounceable letter strings. Participants could repeat the practice if they wished.
Immediately after completing the change-detection task, participants engaged in an irrelevant language task, in which they tried to identify words matching definitions (this is the norming task for an unrelated experiment). This task took several minutes to complete.
Participants were given a surprise test of their memory for the objects used in the change-detection phase. The test consisted of 24 stimuli that appeared in the change-detection task. Of these, 12 were stimuli from retrocue trials: six cued (cued-probe) and six not cued (cued-ignore). The remaining 12 stimuli came from neutral, no-cue trials: six were stimuli that were probed (neutral-probe) and six were stimuli that were not probed (neutral-no-probe). Importantly, the positive test items were all taken from no-match trials, and thus all stimuli appeared just once during the first phase of the experiment. These 24 stimuli were intermixed with 24 novel foils (see Fig. 7). The stimuli appeared randomly one at a time, and subjects indicated whether or not they have seen the stimulus at any time during the first phase of the experiment by clicking by mouse on “old” or “new” buttons presented on the screen.
In Experiments 1–11, we assumed that subjects had not expected the surprise LTM test. This was validated in Experiments 12–13: In debriefing, 94% of participants reported not expecting this test.
Results
Change-detection test
Mean accuracy was 84% in Experiment 12 (range: 58%–100%; SD = 10%) and 71% in Experiment 13 (range: 52%–100%; SD = 10%). Change-detection accuracy was higher for trials with retrocues (Experiment 12: M = 86%, SD = 11%; Experiment 13: M = 75%, SD = 14%) than no-cue trials (Experiment 12: M = 82%, SD = 14%; Experiment 13: M = 68%, SD = 14%), an effect that was significant in both experiments (Experiment 12: χ2 = 21.5, p < .001, ΔAIC = 21; Experiment 13: χ2 = 56.6, p < .001, ΔAIC = 55).
Surprise memory test
There was a significant interaction of cue (retrocue, no-cue) by probe (probe, no-probe) for both Experiment 12 (χ2 = 13.0, p < .001, ΔAIC = 24) and Experiment 13 (χ2 = 6.3, p = .01, ΔAIC = 4), reflecting the fact that recognition was better for the cued-probe items than for the cued-ignore items (Experiment 12: z = 6.2, p < .001, b = 0.4; Experiment 13: z = 3.2, p = .001, b = 0.2), with no such difference for neutral-probed and neutral-no-probe items (Experiment 12: z = 1.1, p = .25, b = 0.1; Experiment 13: z = 0.4, p = .68, b = 0.02; Fig. 9). Note that the lack of an advantage for the neutral-probed items over the neutral-no-probe items rules out the possibility that the cued-probe advantage is due to an advantage for items that had been explicitly tested.

Percentage correct in the surprise memory test for the four critical conditions. Error bars represent ±1 standard error
Discussion
Experiments 12–13 again confirmed that the longer an item is held in WM, the stronger its subsequent LTM representation, as shown by the difference between the cued-probe and cued-ignore conditions. Recognition was also better for the cued-probe stimuli than for neutral-probe and neutral-no-probe stimuli (Experiment 12: χ2 = 9.9, p = .001, ΔAIC = 8; Experiment 13: χ2 = 8.4, p = .004, ΔAIC = 6). This, too, may be driven by duration of maintenance: accuracy in the change-detection task was lower in the neutral condition, suggesting a higher rate of forgetting and thus a shorter duration of maintenance. Another possible explanation is that subsequent to the retrocue, participants could concentrate WM resources on a single cued item (Souza, Rerko, & Oberauer, 2014); this more concentrated WM maintenance may increase the cued item’s durability (Makovski & Jiang, 2007). Either way, although all items were initially equally encoded into WM, manipulating verbal and visual WM representations during retention affected subsequent LTM.Footnote 9
General discussion
A meta-analysis of 60 prior experiments and results from 13 large-N new experiments converge to indicate that manipulating the amount of WM maintenance results in superior LTM.
Wherever there is a large, contradictory literature, it is reasonable to question how much one more paper can move the needle. Here, the scale of the present study is highly relevant. The meta-analysis combined data from 190,255 responses (LTM trials), and the 13 new experiments provide an additional 79,622—42% as many. Thus, the finding that WM maintenance improves subsequent LTM is based on orders of magnitude more data than in the typical paper. Moreover, the meta-analysis and new experiments show convergence over a wide variety of methods and materials.
How do we explain the fact that some experiments do not show an effect of WM maintenance on subsequent LTM—including some of our own experiments? The most parsimonious explanation is random chance. Indeed, our power analysis suggests that many of our experiments had less than an 80% chance of detecting the effect. A more typically sized experiment of N = 25 would find the effect only 16% of the time.
This does not mean that the effect is negligible. Although a Cohen’s d of 0.2 is classified as “small,” it is well within the normal range for psychology (Hartshorne & Schachner, 2012). Thus, as a qualitative result, this finding is consistent with theories on which WM maintenance should improve LTM (Atkinson & Shiffrin, 1968; Baddeley, 2003; Baddeley et al., 1998). These tend to be dual-store theories. For instance, Atkinson and Shiffrin (1968) posit that WM sits between perception and LTM, and information must be transferred from WM to LTM, naturally predicting our effect.
There is a separate question as to whether our findings are quantitatively consistent with these theories. For instance, the effect may be too small to play the role posited for it by Baddeley and Gathercole with respect to language acquisition (Baddeley et al., 1998). Answering that question will require analysis of computational models.
Our findings challenge accounts under which WM maintenance should have no effect on LTM (Baddeley, 1983; Craik, 2002; Craik & Lockhart, 1972). Most of these are single-store theories (though not all; cf. Baddeley, 1983), on which WM is temporary activation of LTM (Anderson, 1983; Craik, 2002; Cowan, 2008; Postle, 2006), are generally understood not to predict effects of WM on LTM. This prediction is directly challenged by our results. However, whether this is a necessary prediction of such theories depends on a more nuanced understanding of the mechanisms of LTM activation, and thus suggests a direction for future research.
As already noted, our results provide a crucial qualitative confirmation of the hypothesis that verbal WM maintenance underlies vocabulary acquisition, particularly the acquisition of phonological form (Adams & Gathercole, 2000; Andrade & Baddeley, 2011; Baddeley et al., 1998; de Abreu et al., 2011; Ellis & Sinclair, 1996; Gathercole & Baddeley, 1990; Service, 1992; Service & Kohonen, 1995). As noted in the Introduction, while there was indirect evidence for this hypothesis, its status was uncertain as long as it was unclear whether directly manipulating WM maintenance affects LTM. Our results raise questions for Baddeley et al.’ (1998) speculation that the mechanisms of verbal WM maintenance (the phonological loop) evolved specifically to support vocabulary acquisition, since visual memory showed the same effect. This finding raises three possibilities: (1) the WM–LTM link is independent of modality, (2) the WM–LTM link evolved independently for the verbal and visual modalities, or (3) the phonological loop evolved to exploit a preexisting WM–LTM link. The third possibility receives some support from the fact that the effect was larger in Experiment 12 than Experiment 13, though caution is required since we did not match our verbal and visual items on complexity or discriminability.
Another question we leave open regards what the mechanics of WM maintenance are, or why they would result in greater LTM. These are of course important and difficult questions. Our present contribution is to clarify that they need to be answered.
We conclude with a final, broader point. Half a century of investigation of the effect of WM maintenance on subsequent LTM resulted in a confusing, inconclusive literature. Some of the confusion was almost certainly conceptual, as researchers worked out new paradigms and theories. However, it appears that low statistical power was a significant roadblock. Researchers attempted to explain divergent findings that likely diverged due to chance alone. We suggest that researchers bear this in mind when deciding how to balance data collection priorities between obtaining a larger sample for one experiment or conducting several smaller experiments that use diverging methods (cf. Bishop, 2018).
Notes
Some representative quotes follow. Blumenfeld and Ranganath (2006) write that “both WM maintenance (Greene, 1987; Davachi, Maril, & Wagner, 2001; Dobbins et al., 2004; Ranganath, Cohen, & Brozinsky, 2005) and organizational processing (Tulving and Pearlstone, 1966; Bower, 1970; Sternberg and Tulving, 1977; Hunt and Einstein, 1981; Davachi and Wagner, 2002) promote LTM formation” (p. 916). Bower (2000) writes that “repetitive going over of verbal items results in very little memory later—that is, ‘mindless’ rehearsal per se is not sufficient to create durable memories” (p. 22). Camos (2015) writes, “Although some benefit was observed on recognition tests, increasing its duration of use did not lead to consistent improvement in delayed recall (Greene, 1987), something any student could confirm: The mere repetition of information does not allow a lasting acquisition of knowledge” (p. 443). Many additional examples of both types could be gleaned from reviewers of the present manuscript.
Papers in the meta-analysis: Aldridge & Crisp, 1982; Bartsch, Singmann, & Oberauer, 2018; Bonvillian, JRea, Orlansky, & Slade, 1987; Bradley & Glenberg, 1983; Camos, 2015; Camos, & Portrat, 2015; Craik, 1970; Craik & Watkins, 1973; Dark & Loftus, 1976; Darley & Glass, 1975; Geiselman & Bjork, 1980; Glenberg & Adams, 1978; Glenberg & Bradley, 1979; Glenberg, Smith & Green, 1977; Jacoby, 1973; Jacoby & Bartz, 1972; LaRocque, Eichenbaum, Starrett, Rose, Emrich, Postle, 2015; Loaiza, Duperreault, Rhodes & McCabe, 2015; Loaiza & Halse, 2018; Loaiza & McCabe, 2012; Maki & Schuler, 1980; McCabe, 2008; Modigliani & Seamon, 1974; Nairne, 1983; Naveh-Benjamin & Jonides, 1984a; Naveh-Benjamin & Jonides, 1984b; Phaf & Wolters, 1993; Roenker, 1974; Rundus, 1977; Rundus, Loftus & Atkinson, 1970; Shimizu, 1984; Souza & Oberauer, 2017; Dobbins et al., 2004; Tulving and Pearlstone, 1966; Bower, 1970; Sternberg and Tulving, 1977; Hunt and Einstein, 1981; and Davachi and Wagner, 2002. For more details, see supplementary materials https://osf.io/kygt5/
Most papers reported means through graphs. We extracted means from graphs using WebPlotDigitizer (Rohatgi, 2018).
Note that the regression coefficient is a log odds ratio. The odds ratio is thus exp(0.2656) = 1.3042.
It is possible that some of these subsequently participated in Experiments 12–13, which partly drew from the same population, though in general there are few repeat visitors to the gameswithwords.org (as based on Google Analytics traffic reports). Repeat participants would primarily be a problem if it resulted in participants expecting the surprise memory test; Debriefing for Experiments 12–13 indicate that this is not the case.
A programming error resulted in incorrect feedback for 60% of the trials in fribbles experiments. Importantly however, the pattern of results reported in the main text is still significant in the omnibus analysis (p < .0001), even with the fribbles experiments excluded.
These analyses are pairwise comparisons in mixed effects linear models involving only the relevant data. Regression coefficients reflect the absolute value of the difference in log odds.
Effect size and power analyses are not yet fully worked out for mixed-effects logistic regressions. Analyses here are based on by-subjects t tests over log-odds accuracy.
Alternatively, the retro cue might have led participants to suppress the cued-ignore stimuli, and it was this that led to the observed difference in performance. Note that this suppression effect would still be an effect of WM operations on LTM, if different from the one normally hypothesized. Evidence was unclear: Cued-ignore items were remembered significantly worse than neutral items in Experiment 12 (z = 2.9, p = .003, b = 0.2), but not in Experiment 13 (z = 1.2, p = .22, b = 0.1). This possibility does not apply to Experiments 1–11.
References
Adams, A.-M., & Gathercole, S. E. (2000). Limitations in working memory: Implications for language development. International Journal of Language and Communication Disorders, 35, 95–116.
Aldridge, J. W., & Crisp, T. (1982). Maintenance rehearsal and long-term recall with a minimal number of items. The American Journal of Psychology, 95(4), 565–570.
Anderson, J. R. (1983). The architecture of cognition. Cambridge, MA: Harvard University Press.
Andrade, J., & Baddeley, A. (2011). The contribution of phonological short-term memory to artificial grammar learning. The Quarterly Journal of Experimental Psychology, 64, 960–974.
Atkinson, R. C., & Shiffrin, R. M. (1968). Human memory: A proposed system and its control processes. In K. W. Spence (Ed.), The psychology of learning and motivation: Advances in research and theory (pp. 89–195). New York, NY: Academic Press.
Baddeley, A., Chincotta, D., & Adlam, A. (2001). Working memory and the control of action: Evidence from task switching. Journal of Experimental Psychology: General, 130(4), 641–657.
Baddeley, A., Gathercole, S., & Papagno, C. (1998). The phonological loop as a language learning device. Psychological Review, 105, 158–173.
Baddeley, A., Papagno, C., & Vallar, G. (1988). When long-term learning depends on short-term storage. Journal of Memory and Language, 27, 586–595.
Baddeley, A. D. (1983). Working memory. Philosophical Transactions of the Royal Society of London B, 302, 311–324.
Baddeley, A. D. (1993). Short-term phonological memory and long-term learning: A single case study. European Journal of Cognitive Psychology, 5, 129–148.
Baddeley, A. D. (2003). Working memory: Looking back and looking forward. Nature Reviews Neuroscience, 4(10), 829–839.
Bakker, M., van Dijk, A., & Wicherts, J. M. (2012). The rules of the game called psychological science. Perspectives on Psychological Science, 7, 543–554.
Barr, D. (2008). Analyzing ‘visual world’ eyetracking data using multilevel logistic regression. Journal of Memory and Language, 59, 457–474.
Bartsch, L. M., Singmann, H., & Oberauer, K. (2018). The effects of refreshing and elaboration on working memory performance, and their contributions to long-term memory formation. Memory & Cognition, 1–13. Advance online publication. https://doi.org/10.3758/s13421-018-0805-
Bishop, D. (2018, July 12). One big study or two small studies? Insights from simulations [Web log post]. Retrieved from http://deevybee.blogspot.com/2018/07/one-big-study-or-two-small-studies.html
Blumenfeld, R. S., & Ranganath, C. (2006). Dorsolateral prefrontal cortex promotes long-term memory formation through its role in working memory organization. The Journal of Neuroscience, 26, 916–925.
Bonvillian, J. D., Rea, C. A., Orlansky, M. D., & Slade, L. A. (1987). The effect of sign language rehearsal on deaf subjects’ immediate and delayed recall of English word lists. Applied PsychoLinguistics, 8(1), 33–53.
Bower, G. H. (2000). A brief history of memory research. In E. Tulving & F. I. M. Craik (Eds.), The Oxford handbook of memory (pp. 3–32). New York, NY: Oxford University Press.
Bradley, M. M., & Glenberg, A. M. (1983). Strengthening associations: Duration, attention, or relations?. Journal of Memory and Language, 22(6), 650.
Camos, V. (2015). Storing verbal information in working memory. Current Directions in Psychological Science, 24(6), 440–445.
Camos, V., Lagner, P., & Barrouillet, P. (2009). Two maintenance mechanisms of verbal information in working memory. Journal of Memory and Language, 61, 457-469.
Carrier, M., & Pashler, H. (1992). The influence of retrieval on retention. Memory & Cognition, 20(6), 633–642.
Chan, J. C. K., & McDermott, K. B. (2007). The testing effect in recognition memory: A dual process account. Journal of Experimental Psychology: Learning, Memory, and Cognition, 33(2), 431–437.
Cowan, N. (1988). Evolving conceptions of memory storage, selective attention, and their mutual constraints within the human information processing system. Psychological Bulletin, 104, 164–191.
Cowan, N. (2008). What are the differences between long-term, short-term, and working memory? In W. S. Sossin, J.-C. Lacaille, V. F. Castellucci, & S. Belleville (Eds.), Progress in brain research: Essence of memory (Vol. 169, pp. 323–338). Amsterdam, Netherlands: Elsevier B. V.
Craik, F. I. (1970). The fate of primary memory items in free recall. Journal of Verbal Learning and Verbal Behavior, 9(2), 143–148.
Craik, F. I. M. (2002). Levels of processing: Past, present … and future? Memory, 10, 305–318.
Craik, F. I. M., & Lockhart, R. S. (1972). Levels of processing: A framework for memory research. Journal of Verbal Learning and Verbal Behavior, 11, 671–684.
Craik, F. I. M., & Watkins, M. J. (1973). The role of rehearsal in short-term memory. Journal of Verbal Learning and Verbal Behavior, 12, 599–607.
Dark, V. J., & Loftus, G. R. (1976). The role of rehearsal in long-term memory performance. Journal of Verbal Learning and Verbal Behavior, 15, 479–490.
Darley, C. F., & Glass, A. L. (1975). Effects of rehearsal and serial list position on recall. Journal of Experimental Psychology: Human Learning and Memory, 1(4), 453.
Davachi, L., Maril, A., & Wagner, A. D. (2001). When keeping in mind supports later bringing to mind: Neural markers of phonological rehearsal predict subsequent remembering. Journal of Cognitive Neuroscience, 13, 1059–1070.
de Abreu, P. M. J. E., Gathercole, S. E., & Martin, R. (2011). Disentangling the relationship between working memory and language: The roles of short-term storage and cognitive control. Learning and Individual Differences, 21, 569–574.
Ellis, N. C., & Sinclair, S. G. (1996). Working memory in the acquisition of vocabulary and syntax: Putting language in good order. The Quarterly Journal of Experimental Psychology, 49A(1), 234–250.
Elmes, D. G., & Bjork, R. A. (1975). The interaction of encoding and rehearsal processes in the recall of repeated and nonrepeated items. Journal of Verbal Learning and Verbal Behavior, 14(1), 30–42. https://doi.org/10.1016/S0022-5371(75)80004-1
Fanelli, D., Costas, R., & Ioannidis, J. P. (2017). Meta-assessment of bias in science. Proceedings of the National Academy of Sciences, 114(14), 3714–3719. https://doi.org/10.1073/pnas.1618569114
Ferguson, C. J., & Heene, M. (2012). A vast graveyard of undead theories: Publication bias and psychological science’s aversion to the null. Perspectives on Psychological Science, 7(6), 555–561.
Francis, G. (2012). The psychology of replication and the replication of psychology. Perspectives on Psychological Science, 7, 585–594.
Gathercole, S. E., & Baddeley, A. D. (1990). Phonological memory deficits in language disordered children: Is there a causal connection? Journal of Memory and Language, 29, 336–360.
Geiselman, R. E., & Bjork, R. A. (1980). Primary versus secondary rehearsal in imagined voices: Differential effects on recognition. Cognitive Psychology, 12, 188–205.
Germine, L., Nakayama, K., Duchaine, B. C., Chabris, C. F., Chatterjee, G., & Wilmer, J. B. (2012). Is the Web as good as the lab? Comparable performance from Web and lab in cognitive/perceptual experiments. Psychonomic Bulletin & Review, 19, 847–857.
Glenberg, A., & Adams, F. (1978). Type I rehearsal and recognition. Journal of Verbal Learning and Verbal Behavior, 17, 455–463.
Glenberg, A., Smith, S. M., & Green, C. (1977). Type I rehearsal: Maintenance and more. Journal of Verbal Learning and Verbal Behavior, 16, 339–352.
Glenberg, A. M., & Bradley, M. M. (1979). Mental contiguity. Journal of Experimental Psychology: Human Learning and Memory, 5(2), 88–97.
Greene, R. L. (1987). Effects of maintenance rehearsal on human memory. Psychological Bulletin, 102(3), 403.
Griffin, I. C., & Nobre, A. C. (2003). Orienting attention to locations in internal representations. Journal of Cognitive Neuroscience, 15, 1176–1194.
Hartshorne, J. K., & Schachner, A. (2012). Tracking replicability as a method of post-publication open evaluation. Frontiers in Computational Neuroscience, 6(8). https://doi.org/10.3389/fncom.2012.00008
Hebb, D. O. (1961). Distinctive features of learning in the higher animal. In J. F. Delafresnaye (Ed.), Brain mechanisms and learning (pp. 37–46). London, UK: Oxford University Press.
Hedges, L. V., Tipton, E., & Johnson, M. C. (2010). Robust variance estimation in meta-regression with dependent effect size estimates. Research Synthesis Methods, 1, 39–65.
Hyde, T. S., & Jenkins, J. J. (1973). Recall for words as a function of semantic, graphic, and syntactic orienting tasks. Journal of Verbal Learning and Verbal Behavior, 12(5), 471–480.
Jacoby, L. L. (1973). Encoding processes, rehearsal, and recall requirements. Journal of Verbal Learning and Verbal Behavior, 12, 302–310.
Jacoby, L. L., & Bartz, W. H. (1972). Rehearsal and transfer to LTM. Journal of Verbal Learning and Verbal Behavior, 11, 561–565.
Johnson, M. K., Mitchell, K. J., Raye, C. L., & Greene, E. J. (2004). An age-related deficit in prefrontal cortical function associated with refreshing information. Psychological Science, 15(2), 127–132.
Johnson, M. K., Reeder, J. A., Raye, C. L., & Mitchell, K. J. (2002). Second thoughts versus second looks: An age-related deficit in reflectively refreshing just-activated information. Psychological Science, 13(1), 64–67.
Khader, P., Ranganath, C., Seemuller, A., & Rosler, F. (2007). Working memory maintenance contributes to long-term memory formation: Evidence from slow event-related brain potentials. Cognitive, Affective, & Behavioral Neuroscience, 7(3), 212–224.
LaRocque, J. J., Eichenbaum, A. S., Starrett, M. J., Rose, N. S., Emrich, S. M., & Postle, B. R. (2015). The short- and long-term fates of memory items retained outside the focus of attention. Memory & Cognition, 43, 453–468.
Lewandowsky, S., Oberauer, K., & Brown, G. D. (2009). No temporal decay in verbal short-term memory. Trends in Cognitive Sciences, 13(3), 120–126.
Loaiza, V. M., Duperreault, K. A., Rhodes, M. G., & McCabe, D. P. (2015). Long-term semantic representations moderate the effect of attentional refreshing on episodic memory. Psychonomic Bulletin & Review, 22(1), 274–280.
Loaiza, V. M., & Halse, S. C. (2018). Where working memory meets long-term memory: The interplay of list length and distractors on memory performance. Journal of Experimental Psychology: Learning, Memory, and Cognition.
Loaiza, V. M., & McCabe, D. P. (2012). Temporal–contextual processing in working memory: Evidence from delayed cued recall and delayed free recall tests. Memory & Cognition, 40(2), 191–203.
Mahowald, K., James, A., Futrell, R., & Gibson, E. (2016). A meta-analysis of syntactic priming in language production. Journal of Memory and Language, 91, 5–27.
Maki, R. H., & Schuler, J. (1980). Effects of rehearsal duration and level of processing on memory for words. Journal of Verbal Learning and Verbal Behavior, 19, 36–45.
Makovski, T., & Jiang, Y. V. (2007). Distributing versus focusing attention in visual short-term memory. Psychonomic Bulletin & Review, 14(6), 1072–1078.
Makovski, T., Jiang, Y. V., & Swallow, K. M. (2013). How do observer’s responses affect visual long-term memory? Journal of Experimental Psychology: Learning, Memory, and Cognition, 39, 1097–1105.
McCabe, D. P. (2008). The role of covert retrieval in working memory span tasks: Evidence from delayed recall tests. Journal of Memory and Language, 58, 480–494.
Modigliani, V., & Seamon, J. G. (1974). Transfer of information from short-to long-term memory. Journal of Experimental Psychology, 102(5), 768.
Naveh-Benjamin, M., & Jonides, J. (1984a). Cognitive load and maintenance rehearsal. Journal of Verbal Learning and Verbal Behavior, 23, 494–507.
Naveh-Benjamin, M., & Jonides, J. (1984b). Maintenance rehearsal: A two-component analysis. Journal of Experimental Psychology: Learning, Memory, and Cognition, 10, 369–385.
Nelson, T. O. (1977). Repetition and depth of processing. Journal of Verbal Learning and Verbal Behavior, 16, 151–171.
Oberauer, K., & Meyer, N. (2009). The contributions of encoding, retention, and recall to the Hebb effect. Memory, 17(7), 774–781.
Phaf, R. H., & Wolters, G. (1993). Attentional shifts in maintenance rehearsal. The American Journal of Psychology, 106, 353–382.
Postle, B. R. (2006). Working memory as an emergent property of the mind and brain. Neuroscience, 139, 23–38.
R Core Team. (2017). R: A language and environment for statistical computing [Computer software]. Vienna, Austria: R Foundation for Statistical Computing. Retrieved from https://www.R-project.org/
Ranganath, C., Cohen, M. X., & Brozinsky, C. J. (2005). Working memory maintenance contributes to long-term memory formation: Neural and behavioral evidence. Journal of Cognitive Neuroscience, 17(7), 994–1010.
Roenker, D. L. (1974). Role of rehearsal in long-term retention. Journal of Experimental Psychology, 103, 368–371.
Rohatgi, A. (2018). WebPlotDigitizer (Version 4.1) [Computer software]. https://automeris.io/WebPlotDigitizer/
Rose, N. (2010). A processing approach to the working memory/long-term memory distinction: Evidence from a levels-of-processing span task (Doctoral dissertation). University of Washington–St. Louis, St. Louis, MO.
Rose, N. S., Buchsbaum, B. R., & Craik, F. I. M. (2014). Short-term retention of a single word relies on retrieval from long-term memory when both rehearsal and refreshing are disrupted. Memory & Cognition, 42, 689–700.
Rundus, D. (1977). Maintenance rehearsal and single-level processing. Journal of Verbal Learning and Verbal Behavior, 16, 665–681.
Rundus, D., Loftus, G. R., & Atkinson, R. C. (1970). Immediate free recall and three-week delayed recognition. Journal of Verbal Learning and Verbal Behavior, 9(6), 684–688.
Saeki, E., & Saito, S. (2004). Effect of articulatory suppression on task-switching performance: Implications for models of working memory. Memory, 12(3), 257–271.
Schon, K., Hasselmo, M. E., LoPresti, M. L., Tricarico, M. D., & Stern, C. E. (2004). Persistence of parahippocampal representation in the absence of stimulus input enhances long-term encoding: A functional magnetic resonance imaging study of subsequent memory after a delayed match-to-sample task. The Journal of Neuroscience, 24, 11088–11097.
Service, E. (1992). Phonology, working memory, and foreign-language learning. Quarterly Journal of Experimental Psychology, 45A(1), 21–50.
Service, E., & Kohonen, V. (1995). Is the relation between phonological memory and foreign language learning accounted for by vocabulary acquisition? Applied PsychoLinguistics, 16, 155–172.
Shimizu, H. (1984). Nature of maintenance rehearsal in relation to delayed recognition and utterance. Japanese Psychological Research, 26(1), 24–31.
Souza, A. S., & Oberauer, K. (2016). In search of the focus of attention in working memory: 13 years of the retro-cue effect. Attention, Perception, & Psychophysics, 78(7), 1839–1860.
Souza, A. S., & Oberauer, K. (2017). Time to process information in working memory improves episodic memory. Journal of Memory and Language, 96, 155–167.
Souza, A. S., Rerko, L., & Oberauer, K. (2014). Unloading and reloading working memory: Attending to one item frees capacity. Journal of Experimental Psychology: Human Perception and Performance, 40, 1237–1256.
Trojano, L., & Grossi, D. (1995). Phonological and lexical coding in verbal short-term memory and learning. Brain and Cognition, 21, 336–354.
Vallar, G., & Baddeley, A. D. (1984). Fractionation of working memory: Neuropsychological evidence for a phonological short-term store. Journal of Verbal Learning and Verbal Behavior, 23, 151–161.
Vergauwe, E., & Langerock, N. (2017). Attentional refreshing of information in working memory: Increased immediate accessibility of just-refreshed representations. Journal of Memory and Language, 96, 23–35.
Viechtbauer, W. (2010). Conducting meta-analyses in R with the metafor package. Journal of Statistical Software, 36(3), 1–48.
Waugh, N. C., & Norman, D. A. (1965). Primary memory. Psychological Review, 72, 89–104.
Woodward, A. E., Jr., Bjork, R. A., & Jongeward, R. H. (1973). Recall and recognition as a function of primary rehearsal. Journal of Verbal Learning and Verbal Behavior, 12, 608–617.
Acknowledgements
We thank Lauren Skorb, Tianhu Chen, Ning Duan, Rachel Duquette, Julie Hong, David Kocen, Jungho Lee, and Eric Seferian for help with the meta-analysis; Yuhong Jiang, Jenn Richler, Tim Brady, Khena Swallow, Jennifer Richler, Jeroen Raaijmakers, and several anonymous reviewers for comments; and NSF 0345525, NSF GRFP, NDSEG, and NRSA 5F32HD072748.
Author information
Authors and Affiliations
Contributions
Both authors contributed to study design. Testing and data analysis were conducted by J.K.H. J.K.H. drafted the manuscript, with critical revisions suggested by T.M.
Corresponding author
Additional information
Publisher’s note
Springer Nature remains neutral with regard to jurisdictional claims in published maps and institutional affiliations.
Rights and permissions
About this article

Cite this article
Hartshorne, J.K., Makovski, T. The effect of working memory maintenance on long-term memory. Mem Cogn 47, 749–763 (2019). https://doi.org/10.3758/s13421-019-00908-6
Published:
Issue Date:
DOI: https://doi.org/10.3758/s13421-019-00908-6