
Abstract
Conflict or dispute is common, involving a mismatch of interests or deficit resources shared among the contestants. Eventually, the conflict also exists among the co-riparian states of transboundary rivers contributed by the surrounding lands. In turn, river water needs to be shared based on their deservedness and agreeable to co-riparian. In this study, the inter-state (Kerala, Tamil Nadu and Karnataka) dispute over sharing Cauvery River waters in South Peninsular India is being taken up for analysis and game-theoretic modelling. Various options available to the contending co-basin states were analyzed. Also, ‘Fair and Equitable allocations’ were derived based on the deservedness of the contender and considered one of the options on each side of the riparian in the Metagame Analysis. ‘Equity’ describes deservedness based on contribution. The two components of Fairness and Equity (F&E) includes ‘Proportionality and Egalitarianism’. The former talks about deservedness, and the second talks about that equals should be treated equally, and unequal should be treated accordingly. The options adopted by any given player must reflect the hydrologic reality of flow availability. In this regard, options were developed based on the categories of unimpaired flows given as (1) maximum (MAX); (2) upper quartile (UQ), median (MED), and lower quartile (LQ); and (3) minimum (MIN). Accordingly, separate sets of options have been proposed for each player corresponding to each of the above mentioned three flow categories of MAX, [UQ, MED, LQ] and MIN. Metagame Analysis is then used to generate equilibrium outcomes and feasible solutions for three flow categories. For example, for the flow category of LQ, the equilibrium outcome arrived is (1 0 1 0, 1 0 1, 1 0 1) with a decimal value of 725. The interpretation from this outcome: Kerala obtain its with ‘Annual irrigation requirement of 1271.43 \(\hbox {Mm}^{\mathrm {3}}\) and Municipal and industrial requirement of 368.12 \(\hbox {Mm}^{\mathrm {3}}\)’. Tamil Nadu obtains its ‘Annual irrigation requirement of 12,601.0 \(\hbox {Mm}^{\mathrm {3}}\) with support from Prior Appropriation Doctrine (PAD)’. Karnataka obtains its Annual irrigation requirement of 8732.9 \(\hbox {Mm}^{\mathrm {3}}\) with support from Prior Appropriation Doctrine (PAD)’. This study shows that the outlined approach can indeed organize information and, in the process, facilitate a proper understanding of the conflict and also aid in deriving Fair and Equilibrium outcomes as possible candidate solutions to this conflict.
Graphic abstract

1 Introduction
Access to water is viewed as a fundamental right and societal necessity. The world is facing increasing demands for water to satisfy the divergent needs of the ever-increasing population. Environmental concerns and water scarcity in arid and semi-arid regions almost invariably lead to ‘water stress’ [1]. Social activism, political posturing, and the hardening of attitudes are some of the apparent consequences. Conflict arises when contenders seek a share of a shared resource and find themselves in a condition of competition and opposition. These conflicts, especially those that arise within the realm of water resources, often get exacerbated due to differences in the political ideology of the contending players. The issues related to sharing water resources of a river basin are indeed very complex and, in an equal measure, controversial. Conflict situation is inevitable as water resources become increasingly scarce and their use within a given region can no longer be insulated from impacting one’s neighbour. Naturally, when such conflicts are not resolved quickly and amicably, there is severe long-term damage to relationships at various levels.
Various mechanisms have been developed to address issues related to conflict analysis (see, for example, [2,3,4]). Classical game theory [5, 6] has provided a framework for methodologies known by their generic name of conflict analysis (CA) techniques. As part of CA-based approaches, metagame analysis (MA) has been shown to facilitate a mathematical analysis of beset conflicts with socio-political disagreements. For example, [7] have applied MA technique to the Garrison Diversion Unit project and demonstrated that the approach could be valuable for decision-makers involved in water resources management. Application of MA technique to various sectors are discussed in [8,9,10,11], amongst others.
Recently, [12] used the MA technique for the Krishna Waters dispute by considering the derived unbiased ‘Fair and Equitable allocations’ (F&E) options on each player’s side of the conflict. However, the author derived the F&E allocations for all the contenders, considering the average total water available in the basin in a year. In reality, there is always an inter-annual variation of rainfall observed when long-term time series of rainfall is considered. Considering only average rainfall for deriving allocations may not be a feasible solution to the river water disputes. This does not meet the reality of inter-annual variation of rainfall in any basin where dispute remains unresolved. Overcoming the limitation, the present study aims at (i) finding the F&E allocations based on inter-annual variation of the rainfall of five categories, i.e., Maximum flow (MAX), Upper Quartile flow or 25% dependability (UQ), Median flow or 50% dependability (MED), Lower Quartile flow or 75% dependability (LQ) and Minimum flow (MIN) and (ii) application of MA technique to the Cauvery River dispute considering the derived F&E allocations as one of the options from each player side.
2 Case study: Cauvery River Basin
Cauvery River Basin is one of the major river basins of South Peninsular India. Figure 1 depicts the study area of the Cauvery River Basin. The river drains a total area of 81,155 sq. km, and the catchment area up to Musiri, just before it enters the deltaic plains, is 66,243 sq. km. The co-basin states of Tamil Nadu (incl. Pondicherry), Karnataka and Kerala contribute 44,016 sq. km, 34,273 sq. km, and 2866 sq. km to the total basin area, respectively. Reference may be made to [13,14,15,16] for further details regarding climate, water resources development and other related aspects.
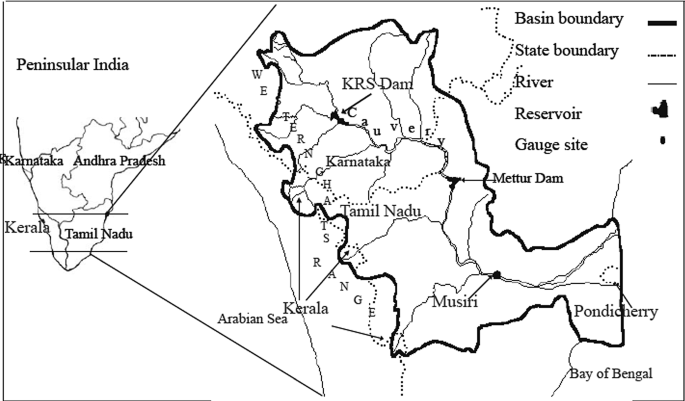
Cauvery River Basin (after [17]) in South Peninsular India
The river drains a total area of 81,155 sq. km, and the catchment area up to Musiri, just before it enters the deltaic plains, is 66,243 sq. km. The co-basin states of Tamil Nadu (incl. Pondicherry), Karnataka and Kerala contribute 44,016 sq. km, 34,273 sq. km, and 2,866 sq. km to the total basin area, respectively.
2.1 Cauvery waters dispute
Interstate differences over sharing of Cauvery waters arose in 1807 as a conflict of interest between the downstream British province of Madras (now Tamil Nadu) and the upstream headwater princely state of Mysore (present-day Karnataka). Madras was the first riparian to plan and develop extensive irrigation related infrastructure in the deltaic plains of Cauvery. On the other hand, the Mysore state, being the upper riparian, could exercise greater control over Cauvery flows. When the latter sought to develop infrastructure to promote irrigated agriculture within its jurisdiction, Madras viewed these developments with concern and sought protection from potential injury to its interests. Arbitration eventually culminated in the two pacts of 1892 and 1924, with the latter agreement being of a limited tenure of 50 years.
Further difficulties arose in 1956 when India embarked on the reorganization of state boundaries based on linguistic considerations. Kerala, a headwater state with relatively modest water resources developments and Pondicherry, the lowermost riparian, became the other two co-basin states of Cauvery. As newly carved co-basin states, Kerala and Pondicherry also laid claim to a ‘Fair and Equitable’ share of water resources of Cauvery. Kerala’s appeal for ’ equity in apportionment ’ is understandable with little or no claim arising out of any prior use or historical rights.
Following separate petitions from Tamil Nadu and Karnataka, Cauvery Waters Disputes Tribunal [18] was constituted by Govt. of India on June 2, 1990. On June 25, 1991, the Tribunal passed an interim award of 5805 million \(\hbox {m}^{\mathrm {3}}\) (\(\hbox {Mm}^{\mathrm {3}})\) of water annually to Tamil Nadu. In turn, Tamil Nadu was to release 169.9 \(\hbox {Mm}^{\mathrm {3}}\) of water to Pondicherry. [15, 19,20,21] discuss the salient features of the agreements of 1892, 1924 and the Tribunal award.
2.2 Flow availability and categories of flows
Sharing of water resources is a complex issue. Its availability contributes to inter-seasonal and inter-annual variability and shows a high spatial variability within a river basin. Additionally, climate change also resulting in dynamic uncertainty in rainfall distribution [22]. At the core of the problem is recognising that any prescribed sharing mechanism has to reflect the inherent variability in the availability of the resource in question and therefore has to be dynamic.
An associated concern is that the options available to any contending state, based on which an allocation may be sought, are likely to change or their relative levels of desirability. Hence, the relative ranking may also alter depending upon the availability of the resource. A family of solutions is likely to determine feasible solutions to water resources disputes, with each member of this family reflecting a given level of water availability. For a resolution of disputes of this nature, the solutions must be proposed based on realism.
It, therefore, becomes imperative that the selection of options for a given contender should be based on a broad spectrum of flow conditions and solutions derived corresponding to each. The paper considers a family of five flow conditions based on the magnitude of unimpaired derived flows and obtained from [14]. Metagame Analysis is performed individually for each such category of flows, and equilibrium outcomes are obtained.
The study, as reported, has been done for the following range of basin yield or uninterrupted flows: (i) Maximum Flow (MAX), (ii) Upper Quartile Flow or 25% dependability (UQ), (iii) Median Flow or 50% dependability (MED), (iv) Lower Quartile Flow or 75% dependability (LQ), and (v) Minimum Flow (MIN).
2.3 Virgin runoff potential estimation
The author [14] used a composite macro water balance as a modelling framework with distinct nested runoff models, each for irrigated and non-irrigated areas. An underlying assumption was that a heterogeneous basin comprised of two distinct but internally homogeneous parts, namely (i) a non-irrigated area receiving rainfall input; and (ii) irrigated areas receiving (rainfall + irrigation) applications as input. To avoid problems related to unknown return flow amounts, the water balance was written for the output end of the input–output hydrologic system and is given as in the below equation. For more details of estimation of virgin runoff potential, readers can refer to [14].
Total flow generated at the basin outfall, \(\hbox {F}=\sum \hbox {F}_{\mathrm {NON-IRRIGATED\, AREA}}+ \sum \hbox {F}_{\mathrm {IRRIGATED\, AREAS}}+\sum \) Waste flows from M&I uses \(\mp \quad \sum \) Impounding effect of reservoirs—\(\sum \) Evaporation from all reservoirs—\(\sum \) Diversions (including exports)
3 Fair and equitable allocations
Equity and fairness are essential issues in any water allocation problem [23, 24]. Equitable allocation does not mean equal allocation. Equity here describes deservedness based on contribution. Rasinski [25] has described two components of Fairness and Equity (F&E): Proportionality and Egalitarianism. The former talks about deservedness and the second talks about that equals should be treated equally, and unequal should be treated accordingly. This has also been highlighted at the UN Convention on Non-Navigational uses of International Watercourses [26]. More discussion of ‘Fairness and Equity’ can be found in [16, 17]. Ravikumar [17], in their attempt to address the issue of ‘equity and fairness’ in the apportionment of Cauvery waters, have derived quantified shares in respect of Kerala, Tamil Nadu and Karnataka, of the total available unimpaired yield of Cauvery basin up to Musiri (a gauging site just before Cauvery enters the deltaic plains) for the two planting seasons of Kharif and Rabi. Following the methodology, similarly, authors have quantified allocations for annual flows as discussed below.
3.1 Factors for apportionment
During negotiations, each state would, without any prejudice, propose their respective preferred factors as the basis for sequentially estimating entitlements in the order that maximizes water allocation to that state. Final entitlements will then be based on these factors taken individually or if the situation demands a compromise.
According to [26], allocating a shared resource amongst its competing users may be based on features that include geography, hydrology and climate. Additionally, the National Water Policy 2002 document prepared by the Ministry of Water Resources, Govt. of India [27], accords the highest water allocation priority to irrigation, second only to drinking water. Based on these guidelines, a selection of three factors has been used to compute proportional entitlements regarding each contending state in this study. These include the two static factors of (i) Drainage Area (DA) falling within the territory of each basin state (henceforth referred to as F1); and (ii) Cultivable Area (CA) of each state within the river basin (F2). The third is a dynamic factor and corresponds to unregulated runoff (F3) contribution from each state.
At first glance, such a choice of factors may seem arbitrary. However, there are more substantive reasons for such a selection, which becomes clear from the data presented in Tables 1 and 2. For example, Kerala contributes only 3.53% of the total geographic area of the Cauvery basin and 2.78% of its total cultivable area. On the other hand, this state contributes a substantial fraction of the total unregulated runoff of the Cauvery Basin. In any actual negotiation, it is reasonable to expect that the dynamic factor, F3, would logically be Kerala’s preferred choice on which to seek proportional entitlement. For similar reasons, static factor, F1, would be Tamil Nadu’s first choice factor and naturally would seek proportional entitlements based on this factor. The logic behind Karnataka’s choice follows a similar reasoning.
It may be seen from Table 2 that the dynamic factor, F3, would also, in general, be Karnataka’s preferred option. To that extent, Kerala’s choice also favors Karnataka. Also, in recognition of the priority that Govt. of India’s National Water Policy [26] accords to irrigation and because the genesis of the dispute over allocation and use of Cauvery waters is linked to irrigation use, it is logical to include the static factor, F2, in this selection. However, the ranking that each state accords to factor F2 depends solely on the size of the proportional entitlement that this factor allocates to that state. Hence, from Table 1, a compromise is required if static factor F2 would be Karnataka’s voluntary second choice. It needs to be emphasized that these proposed factors do not constitute an exhaustive set and are used only for illustrative purposes. Like many factors, or as few deemed relevant by the contending parties, can be incorporated into the approach.
To incorporate the effect of inter-annual variability in monsoon rainfall over the study basin and its impact on sustainable irrigation, virgin runoff potential of five levels of dependability was obtained from [14] (who reconstructed the historical, as well as unimpaired virgin, flows at sixteen (16) flow observation sites for the period of 1916–1917 to 1989–1990), to quantify the dynamic factor F3 in respect of each co-basin state. The flow categories considered are: (i) Maximum Flow (MAX), (ii) Upper Quartile Flow (UQ), (iii) Median Flow (MED), (iv) Lower Quartile Flow (LQ), and (v) Minimum Flow (MIN).
Negotiations were modelled separately for each such category of virgin runoff (factor F3). State-wise values for each of the two static factors, F1 & F2, and the dynamic factor, F3, are given in Tables 1 and 2, respectively.
3.2 Modeling of negotiations
Equity in apportionments has been sought via the principle of proportionality and the issue of fairness addressed by recognizing that all contending states have the right to seek preferential apportionment in proportion to their respective factors that are ranked based on implied, but state-specific, shares of total apportionments.
Based on each state’s preferred ranking of these factors, proportional allocations expressed as a percentage of total water available are sequentially derived for the three contending states of Karnataka, Tamil Nadu and Kerala. These are then put together to yield a preference table for each state. This is illustrated by the following example case scenario CS-MAX. Appropriation of Annual flows to Kerala, Karnataka and Tamil Nadu for the season when flows are expected to be in the maximum flows (MAX) category in all states.
3.3 Preference table for CS-MAX
Based on F1, F2, and F3 individual values in Tables 1 and 2, proportional entitlements were estimated for each state. These entitlements were ranked to yield a preference table (Table 3) regarding each state. Additionally, for these ranking factors, Table 3 also presents state-wise percentage apportionment of water. Based on an uncompromised stand, Tamil Nadu would prefer apportionment based on factor F1 for a share equal to 54.23% of total available water resources in that given season. On the other hand, Karnataka and Kerala would prefer apportionment to be fixed based on factor F3, resulting in equal allocations equal to 45.05% and 35.10%, respectively.
3.4 Procedure for negotiated (cooperative) solution
Perc [28, 29] have discussed the importance of cooperation in a social context and its great role to arrive at an equilibrium solution. [17] have quantified the fair and equitable allocations to the co-basin states of the Cauvery river while considering the cooperation and compromise among them. Following the procedure outlined in [17], if all the states insisted on allocations in proportion to the respective highest-ranked factor, a total water requirement equal to 134.38% (45.05 + 35.10 + 54.23) is implied. This, of course, is untenable, and the need for a compromise is recognized as such by each of the contending states.
As the first level of compromise, the contending states understand the need to agree to dilute their respective position and begin to seek apportionment based on their individual choice of two ‘best’ factors, namely factors having ranks one and two. Thus, Karnataka would seek apportionment based on F3 and F2, Tamil Nadu would opt for factors F1 and F2. At the same time, Kerala would dilute her stand to propose factors F3 and F1 as factors of choice (each factor, when taken in combination with other factors, would carry equal weights). With the first stage of compromise, Karnataka, Tamil Nadu, and Kerala would seek allocations that add up to 117.56% (44.47 + 53.775 + 19.315) of the total available water resources.
This solution is not feasible, and negotiations would naturally gravitate to the next stage of compromise where the states agree to include their respective third-ranked factors. With this next level of compromise, negotiations would now enter stage 3 of the process. Here the process seeking fair share allocation under scenario CS-MAX, in respect of Karnataka, Tamil Nadu and Kerala, converges to the point of agreement with allocations of 43.717%, 42.463%, and 13.82% of total seasonal availability, respectively. With the third stage of compromise, Karnataka, Tamil Nadu and Kerala would be seeking allocations that add up to 100% (43.717 + 42.463 + 13.82) of the total available water resources. Table 4 presents the results with allocations in \(\hbox {Mm}^{\mathrm {3}}\).
To summarize, and as outlined in the foregoing discussion, equity in apportionments has been sought via the principle of proportionality that underscores the value of ‘deservedness’. This deservedness is computed, as has been illustrated, based on factors related to water use potential, geography and hydrology of the study basin and is in line with the recommendations presented in [26].
Additionally, fairness is addressed by providing coercion free, equal opportunity platform to each contending state and recognizing each state’s right to propose its list of ranked, state-specific factors F1, F2 and F3 to compute respective proportional entitlements for a preferential apportionment.
4 Metagame analysis
Terminologies used in MA are as follows [30, 31]:
-
1.
Unilateral Improvement (UI): These are more preferred outcomes for a given player than the currently held position.
-
2.
Rational (R): The outcome is Rational when there are no UIs available to a player, implying that the current strategy is the best.
-
3.
Unstable (U): Player has at least one UI from which the other players can take no credible action, ultimately resulting in a less preferred outcome for the given player.
-
4.
Sequential Stability (S): The outcome has sequential stability (S) if credible UIs was taken by a player ultimately results in a less preferred outcome than the one from which the given player is seeking improvement.
Other important terms used in the analysis presented include:
-
1.
Players: These are participants in the game or conflict.
-
2.
Options: Are possible actions of a player.
-
3.
Strategy: Are a set of options for a player.
-
4.
Outcome: Is a situation where each player selects a strategy.
4.1 General algorithm
The general algorithm for analyzing conflicts comprises mainly of the following stages:
-
Stage 1
Develop a model of the conflict. In this stage, identifying the players and their respective options (actions) is accomplished.
-
Stage 2
Organize the conflict-related information by constructing a conflict tableau. In this stage, the conflict information is organized by ordering the outcomes according to ranked preferences of each player and listing Unilateral Improvements (UI) under each outcome.
-
Stage 3
Stability analysis where outcomes are evaluated as being any of (i) Rational (R), (ii) Unstable (U), (iii) Sequentially Stable (S).
-
Stage 4
Identification of one or more Equilibrium Outcomes.
These equilibrium outcomes represent game solutions that would be deemed as being acceptable to the contenders.
4.2 Metagame analysis of Cauvery River dispute
To develop a proper understanding of the Cauvery dispute, it becomes imperative to study the dispute concerning some identified benchmark periods in time. The consequence of ‘period’ specific study would contribute to how the conflict has revolved itself at these various stages in its development. The water resources of the Cauvery basin has triggered one of the most enduring and protracted disputes that India has witnessed. The dispute has gone through many critical stages of discussions, negotiations, arbitrations, and interim agreements. Some of the more profound and far-reaching developments were witnessed in the years 1924, 1974 and 1990. Accordingly, the paper presents a snapshot of the Metagame Analysis of the dispute corresponding to the benchmark year of 1990. It coincides with the Cauvery Waters Disputes Tribunal constitution by the Government of India and the subsequent announcement of the Interim Award by this Tribunal.
4.3 Framing of options for the contending states
Options for Kerala: Based on the above discussion, the following four options in respect of Kerala are developed:
-
1.
Allocation of 1271.32 \(\hbox {Mm}^{\mathrm {3}}\) of water annually to irrigate 77416 ha within the three sub-basins of Cauvery in Kerala.
-
2.
Right to an out of annual basin transfer of 991.2 \(\hbox {Mm}^{\mathrm {3}}\) from Kabini and Bhavani sub-basins to generate 465 MW of power. Further, with the use of tailrace water release, Kerala has proposed to irrigate 40,275 ha of arable land in the recipient sub-basin. Additionally, some portion of this transferred water can meet environmental flow requirements in the fragile and already stressed aquatic ecosystem in this part of Kerala.
-
3.
Allocation of 368.12 \(\hbox {Mm}^{\mathrm {3}}\) of water for domestic and industrial purposes within the three sub-basins. In addition to this, Kerala would also seek a right to develop a suitable site on River Pambar for hydropower generation. This purely regulatory facility is expected to need a non-consumptive annual turbine discharge of 161.4 \(\hbox {Mm}^{\mathrm {3}}\).
-
4.
The Fair & Equitable Allocations presented in Table 4 according to five flow categories.
Options for Karnataka: Based on the above discussion following options are developed in respect of Karnataka:
-
1.
Annual allocation of 8732.9 \(\hbox {Mm}^{\mathrm {3}}\) of water to provide irrigation for an area of 831,629 ha.
-
2.
As in the case of Kerala, ‘Fair and Equitable’ apportionment derived in five flow categories for Karnataka and as given in Table 4 is proposed as the second option for this state.
-
3.
Claim based on prior appropriations doctrine (PAD) to support utilizations submitted by Karnataka before the Cauvery Tribunal amounting to a maximum allocation of 5809.2 \(\hbox {Mm}^{\mathrm {3}}\) of water [32].
The doctrine of prior appropriation possesses conceptual origins extending to much earlier periods of history but has undergone its primary evolution in the American West. Originally applied to the water-use practices of early miners, this doctrine has been a central factor in the development of irrigated agriculture. It continues to serve as a predominant form of water law in the western states. It is also known as the “Colorado Doctrine” of water law. Though this doctrine is neutral between upper and lower riparians, it seeks to protect existing uses according to the ‘first in time— first in the right’ principle. Hence, each state along a watercourse may establish prior rights to use a certain amount of water depending on the date on which that water use began. The first person to use water (called a “senior appropriator”) acquires the right (called a “priority”) to its future use as against later users (called “junior appropriators”) [16].
Virgin runoff in the actual runoff available (without any human use) with inter-annual variability in all co-riparian states for allocation. In contrast, Priority Appropriation Doctrine (PAD) support the user putting the water in use for more than 20 years in various activities. Allocation of river water considering virgin runoff of the river and support from PAD makes the allocation process transparent. It gives importance to the long-term user to get a fair share from the virgin runoff. Virgin runoff provides the actual quantity of water available to begin the allocation process. PAD supports the long-term user to get the appropriate share during the allocation process.
Options for Tamil Nadu: Based on the preceding discussion, the following options are developed in respect of Tamil Nadu:
-
1.
Claim based on an annual crop water requirement of 12,601.0 \(\hbox {Mm}^{\mathrm {3}}\) and estimated for a gross area of 1.051 Mha including the area under Pullambadi and New Kattalai schemes.
-
2.
As in the case for Kerala and Karnataka, ‘Fair and Equitable’ apportionment in five flow categories for Tamil Nadu also presented here in Table 4 is being proposed as a reasonable option for the state.
-
3.
Support of usage based on prior appropriation doctrine gives the state a maximum allocation of 11,344.58 Mm 3 of water in years when this usage level can be supported [33].
The options that any given player adopts must reflect the hydrologic reality of flow availability. The study, as reported, has been done for categories of unimpaired flows given as (1) MAX; (2) [UQ, MED, and LQ]; and (3) MIN. These categories are represented in the paper as case examples (1), (2), and (3). Accordingly, separate sets of options have been proposed for each player corresponding to each of the above-mentioned three flow categories of MAX, [UQ, MED, LQ] and MIN. The sets of options regarding the three states are given separately for these flow categories in Table 5.
4.4 Outcomes and Outcome Removal
From Table 5, it is clear that for case example (2), a total of 10 options are proposed for the three states. These include (i) four options for Kerala, (ii) three options for Tamil Nadu, and (iii) three options for Karnataka. Following [7, 8]; and others, an outcome—selected strategies of all players considered together—may be expressed in terms of binary codes wherein a ‘1’ denotes an option taken as against a ‘0’ for an option not taken. For example, in the outcome written as {1 0 0 0, 1 0 0, 0 0 1} , the first four positions may be assigned to represent the strategy adopted by Kerala in terms of binary values for her options in the order as given in foregoing discussion, followed by the string of binary numbers {1,0,0}corresponding to the three ordered options in respect of Tamil Nadu and constituting her adopted strategy. Finally, the third-string {0,0,1}represents the position taken by Karnataka concerning her three stated options. Further, for Tamil Nadu, the string {1,0,0}indicates that the latter chooses the strategy that seeks an award of 12,601 \(\hbox {Mm}^{\mathrm {3}}\) while at the same time rejecting the options of award deriving from ‘Fair and Equitable’ allocations as well as taking support of ‘Prior Appropriation Doctrine’.
It may be noted that with ‘n’ options, the game represents a total of \(2^{\mathrm {n}}\) distinct outcomes. Therefore, in the context of the present study, the given options imply a total of \(2^{\mathrm {10}}\) or 1024 possible outcomes for years when the flow is expected to be in any of the three flow categories denoted as UQ, MED, and LQ. For the flow category denoted as MAX, the game has to deal with only 6 options and, therefore, result in \(2^{\mathrm {6}}\) or 64 possible outcomes. For the years when the flow is in category MIN, there are again a total of 6 options yielding 64 possible outcomes again. The task of evaluating all the outcomes for merit is indeed quite onerous. However, there may not be such a need as some of these outcomes are infeasible and can be identified and removed following standard procedures developed by [30]. These methods follow the following reasoning for outcome removal:
-
1.
Method 1 removes outcomes having mutually exclusive options for a player.
-
2.
Method 2 removes the outcomes that are preferentially infeasible for a player.
-
3.
Method 3 removes the outcomes that are logically infeasible between players.
4.5 Context-specific outcome removal
There is also a need for context-specific outcome removal. In the context of the present study, there may be some outcomes that are feasible in a given game case scenario—as in case examples (1) or (2) or (3)—but are rendered technically infeasible based on solution outcomes that are taken up when the analysis is performed for other case scenarios.
For example, the solution outcomes when the game is analyzed for flow category MAX—case example (1). It is possible to have a situation where Kerala is allowed 2630.64 \(\hbox {Mm}^{\mathrm {3}}\) of water as represented by option (1) of Table 5. It may be recalled that this allocation also includes an annual allocation of 991.2 \(\hbox {Mm}^{\mathrm {3}}\) as an out of basin transfer across the hill range of the Western Ghats for hydropower generation. Beneficial use of this transfer requires extensive infrastructural development both on the windward as well as a leeward side of Western Ghats. Routinely, these may include (i) a tunnel bored through the hill range to transport water; (ii) support infrastructure for the generating facility; and (iii) the generating facility itself.
Further, consider the Metagame for flow category MIN—case example (3), and category UQ, MED, and LQ—case example (2). It is reasonable to expect that, for these two case scenarios, the game would identify some feasible outcomes for Kerala that exclude inter-basin transfer for hydropower generation to make it compatible between allocations to contenders and flow availability in given flow category. Therefore, if Kerala were to accept option (1)—as framed for category MAX—for years when flow condition is expected to be in category MAX and not be allowed this transfer—option (2) of Table 6—in other years, the disconcerting implication for Kerala would be that a facility is being proposed that is expected to remain idle for most of the time! This combination of individually feasible outcomes, therefore, does not represent a feasible choice for Kerala.
For example, Table 6 presents the list of 21 feasible outcomes obtained for case example (2)—flow category [UQ, MED and LQ]. However, out of these 21 feasible outcomes, there are 4 outcomes, as indicated in Table 6, which is not feasible for the years when the flow is in the range defined as LQ.
4.6 Preference ordering of outcomes
The feasible outcomes that remain after removing infeasible outcomes must now be evaluated for stability for all players. By definition, an outcome is deemed stable for a given play if it does not benefit the player to move unilaterally to any other outcome by adopting a different strategy. An outcome that is stable for all players will be an equilibrium position and constitutes a possible basis for resolving the conflict.
As a first step, the feasible outcomes need to be expressed in a more straightforward and unique address system for identification. This is done conveniently using the decimal equivalent of the binary string representing the outcome [8]. Table 6 also gives the computed decimal equivalents corresponding to each retained outcome.
In addition to the decimal representation of outcomes, Stability Analysis of identified feasible outcomes requires knowledge of how each player ranks these outcomes from the most desirable to least desirable. To accomplish this task, the concerned player would have to compare these outcomes based on what these outcomes entail regarding the options allowed by that outcome. This, therefore, requires knowledge of each player’s unambiguous ranking of its options in order of preference. Appropriately, therefore, these preferences were derived for each contending state and the three flow categories MAX, [UQ, MED, LQ], and MIN—case examples (1), (2), and (3), respectively—as explained in the supplementary section of this article.
5 Results and discussion
Feasible outcomes derived in respect of each player are converted into their equivalent decimal form and arranged in Table 7 as a preference vector, from most preferred to least preferred. Next, each of these ordered feasible outcomes must be evaluated regarding their stability for each of the three players. An outcome stable for all players in the constructed game model will be an equilibrium outcome and represents a possible resolution to the modelled conflict.
Table 7 presents the stability analysis of each outcome for flow category UQ regarding the three states of Kerala, Tamil Nadu and Karnataka. From the table, it is seen that some of these outcomes, expressed in terms of their decimal equivalents in the preference vector, have an accompanying Unilateral Improvement (UI). As the label suggests, a UI is a more preferred outcome to which a particular player can move by a unilateral change of strategy. In contrast, other players’ strategies remain the same. Such a unilateral movement can occur at each stage of the game for a given player if that improvement is possible.
For example, consider the stability of the particular outcome (0 1 1 0, 0 1 0, 0 1 0)—decimal tag value of 294—and listed in column 6 along the row of preference vectors Kerala’s point of view. The outcome indicates that Kerala will take the options of (i) an out of basin transfer of 991.2 \(\hbox {Mm}^{\mathrm {3}}\); (ii) an additional utilization of 368.12 \(\hbox {Mm}^{\mathrm {3}}\) to meet domestic and industrial supplies; and (iii) approval to develop a hydropower facility on River Pambar that will have a non-consumptive water requirement of 161.4 \(\hbox {Mm}^{\mathrm {3}}\) of water annually. The outcome also indicates that both Tamil Nadu and Karnataka will choose ‘Fair and Equitable’ allocations.
Examining the list of feasible outcomes for this category of UQ flows reveals that Kerala can improve its position by unilaterally shifting to 293 or 296 without provoking a corresponding change of strategy from Tamil Nadu and Karnataka. As indicated in column 4 of Table 7, Kerala has a Unilateral Improvement on outcome 294. The situation that develops, as a consequence of Kerala’s unilateral shift, may be analyzed in terms of the following two scenarios that may develop:
-
1.
Kerala takes UI from 294 and moves to outcome 293 In response to the unilateral improvement taken by Kerala, both Tamil Nadu and Karnataka can seek improvement from 293 to their respective UIs if they indeed have one. From Table 7, it can be seen that Tamil Nadu has UI from 293 to 341 (as given in column 15 of Table 7), while Karnataka too has a UI from 293 to 677 (also indicated in column 15 of Table 7). If Tamil Nadu seeks improvement and moves to 341, Karnataka will opt for its UI from 341 to 725 (column 21 of Table 7). As a first step in the next cycle of the cascading game, Kerala notes that the outcome 725 in its preference vector is less preferred than the starting outcome of 294 and will naturally seek a new UI from outcome 725. However, as seen from column 10 of Table 7, Kerala does not have a UI from this outcome. It naturally follows that the assumed initial move from 294 to 293 is disadvantageous to Kerala. Kerala will be deterred from seeking the first UI. It may be seen that the same results are obtained if Karnataka, instead of Tamil Nadu, responds to Kerala’s initial shift in strategy from 294 to 293.
-
2.
Kerala takes UI from 294 and moves to outcome 296 The move to outcome 296 is the other UI available to Kerala (column 4 of Table 7). Following this shift in strategy, Tamil Nadu will look for its improvements from outcome 296. From column 17 of Table 7, there is no UI available for Tamil Nadu, and, therefore, this outcome has rational stability for the state. To complete the first cycle, it is now Karnataka’s turn to seek a possible UI from outcome 296. Again, from Table 7 (column 17), it is observed that Karnataka has no UI available from outcome 296 and is, therefore a rationally stable outcome for the latter state.
From the preceding discussion, Kerala is not expected to stay with outcome 294 because a more promising strategy, represented by outcome 296, is available and would indeed be adopted. Outcome 294 is unstable for Kerala. This is appropriately indicated as ‘U’ in column 4 of Table 7 in the stability row for this state.
Following similar reasoning, all preferentially ordered possible outcomes are examined for stability for each player and all outcomes having stability concerning all players are identified as ‘Equilibrium Outcomes’. For category UQ—as in case example (2)—the analysis identified 296 and 725 as Equilibrium Outcomes and are denoted as ‘E’ and all the remaining outcomes as ‘X’ in the ‘overall stability’ row of Table 7. These outcomes represent possible solutions to the metagame and hence a possible basis for resolving the modelled conflict. A similar procedure was repeated for other flow categories—MAX, MED, LQ, and MIN—to identify respective Equilibrium Outcomes, and the results are presented in Table 8.
6 Conclusions
Fair and Equitable allocations were derived based on three factors: Drainage area (F1), Cultivable area (F2), and annual virgin runoff (F3) from each co-basin state. Virgin runoff potential is divided into five categories of flows: MAX, UQ, MED, LQ and MIN, to meet the reality of water available according to inter-annual variability of runoff in the basin for sharing co-basin states. The considered factors are the most prominent factors according to the history of the Cauvery dispute is concerned, and they are considered according to UNCIW (1997). Further, derived F&E allocations were taken up on behalf of players in the Metagame Analysis of the Cauvery River Dispute. The procedure of the Metagame Analysis provided valuable insights into complex political disputes related to sharing water resources of a river basin amongst its politically autonomous co-basin states. The results showed that the outlined approach could organize information and facilitate a proper understanding of the conflict in deriving Fair and Equilibrium outcomes as possible candidate solutions to water conflicts. The MA technique has been successfully employed to seek possible bases that could provide a credible framework for resolving Cauvery Waters Disputes between the Indian states of Kerala, Tamil Nadu and Karnataka.
Data Availability Statement
This manuscript has no associated data or the data will not be deposited. [Author’s comment: No separate data is required. All the required data is available in Table 1 to Table 4 in the paper itself.]
References
M. Falkenmark, The massive water scarcity now threatening Africa: why isn’t it being addressed? Ambio 18, 112–118 (1989)
D. J. Priscoli, From hot tub to war: alternative dispute resolution (ADR) in the US corps of engineers, managing water related conflicts: the engineers’s role. Proc of the Engineering Foundation conf. ed. by W. Viessman, Jr., E.T. (ASCE, Smerdon Santa Barbara, 1989)
E. Mostert, A frame work for conflict resolution. Water Int. 23(4), 206–215 (1998)
Jorge Nuno Silva, On mathematical games. J. Br. Soc. His. Math. 26(3), 80–104 (2011)
J. von Neumann, O. Morgenstern, Theory of Games and Economic Behavior, vol. 641, 3rd edn. (Princeton University Press, Wiley, New York, 1953)
R.D. Luce, H. Raiffa, Games and Decisions (Wiley, New York, 1957)
K.W. Hipel, N.M. Fraser, Metagame analysis of the garrison conflict. Water Resour. Res. 16(4), 629–637 (1980)
N.M. Fraser, K.W. Hipel, Solving complex conflicts. IEEE Trans. Syst. Man. Cybern. 9(12), 805–816 (1979)
M.F. Meleskie, K.W. Hipel, N.M. Fraser, The watergate tapes conflict: a metagame analysis. Polit. Methodol. 8(4), 1–23 (1982)
B. Lussier, G.E. Mohr, I.C. Goulter, Conflict analysis of the shoal lake subdivision. Water Resour. Bull. 25(1), 111–116 (1989)
T. Kaneta, S Furusaka, Metagame analysis for determining construction methods in durability of building materials and components, vol 8, ed. by M.A. Lacasse, D.J. Vanier (Institute for Research in Construction, National Research Council, Ottawa, 1999) p. 2487–2497
D.P. Panday, R. Khosa, R. Maheswaran, K. Ravikumar, A. Agarwal, Game theoretic based modelling of krishna waters dispute-equilibrium solutions by metagame analysis. Eur. Phys. J. B 94(101), 1–12 (2021)
CFFC, Report of The Cauvery Fact Finding Committee. Ministry of Irrigation and Power (Government of India, 1972)
Khosa R, Long, Term Spatial Analysis, of Hydrology of a River Basin, Thesis (Ph.D) (IIT Delhi, New Delhi, 1997)
CWDT, Assessor’s Report, Before The Cauvery Water Disputes Tribunal. Ministry of Water Resources (Government of India, New Delhi, 2006)
Ravikumar K, Towards a Fair and Feasible allocation of Cauvery Waters, Thesis (Ph.D), IIT Delhi, India (2008) http://eprint.iitd.ac.in/bitstream/handle/2074/6206/TH-3526.pdf?sequence=2&isAllowed=y
K. Ravikumar, R. Khosa, Fair and equitable allocations of Cauvery river waters. Water Int. 32(4), 571–588 (2007)
CWDT, 1991. Order in Civil Miscellaneous Petition Nos. 4, 5, & 9 of, Dated 25-6-1991 (Before The Cauvery Water Disputes Tribunal, Ministry of Water Resources, Government of India, New Delhi, 1990)
N.D. Gulhati, Development of Interstate Rivers (Allied Publishers, New Delhi, 1972)
S. Guhan, The Cauvery River Dispute: Towards Conciliation (Kasturi and Sons publications, Madras, 1993). (Frontline)
P. B. Anand, Water identity: an analysis of the cauvery river water dispute. BCID Res. Paper 3, Univ. of Bradford, 2004, England. Available at http://www.Bradford.ac.uk/acad/bcid/research/papers (Accessed September 15, 2004)
M.A. Gadhawe, R.K. Guntu, A. Agarwal, Network-based exploration of basin precipitation based on satellite and observed data. Eur. Phys. J. Spec. Top (2021). https://doi.org/10.1140/epjs/s11734-021-00017-z
International Law Association (ILA), The Helsinki Rules, Committee on the uses of the waters of International Rivers, 52nd ed (Helsinki Conference, Helsinki, 1967)
N.M. Tripathi, Inter-State Water Disputes in India (The Indian Law Institute, New Delhi, 1971)
K.A. Rasinski, What is fair or is it? Values differences underlying public views about social justice. J. Person. Soc. Psychol. 53, 201–211 (1987)
UNCIW, United Nations Convention on Non-navigational Uses of International Watercourses. Adopted by the UN General Assembly in resolution 51/229 of May 21, 1997. Available at www.internationalwaterlaw.org (Accessed on January 17 2004)
MOWR, National Water Policy 2002, Ministry of Water Resources (Govt. of India, New Delhi, 2002)
M. Perc, Phase transitions in models of human cooperation. Phys. Lett. A 380(36), 2803–2808 (2016)
M. Perc, The social physics collective. Sci Rep 9, 16549 (2019). https://doi.org/10.1038/s41598-019-53300-4
N.M. Fraser, K.W. Hipel, Dynamic modeling of the Cuban missile crisis. J. Conflict Manag. Peace Sci. 6(2), 1–18 (1983)
D.P. Panday, R. Khosa, R. Maheswaran, R. Ravikumar, A. Agarwal, Game theoretic-based modelling of Krishna waters dispute: equilibrium solutions by hypergame analysis. Eur. Phys. J. B 94, 131 (2021). https://doi.org/10.1140/epjb/s10051-021-00135-6
Government of Karnataka. Exhibit No. 518, page 65, Before the Cauvery Water Disputes Tribunal. Ministry of Water Resources (Government of India, New Delhi, 2004)
Government of Tamil Nadu. Exhibit No. 1665, page 47, para 16.3, Before the Cauvery water Disputes Tribunal. Ministry of Water Resources (Government of India, New Delhi, 2004)
Acknowledgements
AA acknowledges the funding support provided by the Indian Institute of Technology Roorkee through Faculty Initiation Grant number IITR/SRIC/1808/F.I.G and COPREPARE Project funded by UGC and DAAD under the IGP 2020-2024.
Author information
Authors and Affiliations
Contributions
All authors contributed equally to the manuscript.
Corresponding author
Ethics declarations
Conflict of interest
The authors declare that they have no conflict of interest.
Supplementary Information
Below is the link to the electronic supplementary material.
Rights and permissions
About this article

Cite this article
Ravikumar, K., Khosa, R. & Agarwal, A. Metagame analysis of Cauvery River dispute incorporating interannual variability in virgin runoff potential of the basin. Eur. Phys. J. B 94, 172 (2021). https://doi.org/10.1140/epjb/s10051-021-00174-z
Received:
Accepted:
Published:
DOI: https://doi.org/10.1140/epjb/s10051-021-00174-z