
Abstract
Mumbai is on a narrow peninsula, which lies between the Arabian Sea on the west, Thane Creek on the east and Vasai Creek on the north; consisting of two distinct regions, Mumbai City and Mumbai Suburban. The city district region or South Mumbai is also commonly referred to as the Island City, as historically this area consisted of islands separated by the sea. There were several historical fortifications dotted on these islands, such as Worli, Mahim, Sion, Sewri, Bandra and the largest of these was the Bombay Fort. The islands were combined into one landmass by man-made changes spread over a century and the ensuing land-use changes and urbanisation erased the contours of the extents of forts as well as islands. The history of the city has been a subject of interest to researchers; it is widely believed that prior to the first phase of reclamation (1711–1728 CE) there were seven islands. However, past scholarship has pointed out that the model of seven distinct islands was first introduced in a map published in 1843 CE, which retrospectively speculated the original landscape and this model has not been subjected to a scientific analysis so far (Ridings in J. Historic Geograp 59:27–39, 2018). The present study: firstly uses historical maritime cartographic records (such as sea charts, maps, birds-eye views, admiralty charts, portolan charts and pilots, made by Portuguese, French, Dutch and British) to geospatially identify and map the spatial evolution of the islands that formed the present South Bombay; secondly, traces the layout and evolution of the Bombay Fort which was the hub of power and economy of Bombay Presidency during seventeenth and eighteenth centuries and which also houses remnants of few buildings including the castle built by Portuguese.
Introduction
The last few decades have successfully demonstrated the application of geospatial analysis in understanding the geomorphology of landscapes consisting of cultural heritage sites (Rajani 2021, Navalgund and Korisettar 2017). Tools provided by geographic information systems (GIS), and the availability of high-resolution images have allowed researchers to document and analyse cultural heritage sites as well as their surrounding landscape.
The expanding urbanisation and need for land to support the present population is often in conflict with the intentions to protect heritage. In this process a large number of heritage sites become victims of urbanisation and the landscape in its immediate vicinity is lost without being recorded. To some extent, the present landscape holds the memory of the past and these memories remain as impressions on the surface which presents itself as patterns that can be observed using satellite images and Digital Elevation Model (DEM). Besides, old cartographic records have also proved to be very valuable when used along with modern techniques available under the large umbrella of geospatial analysis. These maps have the potential to enhance our understanding of the archaeology of the area. The plans of forts, various maps of landscapes, drawings, and paintings have also proved to be of value to gain insight into the history and archaeology of a landscape (Gupta and Rajani 2020a).
Context
This paper deals with one of the largest metropolitan cities of India, Mumbai which was created by reclaiming land by connecting islands separated by the sea. The city of Mumbai was initially known as Bombay, later in 1995 Government of India changed its name to Mumbai. In this paper “Mumbai city” will be used to refer to the present Mumbai city district, which covers the geographical area focused in the present study. The word Bombay is used in different contexts, hence it is important to provide distinction: (1) Bombay Fort: is the British Fort; (2) Bombay island: is the erstwhile island on which the Bombay Fort was located; (3) “Bombay” (within inverted comma): while referring to perceptions of various people about what this toponym constituted. The port and the surrounding coastal stretch have been mapped between the 17th to 19th centuries by the Portuguese, Dutch, French and British at different scales and for various purposes. There are inconsistencies among various records about how many islands constituted the present Mumbai city and which of those islands were called “Bombay”. It is popularly believed that the area covered by the present Mumbai city was seven separate islands as depicted in this map titled “Islands of Bombay and Colaba” (https://bombaywiki.with.camp/w/images/0/07/1843_Murphy_Map_of_Island_of_Bombay_and_Colaba.pdf accessed on 31st May 2022) which was made retrospectively and published in 1843 CE (depicting the landscape of the time when it changed hands from Portuguese to English in 1660 s) whereas there are several earlier maps that depict fewer islands. Riding (2018) has stated that the number and shapes of the seven islands illustrated in the 1843 map are speculative, and that “At no point was the seven islands model suggested with confidence, or assigned a specific period”.
The present study firstly explores the region of present Mumbai city to understand how different colonial powers viewed the landscape from the 17th to 19th centuries and analyse the inconsistencies in the way the landscape is recorded in various historical maps. Using geospatial analysis the study visualises and compares old maps to comprehend the location, extent and boundaries of the islands depicted in those maps and also elucidate the basis on which the 1843 map came up with a model of seven distinct islands.
Secondly, the study has conducted a detailed geospatial analysis of the erstwhile layout of Bombay Fort to identify the traces and extent using a map of 1840 CE when the fort was at its peak of existence. The evolution of the landscape will be investigated by comparing current satellite images with historical cartographic records. The precise locations of buildings and revenue plots are compared and analysed to gain insight into how the landscape holds memories of the past, how humans exploited their landscape, and how the morphology of the Fort area evolved.
The findings of the present paper is organised into two main parts, firstly the history and morphology of seven islands and secondly landscape morphology of the Bombay Fort.
Islands of Bombay
The history of human settlement in the Mumbai region (from Vasai in the north to Colaba in the south) can be dated to middle palaeolithic times based on the archaeological evidence collected from the Kandivali exploration (Sankalia 1962). The Sopara Asokan edict suggests that the region was under the rule of Emperor Ashoka (Poncha 2016) in 2nd BCE. This region was ruled by various dynasties during the historic period, to name a few the Abhiras of Western Maharashtra, the Vakataka, the Kalachuri, the Maurya of North Konkan, the Chalukya of Badami and the Rashtrakuta (Poncha 2016). The Shilahara are considered to be the first to introduce the political and commercial activities in the region and made Thane and Puri their capital (Poncha 2016). The poem “Bimbakhayan” suggests the King named Bimb or Bhimdev made Mahim island as his capital (Poncha 2016).
Around 1348 CE the islands were brought under the Gujarat sultanate. Post 1500 CE, intimidated by the unceasing conquest of Gujarat by emperor Humayun and the growing influence of the Portuguese in the region, the Gujarat sultanate decided to seek help from the latter. In 1528 CE the Portuguese sought after Vasai and the Bassein (Portuguese rendition of Vasai) Treaty was signed between the Gujarat sultanate and the Portuguese in December 1534. Subsequently the Portuguese seized, along with Vasai, all the dependencies including the islands.
For the following 127 years, the Portuguese had control over the islands, although they were not interested in them as they were fragmented pieces of land with the space between them being under water during high tides and monsoon, whereas they could be walked across during low tides (Riding 2018). The Portuguese also named the islands as “Entrance to Barrade Bombaim” (inlet of Bombay) (Riding 2018). These isolated islands had diverse ecosystems, to put these to use the Portuguese started to rent out the islands. The seasonally inundated peripheral land was used for salt farming, coconut and palm plantation (Ridings 2018). The majority of the food for this region came from Salsette island (Riding 2018) which is to the immediate north. Although the Bombay islands were under executive and judicial control of the Bassein administration, minimal defence structures were erected around the houses of masters of the islands.
“Bombay” from the lens of Portuguese
A surviving Portuguese map (Fig. 1) titled “Detail of Ilha de Bombaim e zonas limítrofes” shows four islands (Mahim, Worli, Bombay and Colaba), and two causeways between Mahim and Parel, beside which neither reclamation nor any major changes were considered during Portuguese rule. The map marks many buildings—like Saint Andrew’s Church (Bandra); Castella de Aguada (Bandra fort); Our Lady of Salvation (popularly known as Portuguese church located in Dadar); Portuguese custom house (Walkeshwar); Manor House (later known as Bombay castle); Michael church (Sion). Beside these, the settlements in Mazgaon, Parel and Wadala are depicted as well. The locations of all these buildings and settlements have been identified and marked in Fig. 1. The date for this map is given as 1600 to 1700 AD (https://digitarq-ahu-arquivos-pt.translate.goog/details?id=1158086&_x_tr_sl=pt&_x_tr_tl=en&_x_tr_hl=en&_x_tr_pto=sc). However authors are able to further narrow this date range. The map marks Castella de Aguada (also known as Bandra fort) which was built in 1640 (Cunha 1901), hence the map couldn't have been made before that and it probably was made before 1678 when the English map by Willam Blathwayt was made, as the features (shape of islands and a few buildings) in the latter suggests that the former was used as a source. Therefore the Portuguese map must have been made between 1640 and 1678 (Fig. 2).

Source: used with permission from the Arquivo Historico Ultramarino, Lisbon, CARTm 058 D.694
The oldest surviving map and the only Portuguese map of Bombay Ilha de Bombaim e zonas limítrofes, with annotations made authors of the present paper.

Digital Elevation Model (SRTM 1 Arc Sec; 30 m) overlaid with: a boundaries of seven islands marked in 1843 map; b, c and d are 7, 10 and 13 m (respectively) height-contours generated from the SRTM DEM
Interest in Bombay of the East India company and the English
The East India Company (EIC) established a factory in Surat in 1612 after negotiations with the Mughals. In the subsequent decades, because of the growing power of Dutch and increasing threat from the Mughals led by Aurangzeb, EIC was compelled to shift from Surat to a safer location. EIC had been interested in the Bombay islands since 1652, and the council at Surat constantly requested the government in London to purchase the islands from the Portuguese. However, the English got the islands as dowry in the marriage of King Charles II of England and Catherine of Braganza of Portugal. The nuptial treaty between English and Portuguese, drafted by Lord Clarendon, was signed on 23rd June 1661 (Poncha 2016). Since the treaty was very vague and did not contain descriptions of landforms/areas let alone a map, it created teritorial confusion when Sir Abraham Shipman with his 500 men came to Bombay in 1662 as representatives of the English Crown to take possession of the islands. The English fleet believed that the entire area south of Vasai (which included Salsette and islands to its south) was considered “Bombay” and therefore thought that the whole region was under English sovereignty after the treaty. But according to the Portuguese “Bombay” island was only the ‘h’ shaped island (see Fig. 1). The English fleet were not allowed to land on the islands due to this confusion and they had to take refuge further south on the island of Anjadev.
The confusion was majorly due to the lack of understanding of the islands’ geography. For example, Portuguese and Maratha considered Bombay and Mahim as two different islands, and the Mughals considered Mazagaon as one distinct island (Ridings 2018). The British in the initial days considered all islands as one entity, as they considered the central part of the islands as land not sea and called inlets between islands as breaches (Ridings 2018). The Portuguese were not ready to surrender all the islands and the English stood by their demand.
Shipman and his fleet encouraged the assumption that “Bombay” encompassed the region from the bay in the south to as far as the entrance of Bassein on the north, and Trombay to the east (Riding 2018). Such inconsistencies and confusion about what “Bombay” islands consisted of was probably due to Portuguese not having submitted any cartographic representation or even topographic description when the 1662 treaty was signed. One of the main reasons for Portuguese to want to retain control was, the islands were connected in every possible way with the rest of the province to the north (in terms of politics, land ownership, religion, ethnicity, trade and agriculture) and could not be separated without major consequences (Riding 2018). The Portuguese viceroy Antonio de Mello de Castro, mentioned to his King in Portugal, “India will be lost the same day in which the English nation is settled in Bombay” (Riding 2018).
The dispute over islands began in 1662 when the fleet arrived and continued till 1665; for three years Shipman and his men lived in a hostile environment on Anjadev islands with scarcity of food resulting in the death of Shipman and his many men. In 1665 Humphrey Cooke (Shipman’s secretary) signed an agreement accepting to take charge of only the ‘h’ shaped Bombay island and agreeing for the rest to remain as Portuguese colonies. Cooke had no intention to honour this agreement and wrote that “now [that] I have the possession [I] shall observe no more [of the Portuguese viceroy's] articles than what is convenient”'. Subsequently Cooke took possession of all the islands including Mahim, although Mahim had a Portuguese custom house and therefore they felt more possessive about this island (Riding 2018).
In 1668 CE the crown transferred the Islands to the EIC, which maintained the view of Cooke on Mahim and considered it as part of “Bombay”. Gerald Aungier governor of Bombay (1669) strongly advocated the idea of land reclamation to change the environmental vulnerability of the region in order to make it secure for shifting headquarters of EIC from Surat to Bombay (Ridings 2018). Another reason for reclamation was to make islands self-sufficient in the matter of food and growing power of Marathas in the immediate hinterland and constant wars between Marathas and Mughals. On the other hand, there was a constant threat from the Portuguese viceroy over Mahim. This issue was then taken up to the Committee for Trade and Plantation in Europe and the committee declared the whole and sole authority of the English crown on “Bombay” islands (consisting of all the islands that form the present south Bombay) and finally in the 1670 s EIC and British crown emerged from this dispute.
“Bombay” from the lens of the English
The 1678 map records the landscape of Mumbai, as well as the plan for enclosing the lagoon to show the area as one unified land (Fig. 3). It shows four islands (Mahim, Worli, Bombay, Colaba) with shapes similar to the ones depicted in the Portuguese map (Ridings 2018), however, the most important difference is the Portuguese map marks the space in between as sea (and two causeways connecting Parel and Mahim) and the English (1678) map marks it not as the sea but as a lake. It shows four islands (Mahim, Worli, Bombay, Colaba) with the proportion of the size of islands and relative distances similar to the ones depicted in the Portuguese map. However, the most important difference is the Portuguese map marks the lagoon navigable with broader inlets and does not differentiate it from the surrounding seawater. On the other hand, the English (1678) map represents the lagoon area as a separate feature with dotted enclosures probably with a political intent to present a picture of these as a unified islands. Further two causeways connecting the islands of Parel and Mahim depicted on the Portuguese map are not marked on the British map. The map canvas covers a larger area including Salsette, Bandra and Trombay. The settlements at few places like Mazgaon, Wadala, Bombay and Mahim are marked in the map. The Bombay castle building and Bandra Fort are marked as well.

Source: used with permission from the John Carter Brown Library at Brown University, Providence, Blathwayt Atlas, 43
Bombay Harbor, 1678.
The first detailed printed map of Mumbai, was created by John Thornton, the English East India Company’s principal hydrographer in 1685. This intriguing sea chart depicts an English perception replacing the pre-existing interpretations of multiple islands by a vision of one united Bombay island. The map has very few details of the island's interiors, the only indication of the inundated area is inclusion of ‘salt ponds’ depicted as orderly rectangles, giving the impression that they were entirely artificial and were not dependent on the natural topography. It marks the ‘Bombay Towne & Castle,’ at the city’s centre and ‘Mazagoem’ Mazagaon Fort, a fortification built between 1680 and 1690 to protect the city's landward entrances. Designed to be a functional sea map, it includes nautical information such as bathymetric soundings, hazard areas, and fishing stakes. (https://artsandculture.google.com/asset/mumbai-maharashtra-john-thornton/LQFbROSHoWMW7g Accessed on 31st May 2022) There were several copies and variations of this map, published as reprints upto 1750s. However important this map was at the time, it gives almost no information on understanding the geomorphology of the landscape, in fact this map is a good example of how maps are (like texts) also a product of its time and can contain biases of the map maker.
In 1681 the Mahim issue started to resurface and in 1689 Bombay islands were attacked by Siddhi’s; these two episodes made it necessary for English to secure Bombay and in 1704 under the leadership of governor Nicolas Waite the reclamation project gained momentum. First half of the eighteenth century witnessed Bombay reclamation moving from discussion to reality. In March 1711 three embankments, two at the north end of Parel and one between Parel and Mahim were connected. In January 1712 embankments between Worli and Mahim were completed. By 1720 attempts for connecting the great breach between Malabar hills and Worli had begun, but it took eight years to be completed, and by 1728 all the islands were connected (Ridings 2018).
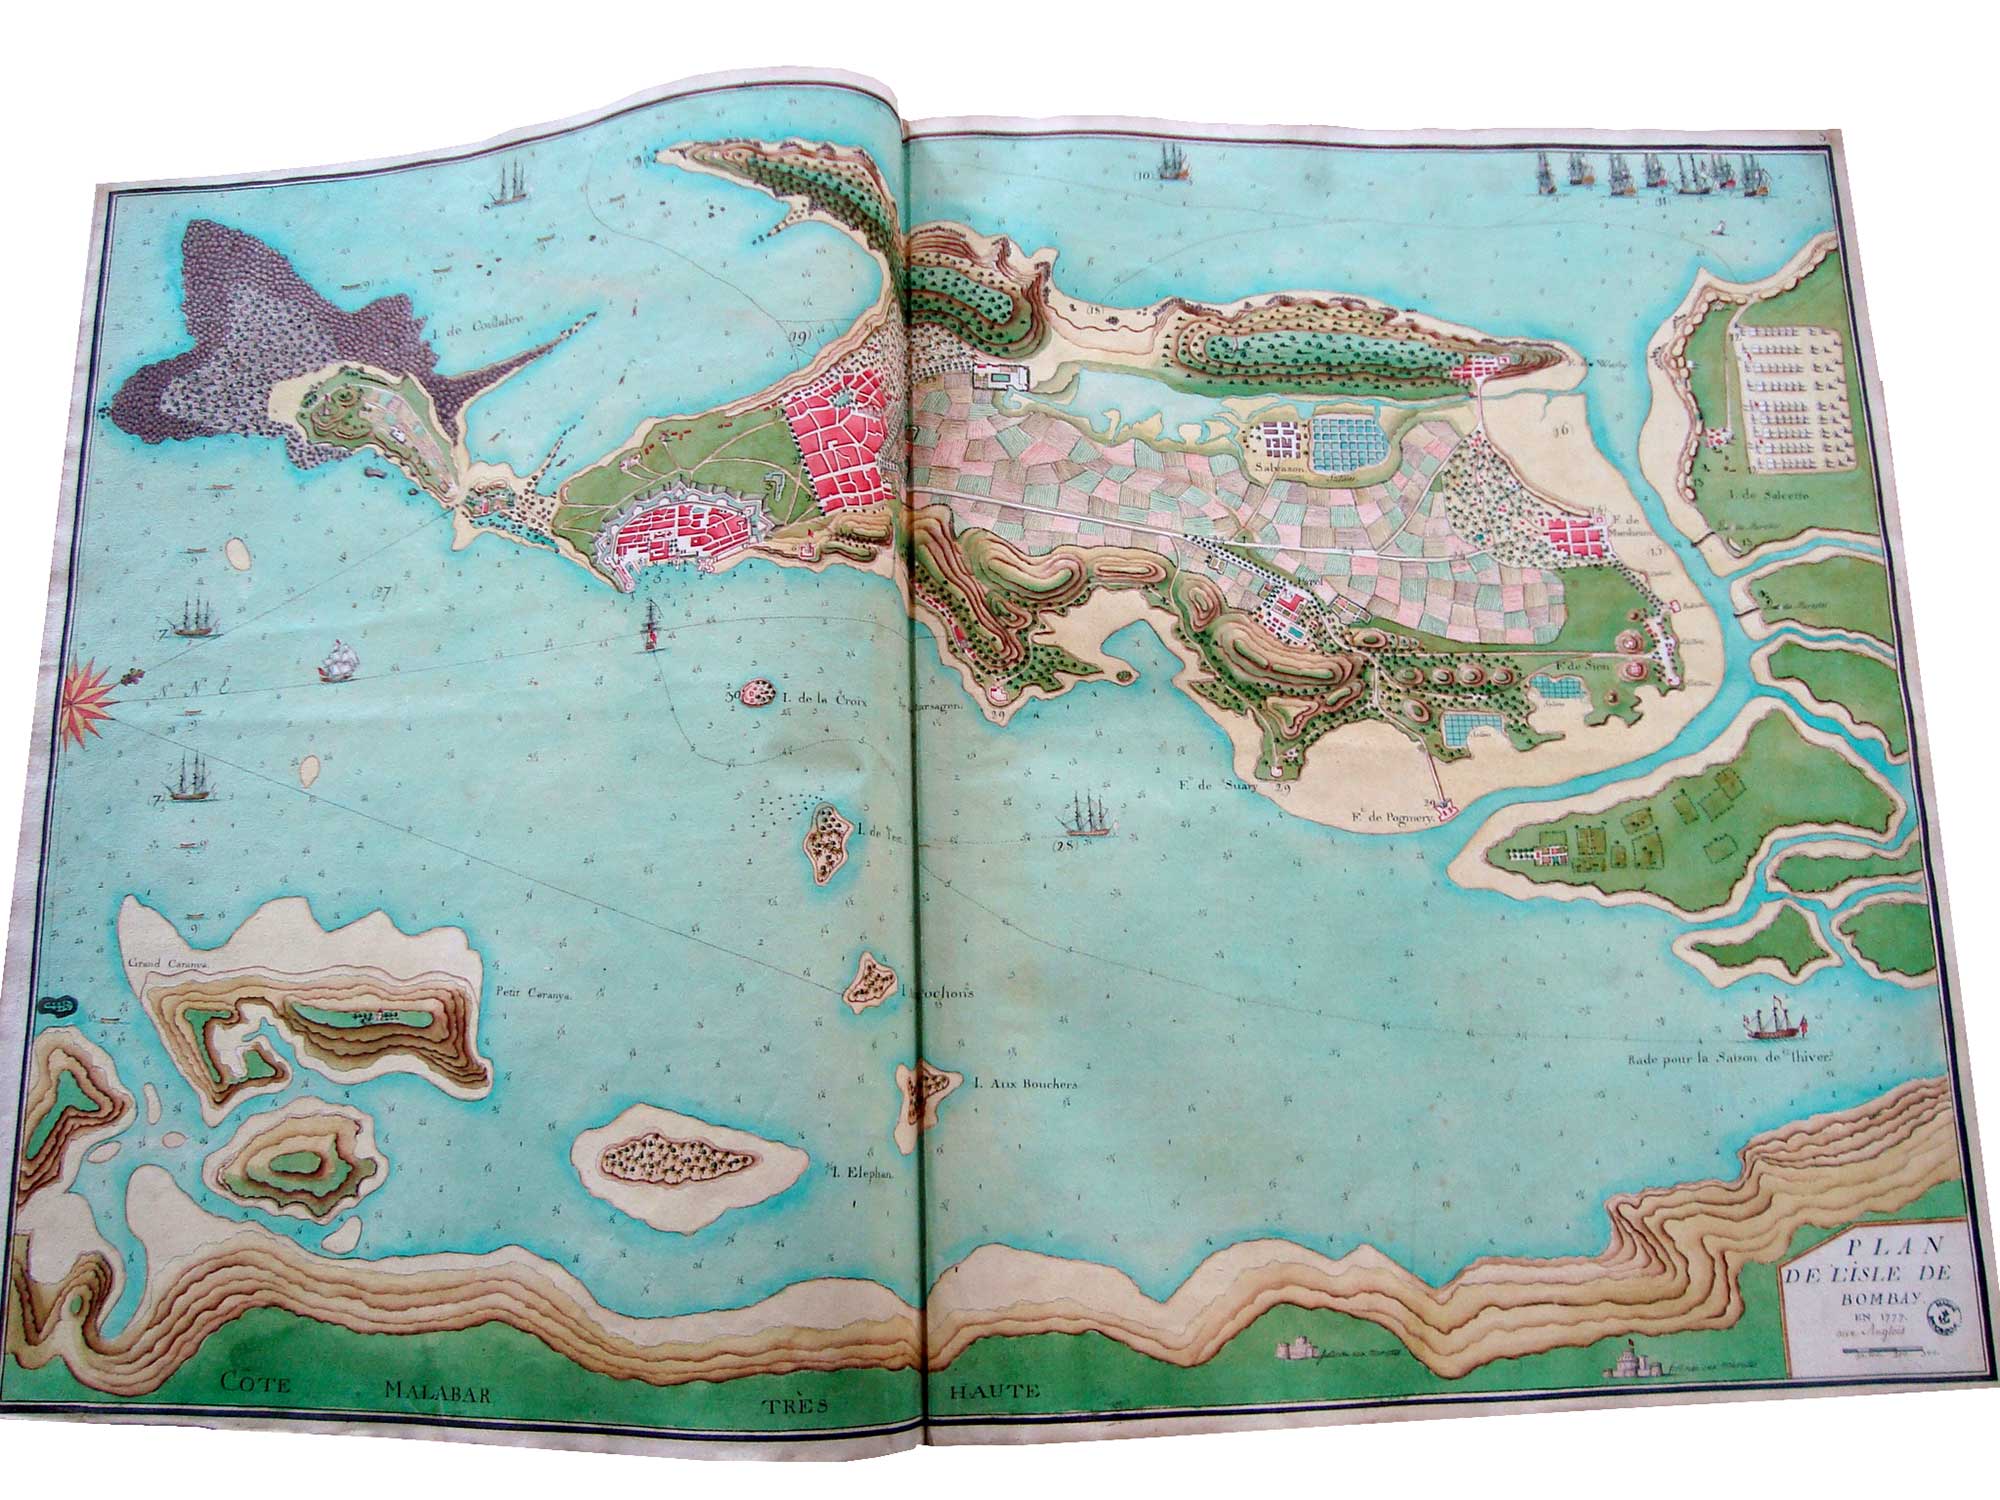
“Bombay” from the lens of French
The French map of 1777 (printed in Schilder, et al. 2006; online copy in: https://worldhistoryconnected.press.uillinois.edu/14.1/images/forum_mitchell_fig02b.jpg Accessed on 31 May 2022) shows Bombay as one united island, but unlike the 1685 map, this gives lots of topographical and land use details such as hills, forts, settlements and the area in between (marked as a lake in 1678 map) has a large span of paddy fields, some salt pans and the peripheral area with palm plantation. This map does depict Bombay as a single island but it also shows the land usage and morphology to be in line with the natural topography and hydrology, unlike the English map of 1865.
However, the reclamation did not solve food insecurity, hence the EIC expanded territories initially for access to resources and by the early nineteenth century, the holdings had spread enough to make the initial purpose of reclamation (for creating agricultural land and revenue) irrelevant. In lieu of the new context, the reclamation project gained a new retrospective importance, that of meeting the requirements of urban expansion. This led, in the early nineteenth century, to increased interest in the history of this landscape.
Methodology
Analysing old cartographic records using geospatial techniques has provided a unique and conclusive explanation for a few questions on space and time that remained unanswered through other methods. For example, what constituted the “seven pagodas” of Mahabalipuram was understood by geospatial analysis of a 17th-century portolan chart (Rajani and Kasturirangan 2013) and the locations and extents of Portuguese and Dutch fortifications at Kollam were understood by a similar analysis of old maps of the area (Gupta and Rajani 2020b). Among historical maps, the ones made using trigonometrical survey and vertical orthographic projection (top-down view) are generally spatially accurate, that is, the locations, shapes and proportions of features they depict are often consistent with identifiable features in georeferenced satellite imagery (Rajani 2020).
The 1843 map was georeferenced using satellite images and coordinates from Google Earth. Eleven ground control points (GCP; common points that can be identified between 1843 map and satellite image, the latter would also provide latitude longitude for each of the points) were identified and were used to georeference the map. The geographical features like prominent corners of islands of Mahim, Worli, tip of Malabar hills, etc.were selected as GCP as they are visible in the recent satellite image as well as the 1843 map. The transformation type used was Polynomial 1 and the resampling method was Nearest Neighbourhood. A polygon vector layer was created (on QGIS) by tracing the boundaries of seven islands marked on the 1843 map. This vector layer was then overlaid on the DEM.
The nautical chart Gulf of Cutch to Vizidurg (1860) is the first map to give a planimetric shape of the united Bombay island. It was difficult to find GCPs to georeference this map, as we couldn't find common features. We therefore found another map (Survey of India, 1946, one-inch to a mile, surveyed in 1924–25-26) which had features common with the 1860 map and the 1946 map was first georeferenced using a total of 29 ground control points that could be identified on Google Earth imagery. These were railway lines, road junctions, monuments, lakes, hills and river bends. The transformation type used for this georeferencing was Polynomial 1 and the resampling method was Nearest Neighbourhood. This georeferenced 1946 map was then used as a source to georeference the 1860 map. A total of 15 GCP (railway line, buildings, roads) were identified and Thin Plate Spline transformation and Cubic Spline resampling were used. This chart shows the railway line cutting across the Bombay island down to the Fort marking the urban expansion. Figure 2c shows the planimetric shape of the one united Bombay island, this would be the shape the island acquired post 1728 and would have been so for more than a century when further reclamation projects were taken up in the periphery of the island expanding into the sea on east, west and south and uniting with Bandra on the north.
The DEM used for this study is from Shuttle Radar Terrain Mission (SRTM), which has provided global 90–30 m DEMs using interferometric principles; this DEM is available on open source platforms (downloaded from https://earthexplorer.usgs.gov/). We used the one Arc Sec (30 m) DEM; the region covering the study area was clipped from a larger tile, and the elevation values were stretched for a minimum −5 to maximum 25, so that the topography of the region can be clearly observed (see Fig. 4). Furthermore, contours were generated using the DEM.

Digital Elevation Model (SRTM 1 Arc Sec; 30 m) overlaid with: a conjectured extent of islands depicted in the Portuguese map (1640–1678); b conjectured extent of islands, inundated area and breaches depicted 1678 map; c shape of the single united Bombay island as depicted in 1860 map
Analysis
The visualisation of the vector layer (of island boundaries marked in 1843 map) over the DEM clearly showed that the shapes of seven islands marked in 1843 map encircles areas of higher elevation (Fig. 4a). But for some differences near Colaba and little Colaba (which is due to tall buildings obscuring the topography that the STRM sensors could sense) the rest of the islands, their shapes and their extent were very clearly observable on the DEM. The 10 m height-contour generated from SRTM 1 Arc Sec DEM (Fig. 4c) shows shapes of contour similar to the shapes of islands marked in 1843 map (the large number of smaller polygons of 10 m contour in Fig. 4c is because of the elevations of modern buildings). This clearly shows that the shapes of the seven islands in the 1843 map follow height-contours. The makers of the 1843 map also would have arrived at the given shapes for the islands by tracing a specific height-contour. The Great Trigonometrical Survey of India which commenced in 1802 and was completed in 1871 was a project which surveyed the entire Indian subcontinent with scientific precision. As part of this survey, the region of Bombay Presidency was covered between 1831 and 1841 (Keay 2000). The topographical maps from this survey provided the height-contours, which must have been used for tracing the island boundaries for the 1843 map. The makers of this map must have chosen a particular height-contour and traced that height across the whole of the present Mumbai city region. Therefore this map is spatially and topographically (shapes and relief of hills, distances between features and east–west versus north–south proportion) accurate. Because of this precision, the features marked in this map, as remarked by Riding (2018) have acquired “scientific exactitude”. The makers of the 1843 map used height-contour to define the shorelines of the islands. The particular height-contour that was chosen divided the region into seven separate boundaries, but if a higher contour was chosen the number of separate islands may have been more (for instance see 13 m contour in Fig. 4d) and similarly a lower contour may have resulted in fewer island boundaries (as can be seen on Fig. 4b, which has height-contours of 7 m). The height-contours overlaid on Fig. 4 b, c and d are generated using SRTM 1 Arc Sec DEM.
Depicting contours as shoreline is very simplistic, which would mean that the sea-level change is the only process that has affected the change in topography and that the shoreline is analogous to a horizontal water line that would raise or dip evenly across the whole region. In reality, the shape of the shoreline is very complex and is affected not only by sea level but several other coastal processes like deposition, accretion, sediment transportation, wind direction and wave action, especially if the coast is not made purely of rocks and has sand beaches. Therefore although the 1843 map is spatially and topographically accurate for the land features it depicts, the delineation of shoreline (that is the boundary between land and water) based on a height-contour is erroneous.
Historical maps are a good source of information about the coastal geomorphic changes (Gupta and Rajani 2020b). However, as humans have heavily modified the landscape since the seventeenth century, it is difficult to comment on the sea-level change and the coastal dynamics in recent centuries. Nevertheless, the Portuguese map, the 1678 map, the 1843 map and the contours derived from DEM helped us in understanding and tracing the past landscape and its transformation.
The Bombay Fort
The Bombay Fort of the 1830s was a gigantic structure as depicted in this intriguing historical manuscript map (https://artsandculture.google.com/asset/mumbai-maharashtra/IQGeyPPg4N6yFQ Accessed on 31 May 2022). The fort was surrounded by wide walls, breastworks, moats and was placed along the harbour, immediately to the south of the city of Bombay. It was the epicentre of the ‘Company Raj’ in Western India, with all of the civil government, military, and revenue finance systems of the East India Company's Presidency of Bombay based there, making it the subcontinent's densest concentration of power between the mid 18th and mid nineteenth centuries.
After taking possession of Bombay in 1668, the EIC centred its operations at ‘The Castle’. The structures and defensive works around The Castle were steadily enlarged over the early eighteenth century, and by the 1750s, the Fort complex had taken shape. While many of the Fort's buildings were retained, the walls of Bombay Fort and Fort George were demolished between 1862 and 1864, as the urge to connect the administrative district with the city surpassed what were then outdated security concerns.
A preliminary comparison of the layout patterns of Bombay Fort with the major streets of the region as seen on Google Earth image has been reported (Rajani 2020). The striking similarities in the details (of street patterns, buildings, revenue blocks) between the 1840 plan of Bombay Fort and the present layout of the Fort area were so compelling that further analysis was undertaken in the present study.
Methodology
Initially all intact old buildings were identified and marked on Google earth. They are: Asiatic Society (Town Hall); Western Naval Command Headquarter (Bombay Castle); Indian Mint House; St Andrew’s Church; St Thomas Church; Maharashtra State Directorate of Museums and Archaeology headquarter (George Fort Magazine) (Fig. 5). These buildings identifiable on Google Earth images served as GCPs for georeferencing the 1840 map (using Polynomial 1 transformation and Nearest Neighborhood resampling). The starkly visible displacement of the Bombay Green circle is not due to erroneous georeferencing but rather the entire circle was shifted northward, by approx. 50 m, to align with the Town hall on the east, the Bombay Green Circle (after independence it was named as Horniman Circle (Fig. 8) and flora fountain on the west. Further, the present and old names of the roads were compared and marked on Google Earth. The comparison was done using present as well as historical satellite images available on Google Earth and vector layers of the roads were generated in QGIS.

Field photos of selected buildings in Bombay Fort area
Analysis
The Bombay Fort at its peak had many important buildings like Bombay Castle, New Mint, Town Hall, Andrew’s Church, Saint Thomas Church, George Fort Magazine, Bombay Green Circle, Custom House and the locations of these buildings are well known(Fig. 5) (see Table 1 for a list of buildings and their locations). There were well planned tanks, moat surrounding the fort, dock yard, streets, lanes and revenue plots (Fig. 6). As mentioned above for the expansion of the city the Fort walls, gates and moat were brought down systematically.

The layout of erstwhile Bombay Fort overlaid on Google Earth image (March 2022 Maxar Technologies)
Three mighty gates that protected the Bombay Fort are Bazar Gate on the north, Church gate on the west, Apollo Gate on the south, and the sea was on the eastern side. Using the georeferenced map we were able to identify locations of these gates. The Bazar gate, as suggested by the name, was located on the Bazar side of the Fort, opposite to Bhatia Baug, the exact location of the gate was where the present Perin Nariman street meets Walchand Hirachand Marg. The Church Gate, as the name indicates was located on Church street. The gate was originally located near the present intersection of Flora Fountain and Veer Nariman Road. The Apollo Gate, named after nearby Apollo Bunder was located near the present Muster Gate on Doctor Salim Ali Chowk. Its exact location may be where the present Naval Armament Inspection Organization building stands (Fig. 6).
Since the Bombay Fort was where all the major British government transactions took place, for security and defence purposes the Fort was surrounded by a moat and a wide esplanade. The area south of the present Chhatrapati Shivaji Maharaj Vastu Sangrahalaya and west of Mahatma Gandhi road going till Bhatia Baug in the north consisted of fortification walls and Moat (see 3D visualisation of this fort in the present context in Fig. 7). Some streets and shapes of the revenue plots are almost unchanged from the time the Fort was active. The setup of the Bazar area that is the present area between Bora Bazar Street and Mint Road is almost unchanged. Except for the width of the road, streets and lanes, the majority of the lanes are intact. Table 2 lists the streets which are still in use, some of them have been renamed. The layout of revenue plots near Bazar Gate between Bora Bazar Street and Mint Road is unchanged, but more lanes are added between the buildings. The four blocks between Fountain Sizzlers, Ash Lane, Allana Lane, Nanik Motwani Marg and B Bharucha Road have also retained the original layout. Three blocks between Nagaindas Master Road, Rope Walk Lane and Mahatma Gandhi Road are of the same layout as the old revenue plots marked in the 1840 map. The other block that has retained the original shape is one opposite the Bombay Stock Exchange building, between the roads Green Street, Mumbai Samachar Marg and Shahid Bhagat Singh Road (Figs. 6 and 7).

3D virtual model of Bombay Fort visualised in the context of the present landscape
The land use in a city keeps changing the landscape as per the need, but the analysis of Plan of Bombay Fort 1840 and 1862 using geospatial analysis helped us to pinpoint the exact locations of a few important government buildings during the peak period of the Bombay Fort. This analysis demonstrated how understanding the geomorphology shows us how the landscape holds the memory of the past and therefore becomes a source of information for understanding the history of the landscape (Fig. 8).

Sign Board outside of the Horniman Circle, Mumbai, with the information on displacement of the Horniman Circle
Results and discussions
The geospatial analysis of the region covering the present Mumbai city has shown that at the time of transition from Portuguese to English control (1661) the region had four islands (Worli, Mahim, Bombay and Colaba) as marked in the Portuguese map (Fig. 1) and also the English map of 1678 (Fig. 3). The seven islands marked on the 1843 map are height-contours that may have been traced from the topographical map resulting from the first trigonometrical survey done of the region in the 1830s (Parel, Mazgaon and Bombay appear as separate islands based on the selected contours on 1843 map, whereas they would have been a unified island as depicted in earlier maps). The height-contours have been erroneously projected as island boundaries in the 1843 map. Hence the “Bombay '' region possibly had only four islands (NOT seven) in the seventeenth and eighteenth centuries prior to reclamation.
Geospatial analysis of the area of the Bombay Fort has revealed that although the contours of the fortification have disappeared, the street and revenue block patterns hold memory of the layout of the erstwhile colonial Fort. The study has also been able to identify the exact locations of many important buildings, gates, streets and moats.
This study of the Bombay islands and Bombay Fort demonstrates that geospatial analysis using satellite imagery, historical maps and records together with ground survey, is able to provide a nuanced understanding of the history of a landscape. The insights that geospatial data and analysis can provide are unique; they not only provide new information but also help in resolving old mysteries.
References
Gupta, E., Rajani, M.B.: Geospatial analysis of historical cartographic data of Kollam Fort. J. Indian Soc. Remote Sens. 48, 1567–1581 (2020a). https://doi.org/10.1007/s12524-020-01181-w
Gupta, E., Rajani, M.B.: Historical coastal maps: importance and challenges in their use in studying coastal geomorphology. J. Coast. Conserv. 24, 24 (2020b). https://doi.org/10.1007/s11852-020-00739-7
Keay, J.: The great arc. Harper Collins, London (2000)
Navalgund, R.R., Korisettar, R.: Geospatial Techniques in Archaeology. Curr. Sci. Special Sect. 113(10), 25 (2017)
O. C. (1901). [Review of The Origin of Bombay, by J. G. da Cunha]. Journal of the Royal Asiatic Society of Great Britain and Ireland, 351–355. http://www.jstor.org/stable/25208311
Poncha R. (2016) A Study of Frere Town, Bombay (1862–1947) unpublished Doctoral Thesis
Rajani, M.B.: Patterns in past settlements: Geospatial analysis of imprints of cultural heritage on landscapes. Springer Nature, Singapore (2020)
Rajani, M.B., Kasturirangan, K.: Sea-level changes and its impact on coastal archaeological monuments: seven pagodas of Mahabalipuram, a case study. J. Indian Soc. Remote Sens. 41(2), 461–468 (2013)
Riding, T. (2018). Making Bombay Island: land reclamation and geographical conceptions of Bombay, 1661–1728. J. Historic. Geograp. 59, 27–39. https://www.sciencedirect.com/science/article/pii/S0305748816301529
Sankalia, H.D.: Stone age industries of mumbai: a re-appraisal. J. Asiatic Soc. Bombay 34, 120–131 (1962)
Schilder, G, et al. 2006. Grote Atlas van de Verenigde Oost-Indische Compagnie (Comprehensive Atlas of the Dutch United East India Company). Voorburg : Asia Maior, in Collaboration with Koninklijk Nederlands Aardrijkskundig Genootschap, Nationaal Archief, Explokart, Fac. Geowetens. Utrecht University, Faculty of Geosciences. Volume 6. 2010. P.226
Acknowledgements
The research reported in this paper was conducted as part of an extramural project funded by the Ministry of Earth Science, Government of India; we thank MoES for the same. We are very grateful to Western Naval Command Mumbai, India Mint Mumbai, Asiatic Society Mumbai, Maharashtra State Directorate of Museums and Archaeology Mumbai, for permitting us to visit their premises. We thank Prof Maithreyi Narasimha for supporting our research by arranging accommodation in the TIFR guest house during our field visit. We thank our lab-mates Mythrayi Harshavardhan, Gaurav Kumar Pal, Arya S. Pradeep, and Shubhi Mishra for their assistance during field survey and archival visits. We thank John Carter Brown Library, Brown University and Archivo Histórico Ultramarino (Arquivo Histórico Ultramarino) for providing us with High-resolution images of maps. We are grateful to Shailesh Nayak, Director, NIAS, for the institutional support and encouragement.
Author information
Authors and Affiliations
Corresponding author
Rights and permissions
Springer Nature or its licensor holds exclusive rights to this article under a publishing agreement with the author(s) or other rightsholder(s); author self-archiving of the accepted manuscript version of this article is solely governed by the terms of such publishing agreement and applicable law.
About this article

Cite this article
Mhaske, A., Rajani, M.B. Analysing topographical transformation of Bombay Islands and Bombay Fort using geospatial analysis and historical records. Proc.Indian Natl. Sci. Acad. 88, 345–356 (2022). https://doi.org/10.1007/s43538-022-00091-4
Received:
Accepted:
Published:
Issue Date:
DOI: https://doi.org/10.1007/s43538-022-00091-4