
Abstract
In this paper, a conceptual design for a reusable unmanned space vehicle was studied with multiple objective functions. To achieve this goal, a multi-objective genetic algorithm was used, and the performance of the space vehicle was evaluated based on weight, propulsion, aerothermodynamics, and trajectory analysis. Minimization of weight and landing speed and maximization of the highest CL in the supersonic flight regime were selected as the objective functions. The maximum limits in the dynamic pressure and the heat flux were applied as constraints. All objective functions are in trade-off relationships with each other. The geometry that produced the smallest weight had a very small wing size. Also, the vehicle that had the maximum CL in the supersonic flight regime had a closer angle between the flow and the lower surface of the wing, which showed the highest CL on the flat surface. The vehicle design with the lowest landing speed had the largest wing, which generated sufficient lift.
1 Introduction
Various scientific experiments are being conducted to promote the evolution of space science. However, it is difficult to simulate cosmic environmental conditions such as micro gravity on the ground. This is why many experiments are conducted directly in space. However, if experiments are performed with an expendable vehicle, it is necessary to create a new vehicle every time, which is a huge expense. To reduce these costs, there is a need for reusable manned/unmanned space vehicles.
Reusable unmanned space vehicles are complex systems that must be designed considering aerothermodynamics, structure, weight, propulsion, trajectory, control, cost and so on. Therefore, various analyses are necessary when designing a space vehicle. Multidisciplinary optimization (MDO) is used to efficiently account for these various analyses [1]. This is because MDO includes various analyses and optimizations, and quickly identifies a feasible result in the design space.
Several studies have conducted space vehicle designs with MDO. Lawrence designed a rocket-based single-stage-to-orbit vehicle based on weight, sizing, operations and cost analysis [2]. Tsuchiya designed a two-stage reusable rocket vehicle and a hypersonic experimental vehicle, with a purpose to reduce the weight through multidisciplinary analyses of weight, aerodynamics, propulsion, and vehicle trajectory [3, 4]. Yokoyama designed a single-stage-to-orbit space plane by analyzing the weight, aerodynamics, and propulsion of the vehicle [5]. Most designs of reusable space vehicles have only focused on weight reduction. However, since reusable space vehicles are made for various purposes, they should be designed considering both the weight and various objective functions such as lift and landing speed.
Therefore, the purpose of this study is to design a reusable unmanned space vehicle with multiple objective functions. To achieve this goal, the present MDO study integrates the analyses in the design geometry, weight, propulsion, aerothermodynamics, trajectory, and a multi-objective genetic algorithm (MOGA) [6]. The extreme solutions were selected in a Pareto solution to compare the geometry and performance.
2 Analysis Method
Figure 1 shows the overall analysis and optimization process. Each analysis has effects on other analyses. Therefore, it was necessary to converge coupling variables through iterative calculations. After coupling variables converged, the performance was calculated according to the geometry, and optimization was performed using that.
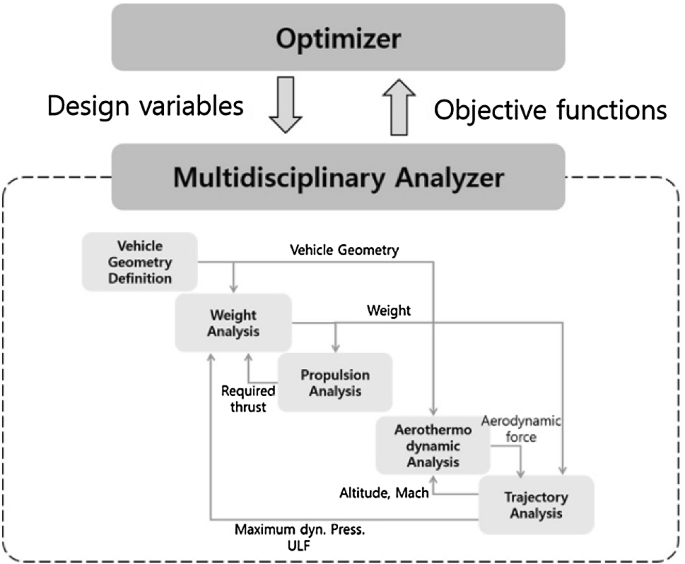
Overall MDO process
2.1 Vehicle Geometry Definition
The fuselage was divided into the nose part and two sections. Each section of the fuselage is made up of one cross-section, and the cross-section is defined by three variables: rectangular height, corner radius, and width. Spherically blunted tangent ogive curves were used to define the blunt nose. The planforms of the wings were defined using four variables: sweep angle, span, tip chord, and root chord. The airfoil was defined as a NACA 4 series. Furthermore, two variables were used to locate each wing. The variables used to define the geometry are shown in Fig. 2, and a detailed list of variables is provided in Table 1.

Geometry variables
In addition, the vehicle has a rear body flap. The width of this flap is the same as that of body section 2, and its length is 1/8 of the total length of the fuselage.
2.2 Weight Analysis
In the weight analysis, the weight of each part of the vehicle and the center of gravity of the entire vehicle are calculated. The size of each part is given in the vehicle geometry definition and the amount of fuel and the weight of the engine were obtained from propulsion analysis. Hypersonic aerospace sizing analysis (HASA) was employed in this study [7]. HASA estimates the weight of each part of the vehicle using statistical methods. However, HASA was modified to improve the accuracy because the statistical equations were made using data from 100 t class vehicles, while the target of this study is about 2–3 t.
In this study, the vehicle enters mission orbit using the launch vehicle. The landing weight is lighter than the gross weight because fuel is used during the mission. Thus, the landing gear weight should be estimated based on the landing weight as follows [8].
where Wgear is the landing gear weight and Wland is the maximum landing weight.
The actual weight of the thermal protection system (TPS) was calculated as a product of the TPS density and the area. The type of TPS on each surface was determined by referring to the space shuttle. A reinforced carbon–carbon (RCC) was applied for the nose and leading edge. A high-temperature reusable surface insulation (HRSI) was applied on the lower surface of the fuselage and the wing, and a fibrous refractory composite insulation (FRSI) was used in other parts. The type of TPS is shown in Fig. 3.

Type of TPS on each surface (gray: RCC, black: HRSI, white: FRSI)
The avionics weight was reduced using a reduction factor due to technological developments [9]. The payload weight was assumed to be 226.8 kg and the density was 52.86 kg/m3.
The estimated weight was compared with the actual weight of the Boeing X-37 [10]. The Boeing X-37, however, has more fuel than the vehicles designed in this study because X-37 is for long-term missions. Therefore, the fuel quantity is set to the actual fuel weight of X-37 for comparison. The results are summarized in Table 2. When the original HASA is used, the error is very large (90.3%). On the other hand, the modified HASA estimated the weight accurately within only 4.0% error.
2.3 Propulsion Analysis
In this study, the space vehicle does not need a main engine because it is brought into orbit using a launch vehicle. However, an orbital maneuvering system and a reaction control system (OMS/RCS) are needed to modify the orbit or the attitude. The thrust requirement of OMS/RCS was calculated based on the space vehicle design study of Rohrschneider [8]. The weights of the OMS/RCS were calculated based on the required thrust. The thrust-to-weight ratio of the OMS, primary RCS and vernier RCS were 22, 39.5 and 9.4, respectively [8]. The numbers of the primary RCS and Vernier RCS were set to 38 and 6, respectively, based on the design of the Space Shuttle.
The OMS/RCS uses a cryogenic propellant fuel (LOX/LH2). The fuel weight was calculated based on the required thrust [8]. Each tank was composed of a cylinder with dome-shape ends. The radius of the tank was the same as that of the circle tangent to the body section, as shown in Fig. 4.

Radius of tank
2.4 Aerothermodynamic Analysis
Space vehicles experience a wide range of speed from hypersonic to subsonic when executing a mission. The aerodynamic properties of the vehicle were obtained using Modified Newtonian Impact Theory in hypersonic and supersonic flight regimes, and Digital DATCOM in subsonic flight regime [11, 12]. The aerodynamic force was calculated according to the altitude and velocity obtained from the trajectory analysis. The aerodynamic analysis also evaluated the longitudinal stability based on the pitching moments. Maintaining longitudinal stability is one of the constraints. Pressure distribution and the center of gravity obtained from the weight analysis were used to determine whether or not the longitudinal stability can be maintained. The angle of attack used to evaluate the aerodynamic force varies with the Mach number. The angle of attack at a specific Mach number is shown in Fig. 5 [13].

Pre-described α according to the Mach number
Since the vehicle passes through hypersonic and supersonic flight regimes, the amount of heat flux by aerodynamic heating must be evaluated. The formula for calculating the heat flux is expressed as follows [14].
To prevent excessive load and heat flux on the vehicle, dynamic pressure and the heat flux were limited to 50 kPa and 4 MW/m2, respectively.
2.5 Trajectory Analysis
Three degree of freedom (3DOF) trajectory analysis was implemented. The trajectory analysis uses the weight and the aerodynamic force. In this study, the trajectory of the vehicle was analyzed only from the orbit to the landing since the vehicle reaches orbit using the launch vehicle. The initial trajectory conditions are summarized in Table 3. The next position and velocity were determined based on the gravity and aerodynamic force of the previous position. In turn, the position and velocity were used to calculate the aerodynamic force in the current position. The fourth Runge–Kutta method was used for time marching.
3 Optimization
3.1 Optimization Algorithm
In this study, a real-coded MOGA was adopted for the MDO to account for the multiple objective functions. Figure 6 shows the overall procedure for the optimization process. It is well-known that GAs require a large computational cost due to population-based searches. Therefore, the evaluation of each individual was run in parallel. Each thread executes the analysis separately according to the design variables and calculates the objective functions of the individual. As a result, the total evaluation time is shortened. Figure 7 shows a schematic of a parallelized evaluation of each individual.

Flowchart for the optimization process

Summary of parallel evaluation of the objective function
3.2 Definition of the Optimization Problem
In MOGA, the population and generation numbers were set to 256 and 100, respectively. There are three objective functions as follows:
-
1.
Minimize weight.
-
2.
Maximize the highest CL in the supersonic flight regime where the Mach number is larger than unity.
-
3.
Minimize landing speed.
As constraints, maximum heat flux and maximum dynamic pressure must be below 4 MW/m2 and 50 kPa, respectively, and the longitudinal stability should be maintained.
4 Results
Figure 8 shows the Pareto solutions plotted in objective function space. All the objective functions are in trade-off relationships with each other. Several solutions from the Pareto solution were selected to identify geometrical features. The lightest vehicle in the Pareto solution is named ‘OPT1’. The vehicle with the highest maximum CL in the supersonic flight regime in the Pareto solution is named ‘OPT2’. The vehicle with the slowest landing speed in the Pareto solution is named ‘OPT3’, and the vehicle which is a compromise solution with regard to all objective functions is named ‘OPT4’. Figure 9 shows the geometries of OPT1-4, and Table 4 summarizes the performance and weight data of OPT1-4.

Pareto solution of each pair of objective functions. a Weight and CL, b weight and landing speed, c CL and landing speed

Geometries of OPT1-4. a OPT1, b OPT, c OPT3, d OPT4
The width of the fuselage of OPT1-4 is larger than the height of that in Fig. 9. Thus, CL is increased by widening the area directly receiving the flow.
OPT1 has the smallest wing. That is, the overall weight was reduced by cutting the weight of the wings.
In Modified Newtonian Impact Theory, CL is maximized when the angle between the flow and flat surface is 54.74°. The angle between the flow and the lower surface of the wing of OPT2 is closer to 54.74° in the wider range than that of the others, as shown in Fig. 10. Therefore, the wing of OPT2 can provide more lift coefficient than that of the others, such as those in Fig. 11.

Distribution of angle between the flow and the lower surface on the mid-span wing of OPT1-4 at α = 40°

Cp distribution on mid-span of the wing of OPT1-3 at M = 20 and α = 40°
The altitude and velocity of OPT3 deceased earlier than the others, as shown in Fig. 12. This is why the largest wing of OPT3 causes more drag. However, a lot of lift was generated from the largest wing, and sufficient deceleration was achieved during the fall, resulting in a lower landing speed.

Altitude and velocity of OPT1-3 with time
5 Conclusion
In this study, reusable unmanned space vehicles, which start descent from a low-earth orbit (LEO) and land on the ground, are designed with several objective functions. To achieve this goal, an MDO was constructed consisting of vehicle geometry definition, weight analysis, propulsion analysis, aerothermodynamic analysis, trajectory analysis, and a multi-objective genetic algorithm (MOGA). There are three objectives: to minimize weight, to maximize the highest CL in the supersonic flight regime and to minimize the landing speed. As constraints, the maximum heat flux and maximum dynamic pressure are limited to 4 MW/m2 and 50 kPa, respectively, while longitudinal stability is maintained. The extreme solutions were selected in the Pareto solution, and the geometry and performance were compared according to the objective functions. All objective functions are in trade-off relationships with each other. Furthermore, conceptually designed geometries increased the maximum CL by widening the area directly receiving the flow. The overall weight of the lightest vehicle was reduced by reducing the size of the wings. In the supersonic flight regime, the vehicle with the largest maximum CL had a closer angle between the flow and the lower surface of the wing than the angle that resulted in the highest CL. The vehicle with the lowest landing speed achieved sufficient deceleration with the largest wing size.
Abbreviations
- C L :
-
Lift coefficient
- C p :
-
Pressure coefficient
- L f :
-
Length of fuselage
- M :
-
Mach number
- \( \dot{q} \) :
-
Heat flux
- W gear :
-
Weight of landing gear
- W land :
-
Landing weight
- V :
-
Relative velocity
- α :
-
Angle of attack
- ρ :
-
Atmosphere density
References
Hammord WE (2001) Design methodologies for space transportation systems. AIAA, Reston
Lawrence R, Robert D (1999) Multidisciplinary conceptual design optimization of space transportation systems. J Aircr 36(1):218–226
Tsuchiya T, Mori T (2004) Optimal conceptual design of two-stage reusable rocket vehicles including trajectory optimization. J Spacecr Rockets 41(5):770–778
Tsuchiya T, Takenaka Y, Taguchi H (2007) Multidisciplinary design optimization for hypersonic experimental vehicle. AIAA J 45(7):1655–1662
Yokoyama N, Shinji S, Tsuchiya T, Taguchi H, Kanda T (2007) Multidisciplinary design optimization for space plane considering rigid body characteristics. J Spacecr Rockets 44(1):121–131
Hashimoto A, Jeong S, Obayashi S (2015) Aerodynamic optimization of near-future high-wing aircraft. Transa Jpn Soc Aeronaut Space Sci 58(2):73–82
Harloff G J, Berkowiz B M (1988) HASA-hypersonic aerospace sizing analysis for the preliminary design of aerospace vehicles. NASA CR-182226
Rohrschneider RR (2002) Development of a mass estimating relationship database for launch vehicle conceptual design. AE8900 Special Project, Georgia Institute of Technology
Nakata Y, Taura S, Nakayama T, Nakagawa N (2004) Advanced integrated modular avionics. J Jpn Soc Aeronaut Space Sci 52(607):2–9
George C (2003) X-37 Demonstrator to test future launch technologies in orbit and reentry environments. NASA FS-2003-05-65-MSFC
Anderson DJ (2004) Modern compressible flow. Mc Graw Hill, New York
Fink R (1978) USAF stability and control DATCOM. AFWAL-TR-83-3048
Gamble DJ, Cooke RD, Underwood MJ, Stone WH, Schlosser CD (1985) The development and application of aerodynamic uncertainties and flight test verification for the space shuttle orbiter. In: Space shuttle technical conference, NACA CP-2342, Part 1, N82-16910
Liu X, Shen Z, Lu P (2016) Entry Trajectory Optimization by Second-Order Cone Programming. J Guidance Control Dyn 39(2):227–241
Acknowledgements
This work is supported by a Grant from the National Research Foundation of Korea (NRF-2017M1A3A3A02016269). Images in this paper were created using FieldView, as provided by Intelligent Light through its University Partner Program.
Author information
Authors and Affiliations
Corresponding author
Rights and permissions
About this article

Cite this article
Jung, J., Yang, H., Kim, K. et al. Conceptual Design of a Reusable Unmanned Space Vehicle Using Multidisciplinary Optimization. Int. J. Aeronaut. Space Sci. 19, 743–750 (2018). https://doi.org/10.1007/s42405-018-0079-2
Received:
Revised:
Accepted:
Published:
Issue Date:
DOI: https://doi.org/10.1007/s42405-018-0079-2