
Abstract
This study explored potential sources of differential item functioning (DIF) among accommodated and nonaccommodated groups by examining skills and cognitive processes hypothesized to underlie student performance on the National Assessment for Educational Progress (NAEP). Out of 53 released NAEP items in 2007 for grade 8, a total of 25 items were flagged as DIF among the four studied groups (nonaccommodated, accommodated with extra time, accommodated with read aloud, and accommodated with small groups) by a generalized logistic regression method. The Reparameterized Unified Model was fit to the same data using a Q-matrix containing 25 skills that included content-, process-, and item-type attributes. The nonaccommodated group yielded the highest averages of attribute mastery probabilities as well as the largest proportion of mastered examinees among all the groups. The three accommodated groups tended to have similar attribute mastery means, with the group accommodated with small groups yielding a larger proportion of mastery examinees when compared to the other two accommodated groups.
1 Introduction
Educational assessment practices are, among other things, concerned with fairness and appropriate test score interpretation. Recent changes in educational reforms called for the inclusion of students with disabilities (SWD) in state and national assessments across different grades and domains, including mathematics and English language (U.S. Department of Education 2007, p. 17748). The previous edition of the Standards for Educational and Psychological Testing also stated that the assessment community and stakeholders (e.g., the examinees, test developers, and administrators) should ensure that “test inferences accurately reflect the construct which the test intended to measure, rather than any disabilities and their associated characteristics extraneous to the intent of the measurement” (American Psychological Association, American Educational Research Association, and National Council on Measurement in Education [APA, AERA, and NCME] 1999, p. 106). The most recent edition of the Standards uses similar language to emphasize that “an appropriate accommodation is one that responds to specific individual characteristics but does so in a way that does not change the construct the test is measuring or the meaning of scores” (APA, AERA, and NCME 2014, p. 67).
As a result, eligible SWD are given some type of accommodation that enables their participation in the assessment. Inclusion of accommodations, however, has raised concerns with respect to validity of test score interpretations, yielding numerous studies investigating its impact across various content areas, including mathematics, language and arts, and science (e.g., Bolt and Ysseldyke 2008; Buzick and Stone 2011; Cook et al. 2010; Engelhard 2009; Huynh et al. 2004; Middleton and Laitusis 2007; Randall et al. 2011; Randall and Engelhard 2010; Scarpati et al. 2011; Steinberg et al. 2011; Stone et al. 2010; Svetina and Wang 2014). Regardless of the content area or the context, when we wish to compare scores among different populations (e.g., students without accommodations vs. students with accommodations), an important criterion is that the latent variable(s) of interest (e.g., proficiency or knowledge) is understood and measured equally across all the groups. In the literature, this property is often referred to as measurement invariance (Meredith 1993), lack of bias (Lord 1980) or absence of differential item functioning (DIF; Hambleton and Rogers 1989; Mellenbergh 1982; Swaminathan and Rogers 1990). It is thus assumed that if an assessment measures the same skills and abilities across different groups, then measurement characteristics (e.g., item parameters or factor loadings) would be similar (Bolt and Ysseldyke 2008).
Given that one of the goals of the current study is to use DIF analyses as a means of establishing measurement equivalence, we focus the background section on DIF studies rather than surveying the entire literature on measurement invariance (which would include multiple-group confirmatory factor analysis). Typically, DIF analyses focus on comparison of two groups only (e.g., male as reference vs. female as focal), and little research has been conducted examining multiple groups (>2 groups) simultaneously, partly due to lack of methods (until recently) to allow for such analyses. In addition, when DIF has been established, it is often the end of investigation; in other words, investigating sources of DIF is not generally sought.
Recent related work by Svetina and Wang (2014) investigated DIF in contexts with accommodations using the National Assessment of Educational Progress (NAEP) data across years, but the authors focused on two groups only—students without accommodations and students with accommodations. Further, the authors examined only cognitive complexity and content domains as potential explanations of DIF. To this end, two purposes of the present study are to:
-
(a)
examine the effect of accommodations in the NAEP mathematics assessment by utilizing a generalized logistic regression (GLR) method to examine DIF across multiple groups (i.e., students without accommodation, accommodated students with extended time, accommodated students with read aloud, and accommodated students with small groups), and
-
(b)
investigate the sources of DIF by focusing on item demands—the skills elicited by items flagged as DIF—in order to potentially uncover sources of DIF among the studied groups.
Using released NAEP items allows for examination of the cognitive demands and processing attributes of the items in order to further relate them to potential sources of DIF. In other words, the focus is given to understanding why DIF occurred, beyond identifying which items exhibited some type of DIF. The aspect of understanding sources of DIF is especially important and is currently severely understudied in educational measurement.
This paper is organized as follows. The first section provides the background for our study. Here, we focus on defining the methodology used in the study, including both the definition of DIF and its use within the context of studying accommodation effects. We also describe related studies that use cognitive diagnostic models (CDMs) to obtain fine-grained information regarding item demands and students’ abilities as those aspects are directly relevant to addressing our second purpose. The second section describes the methods, focusing on the data sources, approach used to identify DIF, and the cognitive model used to obtain student skill profiles. A description of the planned analyses is included to guide the interpretation of results as well. The next section describes the results as they pertain to the two research goals previously stated. Lastly, we discuss the findings and implications for future research in addition to acknowledgement of the limitations.
2 Background
2.1 Definition of DIF
Measurement invariance as a methodological approach can be utilized in a number of different ways. In the current study, the focus is on item-level analysis, as we are interested in understanding if and how characteristics of the items (i.e., skills and processes that are hypothesized to underlie performance on the items) can potentially explain why some items function differently among the different groups.
A general definition of DIF at an item level states that an item behaves differently, or measures differently, for one subgroup of a population (reference group) than another (focal group) after the ability levels for the groups are equal. Analysts have a wide variety of options when it comes to investigating DIF. The choice of the method is often made based on the specific situation of the analyst, including the number of groups that are being compared (e.g., two groups or more than two groups), characteristics of the data at hand (e.g., dichotomously or polytomously scored; missingness or no missingness present), the nature of DIF to be examined (e.g., uniform or nonuniform), and the nature of the method (e.g., parametric or nonparametric). In addition, an analyst chooses method(s) to evaluate DIF based on the choice of the conditioning variable—that is, how the matching between different groups is achieved. Typically, methods belong to one of two frameworks when it comes to the conditioning variable: (a) a classical approach, which uses observed total or rest score, or (b) a latent variable approach, which uses an estimate of an ability parameter for conditioning. For a more detailed overview of various methods currently used in social science research to conduct DIF analyses, a reader might be interested in Camilli (2006), Ferne and Rupp (2007), Magis et al. (2013), Holland and Wainer (1993), or Zenisky et al. (2004).
2.2 Testing accommodations and NAEP
Prior to 1996, NAEP did not allow for accommodations for SWD. As a result, some students who could not meaningfully participate in the assessment were excluded from the assessment altogether. With passing of the Individuals with Disabilities Education Act (IDEA) of 1990 and its amendments, as well as other influential legislation, accommodations were made available to students who were identified as SWD (NAEP, n.d.). With the 2002 assessment, NAEP began to offer accommodations to all eligible students in order for students to participate meaningfully in the assessment. Accommodations in mathematics on the NAEP assessment vary slightly across the grades and include the following accommodations (in descending order of usage according to the percentage of students): extended time, small group, read aloud, breaks, one-on-one, school staff administers, scribe/computer use, and other (e.g., bilingual dictionary) (NAEP, n.d.).
Current research on testing accommodations focuses largely on state assessments across various domains, including mathematics, reading, and science. Several summaries of research on testing accommodation effects have recently been provided by Buzick and Stone (2014), Cormier et al. (2010), Johnstone et al. (2006), Li (2014), Svetina and Wang (2014), and Zenisky and Sireci (2007). These authors reflect on the state of research on testing accommodations with the hope of providing an understanding of current and emerging issues (Zenisky and Sireci 2007). Although each of these studies focuses differently in some ways (e.g., some are summaries of published research for a specific time period, while others are meta-analyses; some include all types of accommodations, while others focus on one particular accommodation), they all examine studies in the field of education that focus on accommodations and their influence on examinees and testing.
In the area of mathematics, researchers have found that large numbers of items are flagged as problematic when groups are based on accommodations. For example, Bolt and Ysseldyke (2008) investigated the impact of accommodations on mathematics assessment and measurement comparability for groups of accommodated students with physical and mental disabilities using DIF analysis. The authors found that comparing a reference group of students (i.e., students without disabilities (SWOD) who did not receive any accommodations) with the physically disabled group, in both grades 4 and 8, had the largest proportion of items identified with moderate to large DIF. Namely, 43 and 58% of items displayed moderate to high DIF for fourth and eighth grades, respectively. Comparing nonaccommodated students with the mentally disabled group yielded similar results, where 40 and 55% of items exhibited moderate to large DIF for the two grades, respectively.
In a recent study conducted by Scarpati et al. (2011), the authors found differences between SWD with accommodations (i.e., use of calculator or altered item presentation) and those without accommodations on an eighth-grade large-scale mathematics assessment. Follow-up analysis suggested that context variables related to item type, academic skills, and accommodation contributed to the performance differences. In studying effects of an extended time accommodation, Cohen et al. (2005) found that items on a mathematics assessment that exhibited DIF were only marginally related to the accommodation itself. In other words, the authors argued that the presence of DIF was not sufficiently explained by the status of an examinee (i.e., receiving vs. not receiving extended time) and that other explanations may be more suitable (e.g., examining latent classes of students based on their skill abilities yielded a more satisfactory explanation of the differences between nonaccommodated and accommodated students).
As suggested by the above-mentioned studies, researchers generally point to an overarching concern that accommodations do not allow for comparable measurement of SWD on a test, which in turn may contribute or lead to test bias. In addition, the validity of accommodated assessments ought to be examined further to have reasonable faith that the test scores of accommodated students reflect their underlying skills. In this spirit, Buzick and Stone (2011) reviewed 17 studies on accommodations during period 1986 to 2010 and provided guidelines for conducting DIF analysis. In their recommendations, the authors highlighted the importance of content experts in interpreting the results, which goes beyond statistical analysis for finding DIF. Further, the authors suggested that more work should be done in evaluating the interactions between item characteristics, accommodation use, and type of student disabilities in order to understand the most appropriate ways to ensure fairness in testing SWD (p. 17). One way to respond to this call is by examining examinees’ responses at a more fine-grained level; a cognitive diagnostic modeling approach may afford us just that.
2.3 Cognitive diagnostic models (CDMs)
A recent increase in demand for cognitive diagnostic information for instructional purposes (Leighton and Gierl 2007) resulted in the development of measurement models that are more complex, informative, and flexible. The No Child Left Behind Act of (2001) also called for assessments to provide “interpretive, descriptive and diagnostic reports” (p. 9) regarding students’ achievements in such a way that “parents, teachers, and principals can understand and address the specific academic needs of students” (p. 9). The family of CDMs is presumed to provide information about individual abilities beyond that of the traditional item response theory (IRT) models, potentially allowing for richer substantive score interpretations. The rapid development of CDMs in educational research confirms the popularity (and usefulness) of these types of models for providing information that goes beyond the exam score or subscore. A large number of models fall into the category of classification models for diagnosis, and scholars have attempted to group them according to particular model characteristics (e.g., DiBello et al. 2007; Fu and Li 2007; Rupp and Templin 2008). CDMs may be established by modeling the probability of correct response to an item as a function of an attribute mastery pattern. Within the CDM framework, consideration can be given with regard to: (a) the types of attribute interactions assumed and modeled (e.g., conjunctive, disjunctive), (b) the nature of the skills space (e.g., dichotomous latent class, continuous latent trait), (c) the number of estimated parameters, (d) the types of items (e.g., dichotomous, polytomous), and (e) the item response functions (e.g., logistic vs. probit). Our purpose is to highlight the structure of these models rather than to discuss the particular specifications of any one model, except to introduce the CDM used in the current study—the Reparameterized Unified Model (RUM; Hartz 2002). Our main motivation for the use of RUM was directly related to the balance of the complexity of the model that can be handled and the information the model provides. A reader is directed to the excellent sources of cognitive diagnostic assessment and measurement texts from Leighton and Gierl (2007) and Rupp et al. (2010) for an overview of various models and approaches.Footnote 1
2.3.1 Cognitive structure: identification of skills
A distinctive feature of CDMs is that they include hypothesized cognitive structures that represent the subprocesses and subskills (attributes) believed to underlie item performance. This relationship between the attributes and the items is documented in a loading structure, also known as the Q-matrix (Li 2011), that hypothesizes a set of skills required for a specific item. In the items by attributes matrix, a “1” in a cell indicates that a particular item demands a mastery of the associated attribute. Typically, the Q-matrix is built by experts in the content area, as they are assumed to be familiar with the types of demands elicited by the items at hand.
2.4 The reparameterized unified model
The RUM, also known as the fusion model, has been used in many CDM applications (DiBello et al. 2007). It is an IRT-based multidimensional model that expresses the stochastic relationship between student latent ability and item responses. The fusion model relates item i = 1… I to a set of predefined cognitive skills k = 1… K in a Q-matrix and assumes the relationship of all the required skills for an item to be conjunctive. In other words, it is assumed that for an examinee to successfully solve an item, he or she ought to have mastered all of the required (associated) skills. One motivation to utilize RUM in the analysis was the rich output it provides. Specifically, and unlike most CDMs, RUM outputs a set of mastery probabilities for each examinee across the hypothesized attributes in the Q-matrix that may include dozens of skills; it also provides evidence of the completeness of the hypothesized Q-matrix. A more technical description as well as examples of RUM can be found in Li (2011) and Roussos et al. (2007).
2.5 Illustration of CDMs using NAEP
Recently, several studies utilized NAEP data to illustrate the use (and performance) of CDMs and the fine-grained information that can be extracted from the item responses beyond the scale score. Xu and von Davier (2006), for example, applied a general diagnostic model (GDM) to NAEP data for estimating group characteristics. Using the GDM, the authors considered cognitive skills for the Q-matrix to be those associated with the subscales reported by NAEP alongside cognitive complexity. The authors found that, overall, the use of the GDM to make inferences about population and subgroups characteristics was satisfactory as it recovered parameters well within a simulation context and seemed promising for use in a real data context.
3 Methods
3.1 NAEP assessment
NAEP was designed originally in the 1960s with the idea to monitor achievement of US students across a number of subject areas, including mathematics, reading, science, writing, the arts, civics, economics, geography, and US history, and in the US, NAEP assessment is often referred to as the “Nation’s Report Card”. Currently, NAEP Mathematics is administered in grades 4 and 8 every odd year and in grade 12 every other odd year. There are different types of programs that NAEP administers, including national, state, and long-term trend assessments. Unlike other assessments, such as the SAT or ACT, which are typically taken by college-bound students, NAEP is administered to a representative sample of all students across the US, regardless of their aspirations with regard to college or university. Thus, some argue, NAEP is a better measure of overall student achievement (what students can and cannot do) for the nation (Kloosterman 2004). More information specifically about NAEP can be found at http://nces.ed.gov/nationsreportcard/.
3.2 Data and participants
Individual item-level responses to released items from the NAEP 2007 grade 8 national mathematics assessment were used for the analyses. We selected 2007 as the year for analyses over other years due to a large number of released booklets and released items as well as the number of participants in the different subgroups of interest (i.e., three accommodation subgroups and a nonaccommodated subgroup) for this year. For the analyses, we used all available data from the accommodated groups of interest. However, given that NAEP is designed such that each student is presented with only one booklet, the number of accommodated students, all of which represent less than 10% of the total examinee population, is naturally very low. For that reason, we selected only the most populated accommodation groups (approximate n = 300 for the extended time subgroup and approximate n = 100 each for the read aloud and the small groups subgroups) as well as a random sample of nonaccommodated students (approximate n = 3400). Accommodated students with only one accommodation are included—meaning, those students who NAEP designated to have more than one accommodation are not included in the analysis. The sample sizes are combined from across the four booklets we utilized in the study.
Items used for the analyses included three released blocks of items [#7 (n = 16), #9 (n = 18), and #11 (n = 19)], which spiraled within four booklets, for a total of 53 released items. Across these three blocks, the number of items in each content area was as the following: #7 (four numbers and operations (N&O), four algebra (ALG), two data analysis, statistics, and probability (DAS), four geometry (GEO), and two measurement (MEA). Block #9 contained six N&O, four ALG, four DAS, three GEO, and one MEA item. Finally, block #11 contained five N&O, five ALG, three DAS, three GEO, and three MEA items. Analyses were conducted at the booklet level, which is the level at which examinees interact with the assessment. Additionally, focus was on the released items, as the second research question requires access to the actual items for creating the Q-matrix.
There are three types of items on the NAEP mathematics assessment: multiple choice (MC), short constructed response (SCR), and extended constructed response (ECR). MC items are scored as dichotomous, while the constructed response items are scored either as dichotomous or polytomous. Out of 53 items, 38 items were MC and scored as dichotomous, 14 items were SCR, of which 8 were scored as dichotomous and 6 were scored as polytomous, and the only ECR item was scored polytomously on a four-point scale. These items were subjected to DIF analyses using GLR, which is briefly described next.
3.3 Generalized logistic regression
We conducted DIF analyses utilizing the difGenLogistic function within the difR package (Magis, Béland, and Raîche 2013) in R (R Core Development Team 2015). This approach is only suitable for dichotomous data. Therefore, we dichotomized seven items which were originally scored as polytomous so that the most balance was achieved with regard to the correct–incorrect categories (per Svetina and Levy 2014). GLR was used to test both uniform and nonuniform DIF, and a likelihood ratio test was used to test the DIF statistic.Footnote 2 Item purification was used for the analysis as means to minimize potential instability in total scores during DIF analysis. Namely, item purification is a process that reduces the impact of potential DIF items in the analysis. GLR assumes that all remaining items serve as anchor items (or a matching set). However, some items may be problematic, and thus potentially may reduce reliability of that anchor set. The purification process works in such a way that DIF items are removed from the anchor set in DIF computation, and DIF analysis is rerun based on this modified matching set. The step is repeated until two consecutive iterations return the same classification of items—that is, flags items as either DIF or DIF-free (see, Clauser and Mazor 1998). Readers interested in further technical details of GLR might be interested in Magis et al. (2011).
3.4 Building the Q-matrix and mastery attribute probabilities
Tatsuoka and her colleagues developed (and revised) a list of attributes in order to explain performance on mathematics items from the Trends in International Mathematics and Science Study—Revised for eighth grade (Tatsuoka, Corter, and Tatsuoka 2004). A total of 27 attributes fell into three general categories, including content-, process-, and skill (item-type) attributes. Given similarities in both content and populations between our study and those used by Tatsuoka et al., we used this list of attributes as the base for the Q-matrix development. Two advanced doctoral students in mathematics education at a large Midwestern university (one of whom worked at the State Department of Education as a content expert, and both of whom had extensive item writing experience) independently coded 53 released items using the identified attributes and skills suggested by Tatsuoka and her colleagues. Once coders individually coded each item across the attributes, iterative refinement was performed, and a consensus was reached on the Q-matrix used in the analysis. Based on the studied items, 25 attributes were retained in building the initial Q-matrix.Footnote 3 In obtaining mastery attribute probabilities, we employed the RUM model assuming a complete Q-matrix—the reduced RUM (i.e., RRUM).
3.5 Analyses
In order to address the first research question (examining the effect of accommodations on NAEP Mathematics), we conducted DIF analyses using GLR methods for the 53 released items on the 2007 mathematics assessment. As previously stated, the groups of interest included nonaccommodated (the reference group), accommodated with extra time, accommodated with read aloud, and accommodated in small groups. Four separate DIF analyses were conducted (one for each released booklet), and proportions of items flagged as DIF were reported.
To address the second research question (examination of item demands as potential sources of DIF), we fit a RUM model to each booklet separately using the Arpeggio suite (Bolt et al. 2008) for the reference and three focal groups. Students’ posterior probabilities of mastery of specific skills were obtained by fitting the cognitive model, and their classification of mastery or non-mastery was determined by applying a cutoff point of 0.50 (de la Torre 2009, p. 175). Once each booklet was examined separately, we combined the attribute mastery probability information, as examinees were assumed independent. Using this combined dataset, skill profiles of students were further compared across different accommodation groups within the analysis of variance (ANOVA) framework and using the Bonferroni procedure to adjust the alpha levels across the tests. In addition, patterns of skills for individual items were studied across the items identified as DIF for the studied groups. Analogous to ANOVA, we conducted separate multivariate ANOVAs (MANOVAs) for each item, where individual hypothesized skills served as dependent variables. We also examined patterns visually and illustrated main patterns for selected items.
4 Results
Results are presented in two main sections, each corresponding to the goals of the study. We first present the results based on the DIF analyses. We then present the results from fitting the RUM model, including the model fit evaluation, individual skill-level results, and item-level combined skills results.
4.1 Part I: DIF results
As reported in Table 1, nine items were identified when testing for uniform DIF, 14 items were flagged as containing nonuniform DIF, and two items were flagged when testing for both types of DIF. Items identified as DIF differed in their characteristics with respect to their content areas, complexity levels, item type, and classical difficulty as well as in the number of skills associated with them. As noted in Panel (a), almost half of the nine uniform DIF items came from the content area of algebra (n = 4). Among the remaining five uniform DIF items, two items belonged to the measurement content area, and one item each belonged to data analysis, statistics, and probability, geometry, and numbers and operations. All uniform DIF items were either low or moderate in complexity, and all but one were MC type items scored dichotomously by NAEP. One item flagged with uniform DIF was originally scored on a four-point scale, but (like other constructed response items) was dichotomized for the purpose of analysis.
In terms of item difficulty, reported as percent correct, individual items tended to vary little across the booklets.Footnote 4 The difference in percent correct across the booklets was seven points or fewer for any one item. For example, item M143601 (first row in Panel (a) of Table 1) would be considered an “easy” item, and the percent correct for this item varied by no more than two points (i.e., in booklet 145, percent correct was 79, while in booklets 110 and 150, it was 81). These small differences in percent correct across booklets would suggest that the booklet (and, hence, the relative position of the item) did not have much impact on the difficulty of the DIF item. In terms of the actual values of the percent correct, it was observed that a somewhat even distribution of “easy,” “moderate,” and “difficult” items were flagged as having uniform DIF, where we use values around 0.50 to indicate moderate difficulty, values closer to 0 and 1 to represent difficult and easy items, respectively. Lastly, it was observed that the number of skills associated with the nine uniform DIF items ranged greatly across the items, where an item required anywhere between two and nine attributes for successful completion.
Panel (b) in Table 1 shows the two items flagged when testing for both uniform and nonuniform DIF. Both of these items were associated with the data analysis, statistics, and probability content area, and both were of moderate complexity. The short constructed response item identified in Panel (b) was originally on a three-point scale. This item was moderate in difficulty, and it was associated with mastery of six skills. The MC item was a difficult item, with a low percent correct across booklets (i.e., percent correct was no more than 20 across booklets), and this item was associated with successful mastery of four skills.
Lastly, Panel (c) in Table 1 reports information about the fourteen items identified as displaying nonuniform DIF. Among these, over 70% of the items belonged to either the number properties and operations (n = 6) or algebra (n = 4) content areas. The vast majority of the items were low in complexity (n = 10), and all, except two items, were dichotomously scored by NAEP.Footnote 5 Unlike uniform DIF items, where there seemed to be more balance across items in terms of difficulty, nonuniform DIF items tended to be moderate to difficult, with only two items that one might consider easy. Individual items, however, tended to vary little in percent correct across the booklets, as was also found among the items flagged when testing for uniform DIF or for both uniform and nonuniform DIF. The difference in percent correct across the booklets for nonuniform items was five points or fewer for any one item. Similar to the uniform DIF items, nonuniform DIF items also tended to have a range in the number of skills associated with any one item, with an average of five skills per item, a minimum of two skills, and a maximum of nine hypothesized skills.
In addition to the statistical identification of items with DIF, GLR reports effect sizes for the problematic items. Three specific effect sizes are provided: Nagelkerte R 2, Zumbo and Thomas (Z/T) effect size scale, and Jodoign and Gierl’s (J/G) effect size scale. In the current analyses, all DIF (and DIF-free) items exhibited very small DIF as reported by Z/T and J/G effect size measures, labeling all items as “A” effect size (“A” code means negligible effect size). Further, effect size for all DIF items based on Nagelkerte R 2 was relatively small, ranging from 0.0071 to 0.0237, with an average value of 0.0127 (see the last column in Table 1 for average effect size values). As expected, in unreported results, we observed that DIF-free items yielded even smaller Nagelkerte R 2 values, ranging from less than 0.001 to 0.014, with an average value of 0.004. In conclusion, all three effect sizes suggested that DIF found in the items was small and negligible in practical terms.
4.2 Part II: RUM results
4.2.1 Fit of the model
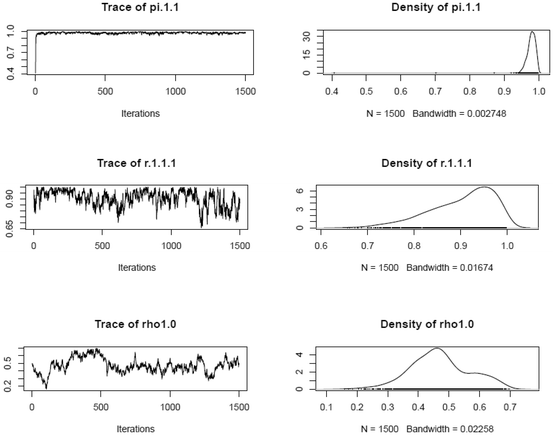
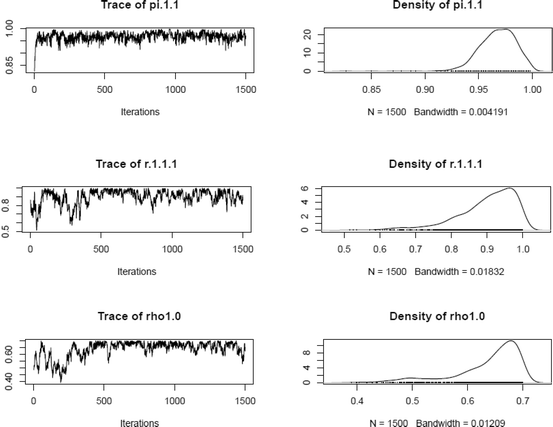
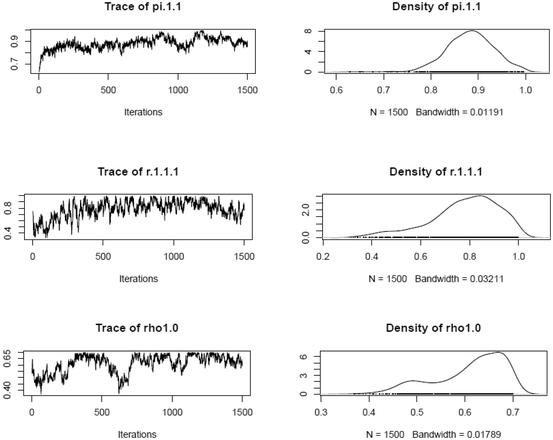
Prior to turning our focus to the results from the RUM analyses, we report on the model fit of the RUM. RUM analyses were run using Markov chain Monte Carlo procedures via Arpeggio software (Bolt et al. 2008). We evaluated data-model fit in the following ways. For each analysis, one chain of 30,000 iterations was run, where 17,000 iterations were used for the burn-in. The remaining 13,000 iterations (draws) were thinned by 20 and were pooled to yield 1500 draws from the posterior distribution for use for data-model fit. Following Hartz and Roussos (2008), Henson et al. (2005), and Roussos et al. (2007), model fit was examined by: (a) visually evaluating thinned chain plots, estimated posterior distributions, and autocorrelations of the chain estimates; (b) checking item mastery statistics; and (c) comparing observed and model implied scores for both persons and items. Results of the aforementioned procedures showed that analyses of all four booklets had acceptable model fit (see “Appendix 1” for more detail).
As noted previously, we examined results from the RUM analyses at two levels. First, we examined individual skill-level results, where we focused on the mastery attribute probabilities for each skill across the groups. Next, we examined combined skills at an item level to gain insight about the patterns of skills across the item.
4.2.2 Attribute mastery probabilities based on the RUM model
Items that were flagged as DIF involved 24 attributes, each of which was tested separately for group differences. Table 2 shows descriptive statistics for the attribute mastery probabilities across the four groups as well as the results from the ANOVA runs. As can be seen, any one attribute was elicited by different numbers of items. Five attributes (data, probability, and basic statistics [C5], solution search [P6], visual figures and graphs [P7], unit conversion [S1], and pattern recognition [S6]) were present in a single DIF item, while two attributes (computational application [P2] and use of figures, tables, charts, and graphs [S3]) were present in 12 out of 25 DIF items.
Across all 24 attributes, the nonaccommodated group had the highest mean attribute probabilities (M nonaccomm = 0.64, SDnonaccomm = 0.12), while the three accommodated groups had somewhat similar distributions (with lower means) of the attribute mastery probabilities (M extra time = 0.41, SDextra time = 0.10; M read aloud = 0.39, SDread aloud = 0.11; M small groups = 0.41, SDsmall groups = 0.11). The attribute with the highest average mastery probability for the nonaccommodated group, at 0.80, was the open-ended items attribute (S10), while the three focal groups were most successful on the unit conversion (S1) attribute, with 0.59 average mastery probabilities. In the nonaccommodated group, the attribute with the lowest mean attribute mastery, at 0.42, was the two-dimensional geometry basic concepts (C4) attribute, while for the three focal groups, elementary algebra basic concepts (C3) yielded the lowest average mastery probabilities at 0.21, 0.12, and 0.18 for the accommodated with extra time, with read aloud, and with small groups focal groups, respectively.
Unsurprisingly, one-way ANOVAs were all statistically significant at the 0.001 level, suggesting statistical differences among the groups’ mastery attribute probabilities. In examining pairwise comparisons among the groups across all attributes, statistical differences were found among the reference and focal groups, indexed as 1, 2, and 3 in the “pairwise” column in Table 2. In addition, a statistical difference was found between accommodated groups across three attributes, all of which were categorized as content attributes. Indexed in the “pairwise” column as 4, pairwise differences between the extra time and read aloud accommodated groups were found for two attributes—elementary algebra basic concepts (C3) and data, probability, and basic statistics (C5). Indexed in the “pairwise” column as 5, pairwise differences between the small group and read aloud accommodated groups were found on three attributes, including the previously mentioned C3 and C5 attributes as well as the measuring and estimating (C6) attribute. Despite these differences, we note that all four groups performed the most similar to each other on quantitative reading (P10) and logical reasoning (P5) skills, meaning that the relative difference in average attribute mastery probabilities between the reference group and focal groups was smallest for these two skills.
In addition to examining the average attribute probabilities for the examinees, we examined the proportion of examinees who mastered each of the skills associated with the items that were flagged as DIF. As mentioned in the Sect. 3, we used a 0.50 cutoff value to determine whether an examinee mastered a particular attribute (per de la Torre 2009). As Table 3 shows, the proportion of examinees who mastered each of the attributes varied across the groups, with the nonaccommodated examinees tending to master attributes in larger proportions. In addition, different groups had different proportions of mastery across the attributes. For example, the unit conversion (S1) attribute was mastered by 89% of nonaccommodated students, while less than 50% of nonaccommodated examinees mastered four of the attributes (fractions and decimals [C2], elementary algebra [C3], two-dimensional geometry [C4], and logical reasoning [P5]). For the accommodated groups, the proportion of examinees that mastered any one attribute ranged from 0.10 to 0.62. In only five cases, did the proportion of examinees who mastered a particular attribute equal or exceed 0.50 for any of the accommodated groups. Namely, quantitative reading (P10), unit conversion (S1), evaluate and verify options (S5), open-ended items (S10) and word problems (S11) were mastered in the largest proportions by the members of accommodated groups. With the exception of P10, the attributes where at least 50% of the examinees in at least one of the accommodated groups achieved mastery were also mastered at high rates in the nonaccommodated group (0.79–0.89).
As with the nonaccommodated group, the highest proportion of mastery for each of the accommodated groups was found on the unit conversion (S1) attribute, where the proportion of mastery for the extra time, read aloud, and small groups accommodated examinees was 0.62, 0.61, and 0.59, respectively. Among the three accommodated groups, the small groups accommodation group tended to have the highest mastery proportion for the largest number of attributes, although it yielded the lowest mastery proportion for the judgmental application (P3) and quantitative reading (P10) skills. With respect to similarities, we noted that the most similar proportion of examinees mastering any of the attributes across the groups came from logical reasoning (P5) and quantitative reading (P10) (see Table 3). These were the same two attributes found to have the most similar attribute mastery probability means (in Table 2).
4.2.3 Item-level analysis of combined skills
In addition to the above results, we examined the patterns of the skills required by an item visually and statistically. Analogous to the above ANOVA analysis, we conducted a series of one-way multivariate ANOVAs (MANOVAs) for each item separately (see Table 4). For each test, we treated the grouping variable (accommodation status/type) as independent and the skills associated with each item as dependent variables. For example, based on the Q-matrix, item M143601 was hypothesized to elicit mastery of four skills (C1, C3, P2, and P4). The mastery probabilities for these skills were then used as dependent variables in MANOVA. Given that each item elicited different types and different numbers of skills, the dependent variables changed across the MANOVA tests. At the statistical level, MANOVA results were significant after controlling for Type I error rate. However, as suggested under partial η 2, effect sizes were trivial and small all items. In other words, there was not much of a difference in terms of the MANOVA analysis for different types of items (i.e., those classified as uniform, nonuniform, or both uniform and nonuniform DIF).
We also examined patterns of mastery skills at the item level visually. Figure 1 shows three items’ mastery probabilities as an illustration of relative strengths and weaknesses of students across the groups. Each graph in the figure represents one item and its modeled attributes from the Q-matrix for each of the groups (nonaccommodated group is marked with a star, accommodated with extra time is marked with a square, small groups accommodation is marked with a triangle, and read aloud group is marked with a circle). Origin of the graph in the two-dimensional space is at (0, 0) and the distance between the origin and the corresponding data point represents the magnitude of the mastery status on that respective skill and group.

Visual illustration of selected items across various types of DIF
For discussion purposes, we examine the graph in Panel (a) in Fig. 1. This graph illustrates performance of examinees on nine skills associated with item M144901. Examining skills 1 (C1) and 3 (C3), we saw that the length of the line from the origin to the end point on skill 1 was longer than for skill 3 for nonaccommodated group (mean masteries for the two skills were 0.77 and 0.43, respectively). Similar patterns of attribute performances were noted within each group, albeit mastery means were consistently lower across all attributes in accommodated groups (as observed by shorter lines in the graph). We also observed similar patterns within each group; with accommodated groups having lower mastery means across the skills, resulting in shorter distances between the origin and respective data points. Further, we observed that performance on some skills varied more than on other skills. Specifically, we noted that performance on skill 3 (C3) was more varied across the groups than performance on skill 11 (P5), where the lines were more similar in length. This suggested that some skills within items tended to be smaller proportionally than for others. For skill 3, nonaccommodated mean mastery was 0.43, which was about twice as large as for any of the three accommodated groups, whose mastery probability means ranged from 0.12 to 0.21, resulting in a ratio of about 2. For skill 11 (P5), on the other hand, the mastery probability means among the groups were 0.45 (nonaccommodated) and 0.30–0.34 for accommodated groups, yielding a ratio of no larger than 1.3. Generally, similar patterns can be observed across all items, regardless of whether an item was found to be problematic due to uniform, nonuniform, or uniform and nonuniform DIF. The accompanied, complete, mastery probability means for each group across attributes for each item can be located in Appendix 2.
5 Discussion and summary
The current study examined the effect of accommodations assigned to SWD on the NAEP mathematics assessment. First, DIF analyses were conducted to investigate which items were problematic with respect to accommodation by examining DIF using a GLR method. Identification of DIF items was only the first step in our investigation. We aimed to understand better the patterns of mastery of the underlying attributes and skills on the problematic items. We found that the nonaccommodated group yielded higher mastery probabilities as well as higher proportions of students with mastery across all attributes. Patterns for the three accommodated groups tended to be similar, although differences were found in terms of the proportions of examinees mastering different attributes.
Our goal in utilizing a CDM was to illustrate how fine-grained information obtained from the CDM may shed light onto the differential functioning of items on an exam that members from different subpopulations may encounter. We found that members from accommodated and nonaccommodated groups had different profiles of attribute mastery. Examining attribute masteries may become useful when thinking about item creation for assessments. For example, in the current work, we found that, on average, the difference in rates of mastering an attribute between accommodated and nonaccommodated student populations was about 33%, while some attributes produced even larger proportions of mastery at 44% (measuring and estimating length, time, temperature, etc. [C6]). Knowing such information may be useful in the item writing process as items that involve attributes and skills that yield such large discrepancies may need to be revised.
Further, although NAEP was not built to provide diagnostic information (see our discussion on limitations below), we believe that assessments with diagnostic features need to be accurate and formative such that students’ academic strength and weakness are specified clearly, not only for the majority of students, but also for other populations, including SWD. Tests that do not address this issue may have only limited utility in education, given recent increased demands on the type of information tests should provide. Evidence obtained from DIF and CDMs analyses here may suggest that different types of skills are more representative of students from different backgrounds than are others. Additionally, such fine-grained information may be useful for instructional guidance, in that, for example, providing teachers with cognitive profiles of students may make it possible to adopt more specific instruction methods based on the feedback received from the assessment.
Our study has several limitations. Given our interest in different accommodation types, even by including every examinee with the studied types of accommodation, our sample sizes were small, especially for the small group accommodated group. To our knowledge, the effect of the unequal sample sizes across groups in GLR is unknown, and could potentially be studied methodologically in the future. Moreover, grouping all students regardless of the type of accommodations they received would increase the sample size; however, it would also imply that all accommodations have the same effect. This seemed like a large assumption to make and would distract from our current focus. In addition, several items which were originally scored (by NAEP) on a three- or four-point scale were dichotomized prior to analysis in order to take advantage of the GLR method that accommodates more than two groups but only allows for dichotomous data. The impact of such dichotomization, although documented previously in the literature, is largely unknown. While we dichotomized only a handful of items, we cannot know the full impact these choices had on the analyses. Further research in this area is needed. We also recognize that NAEP was not built to provide cognitive diagnostic information, and although we used it to illustrate the potential of CDMs in a similar vein to what others have done, we recognize the limitations of retrofitting.
Future research should also examine relationships between the skills and the types of accommodations. For example, read aloud accommodations could potentially invalidate the interpretation of scores for students if the intention is to measure the quantitative reading skill. However, if the quantitative reading skill was not relevant to the construct of interest, then the skill would not be included in the Q-matrix for that accommodation group. This approach would require an analyst to construct separate Q-matrices for each studied group and to make some adjustment in interpretation for the groups as a whole. Making direct comparison would not be possible as some skills would be present in some groups but not others; thus, some alternative interpretation might be necessary. A potential approach to remedy this issue could be to examine two groups at a time; for example, the Q-matrix for the nonaccommodated group, considered complete, could be compared with the Q-matrix for a particular accommodated group, considered a subset of the nonaccommodated group’s Q-matrix.
Another potential future direction would be to study DIF at the mastery skill profile levels, such as through differential skill functioning (e.g., per Milewski and Baron 2002). In the current study, in particular when examining items visually, we identified that certain skills tended to be mastered less successfully across all groups (e.g., skills such as elementary algebra [S3] and two-dimensional geometry [S4]) and that their ratios of success (nonaccommodated group vs accommodated groups) were larger than those for other skills. This may potentially warrant a consideration as to how the actual skills and their representations across the items contribute to DIF. Our current approach did not allow for such claims to be made directly; however, understanding the underlying “causes” for differences is needed in order to inform more closely assessment policy.
Lastly, we want to acknowledge that for the purpose of our study, we assumed that SWD who received accommodations were appropriately assigned their respective accommodations. The issue of the appropriate designation and assignment of accommodations is much larger than our current task, but is an important one. Hence, we recognize the existing debate in the special education literature with respect to the presumption that SWD are properly specified and that testing accommodations are valid and defensible (e.g., Ketterlin-Geller et al. 2007a, b).
Despite these limitations, our study presents an alternate approach to studying DIF. Lack of understanding with regard to why DIF occurs in spite of careful item writing proves to be one of the current challenges in the field. By examining the fine-grained aspects of items, we might be able to detect whether certain processes are contributors to DIF and whether item attributes make similar demands of examinees from different groups. To obtain a fuller picture, conducting cognitive labs with different populations during field testing of items with the intention to find sources of DIF may be beneficial for both guiding instruction by recognizing different proficiencies among different groups and for broader aspects of assessment design.
Notes
The Journal of Educational Measurement (2007, no. 4) had a special issue on the IRT-based CDMs and related methods.
The difGenLogistic function allows for studying uniform, nonuniform, or both types of DIF. It investigates one item at a time and treats the rest of the items as DIF-free, unless item purification is used. The generalized logistic regression DIF model, as presented by Magis et al. (2011), has the following form: \( {\text{logit}}\left( {\pi_{ig} } \right) = \alpha + \beta S_{i} + \alpha_{g} + \beta_{g} S_{i} , \) where \( \pi_{ig} \) is the probability of examinee i from group g correctly responding to an item, logit is the natural log of the odds of correctly answering an item, \( \alpha \) and \( \beta \) are common intercept and slope parameters (i.e., for all groups), \( \alpha_{g} \) and \( \beta_{g} \) are group-specific intercept and slope parameters, and \( S_{i} \) is the total test score for examinee i (a matching variable and a proxy for the ability level of the examinee). An item is said to contain DIF if the probability \( \pi_{ig} \) varies across the groups of examinees, meaning that there is an interaction between group membership and the item response. When all group-specific parameters equal zero, we would conclude the absence of DIF. Specifically, the following three hypotheses can be tested with regard to DIF using the difGenLogistic function: (a) \( H_{0} : \alpha_{1} = \cdots = \alpha_{F} |\beta_{1} = \cdots = \beta_{F} = 0 \), when testing for uniform DIF; (b) \( H_{0} : \beta_{1} = \cdots = \beta_{F} = 0 \), when testing for nonuniform DIF, and (c) \( H_{0} : \alpha_{1} = \cdots = \alpha_{F} = \beta_{1} = \cdots = \beta_{F} = 0 \), when testing for both types of DIF. Using maximum likelihood, the null hypotheses are tested using different methods, such as the Wald test or, as in our study, the likelihood ratio test.
We refer here to the initial Q-matrix used in the RUM analysis. As we explain later, our focus shifts to the DIF items that elicited 24 attributes from the list of the original 25 skills. One processing attribute (applying and evaluating mathematical correctness) was coded as present in the 53 examined items but was not found to be associated with the DIF identified items.
Proportion (percent) correct in NAEP represents the proportion of all US students that would have gotten an item correct on the NAEP assessment had all students received an opportunity to respond to the item. Due to the multistage and stratified random sampling design used by NAEP, proportion correct values and their standard errors are calculated using student sampling weights via the jackknife repeated replication procedure (Brown et al. 2015). Readers are directed to the NAEP Primer (Allen et al. 2001) and other published technical reports (e.g., Beaton et al. 2011) for technical details.
Three SCR items in Panel (c) in Table 1 were scored dichotomously by NAEP, while the remaining two SCR items were scored on three- or four-point scales. In the analysis, all items were dichotomized by researchers.
References
Allen NL, Donoghue JR, Schoeps TL (2001) NAEP technical report. National Center for Education Statistics, Washington, DC
American Psychological Association, National Council on Measurement in Education, American Educational Research Association (1999) Standards for educational and psychological testing. American Educational Research Association, Washington, DC
American Psychological Association, National Council on Measurement in Education, American Educational Research Association (2014) Standards for educational and psychological testing. American Educational Research Association, Washington, DC
Beaton A, Rogers A, Gonzalez E, Hanly M, Kolstad A, Rust K et al (2011) NAEP primer. National Center for Education Statistics, Washington, DC
Bolt SE, Ysseldyke J (2008) Accommodating students with disabilities in large-scale testing: a comparison of differential item functioning (DIF) identified across disability types. J Psychoeduc Assessm 26(2):121–138
Bolt D, Chen H, DiBello LV, Hartz SM, Henson R, Roussos LA, Stout WF, Templin J (2008) The Arpeggio suite: Software for cognitive skills diagnostic assessment [Computer software and manual]. Assessment Systems, St. Paul
Brown N, Dai S, Svetina D (2015) Analyzing NAEP data at the item level. In: Kloosterman P, Mohr D, Walcott C (eds) What mathematics do students know and how is that knowledge changing? Evidence from the National Assessment of Educational Progress. Information Age Publishing, North Carolina
Buzick, H., Stone, E. (2011). Recommendations for conducting differential item functioning (DIF) analyses for students with disabilities based on previous DIF studies. Research Report. ETS RR–11–34. Educational Testing Service, Princeton
Buzick H, Stone E (2014) A meta-analysis of research on the read aloud accommodation. Educ Meas Issues Pract 33(3):17–30
Camilli G (2006) Test fairness. In: Brennan RL (ed) Educational measurement, 4th edn. American Council on Education/Praeger, Westport, pp 221–256
Clauser BE, Mazor KM (1998) Using statistical procedures to identify differentially functioning test items. Educ Meas Issues Pract 17:31–44. doi:10.1111/j.1745-3992.1998.tb00619.x
Cohen AS, Gregg N, Deng M (2005) The role of extended time and item content on a high-stakes mathematics test. Learn Disabilit Res Pract 20(4):225–233
Cook L, Eignor D, Sawaki Y, Steinberg J, Cline F (2010) Using factor analysis to investigate accommodations used by students with disabilities on an English—language arts assessment. Appl Measur Educ 23(2):187–208
Cormier DC, Altman JR, Shyyan V, Thurlow ML (2010) A summary of the research on the effects of test accommodations: 2007–2008 (Technical Report 56). University of Minnesota, National Center on Educational Outcomes, Minneapolis
de la Torre J (2009) A cognitive diagnosis model for cognitively based multiple-choice options. Appl Psychol Meas 33(3):163–183
DiBello LV, Roussos L, Stout WF (2007) Review of cognitively diagnostic assessment and a summary of psychometric models. In: Rao CR, Sinharay S (eds) Handbook of statistics, vol 26. Amsterdam, Elsevier, pp 979–1030
Engelhard G (2009) Using item response theory and model–data fit to conceptualize differential item and person functioning for students with disabilities. Educ Psychol Measur 69(4):585–602. doi:10.1177/0013164408323240
Ferne T, Rupp AA (2007) A synthesis of 15 years of research on DIF in language testing: methodological advances, challenges, and recommendations. Lang Assess Q 4(2):113–148
Fu J, Li Y (2007) Cognitively diagnostic psychometric models: an integrative review. In: Paper presented at the annual meeting of the National Council on Measurement in Education, Chicago, IL
Hambleton R, Rogers H (1989) Detecting potentially biased test items: comparison of IRT area and Mantel-Haenszel methods. Appl Measur Educ 2(4):313–334
Hartz SM (2002) A Bayesian framework for the unified model for assessing cognitive abilities: blending theory with practicality (Unpublished doctoral dissertation). University of Illinois at Urbana, Champaign, IL
Hartz SM, Roussos LA (2008) The fusion model for skills diagnosis: blending theory with practice. Research Report. ETS RR–08–71. Educational Testing Service, Princeton
Henson RA, Roussos L, Templin JL (2005) Fusion model “fit” indices. Unpublished ETS Project Report, Princeton, NJ
Holland PW, Wainer H (eds) (1993) Differential item functioning. Routledge, Hillsdale
Huynh H, Meyer JP, Gallant DJ (2004) Comparability of student performance between regular and oral administrations for a high-stakes mathematics test. Appl Measur Educ 17(1):39–57. doi:10.1207/s15324818ame1701_3
Johnstone CJ, Altman J, Thurlow ML, Thompson SJ (2006) A summary of research on the effects of test accommodations: 2002 through 2004 (Technical Report 45). Minneapolis, MN: University of Minnesota, National Center on Educational Outcomes. http://education.umn.edu/NCEO/OnlinePubs/Tech45/. Accessed 1 Mar 2015
Ketterlin-Geller LR, Alonzo J, Braun-Monegan J, Tindal G (2007a) Recommendations for accommodations: implications of (in)consistency. Remedial Spec Educ 28(4):194–206
Ketterlin-Geller LR, Yovanoff P, Tindal G (2007b) Developing a new paradigm for conducting research on accommodations in mathematics testing. Except Child 73(3):331–347
Kloosterman P (2004) Interpreting the 2000 NAEP Mathematics data: issues and monograph overview. In: Kloosterman P, Lester F, Jr. (eds) Results and interpretations of the 1990–2000 mathematics assessments of the National Assessment of Educational Progress. National Council of Teachers of Mathematics, Reston, pp 3–32
Leighton J, Gierl MJ (eds) (2007) Cognitive diagnostic assessment for education: Theory and applications. Cambridge University Press, New York
Li H (2011) A cognitive diagnostic analysis of the MELAB reading test. Spaan Fellow 9:17–46
Li H (2014) The effects of read aloud accommodations for students with and without disabilities: a meta-analysis. Educ Meas Issues Pract 33(3):3–16
Lord FM (1980) Applications of item response theory to practical testing problems. Lawrence Erlbaum Associates Inc, Hillsdale
Magis D, Raîche G, Béland S, Gérard P (2011) A generalized logistic regression procedure to detect differential item functioning among multiple groups. Int J Test 11(4):365–386
Magis D, Béland S, Raîche G (2013) difR: Collection of methods to detect dichotomous differential item functioning (DIF) in psychometrics. R package version 4.4
Mellenbergh GJ (1982) Contingency table models for assessing item bias. J Educ Behav Stat 7(2):105–118. doi:10.3102/10769986007002105
Meredith W (1993) Measurement invariance, factor analysis and factorial invariance. Psychometrika 58(4):525–543. doi:10.1007/BF02294825
Middleton K, Laitusis CC (2007) Examining test items for differential distractor functioning among students with learning disabilities. Research Report. ETS RR–07–43. Educational Testing Service, Princeton
Milewski GB, Baron PA (2002) Extending DIF methods to inform aggregate report on cognitive skills. In: Paper presented at the annual meeting of the National Council of Measurement in Education, New Orleans, Louisiana
NAEP. (n.d.). NAEP_Inclusion of Special–Needs Students. http://nces.ed.gov/nationsreportcard/about/inclusion.asp. Accessed 1 Mar 2015
No Child Left Behind Act of 2001, Pub. L. No. 107–110, 115 Stat. 1425. (2002)
Randall J, Engelhard G (2010) Using confirmatory factor analysis and the Rasch model to assess measurement invariance in a high stakes reading assessment. Appl Meas Educ 23(3):286–306. doi:10.1080/08957347.2010.486289
Randall J, Cheong YF, Engelhard G (2011) Using explanatory item response theory modeling to investigate context effects of differential item functioning for students with disabilities. Educ Psychol Measur 71(1):129–147
R Core Development Team (2015) R: A language and environment for statistical computing (Version 3.2.1) [Computer software]. R Foundation for Statistical Computing, Vienna, Austria. https://www.R-project.org/
Roussos LA, DiBello LV, Stout W, Hartz SM, Henson RA, Templin JL (2007) The fusion model skills diagnosis system. In: Leighton JP, Gierl MJ (eds) Cognitive diagnostic assessment for education: theory and applications. Cambridge University Press, New York, pp 275–318
Rupp AA, Templin J (2008) Unique characteristics of diagnostic classification models: a comprehensive review of the current state-of-the-art. Meas Interdiscip Res Perspect 6:219–262
Rupp AA, Templin J, Henson RA (2010) Diagnostic measurement: theory, methods, and applications. Guilford, New York
Scarpati SE, Wells CS, Lewis C, Jirka S (2011) Accommodations and item-level analyses using mixture differential item functioning models. J Spec Educ 45(1):54–62. doi:10.1177/0022466909350224
Steinberg J, Cline F, Sawaki Y (2011) Examining the factor structure of a state standardsbased science assessment for students with learning disabilities Research Report. ETS RR–11–38. Educational Testing Service, Princeton
Stone E, Cook L, Laitusis CC, Cline F (2010) Using differential item functioning to investigate the impact of testing accommodations on an English—language arts assessment for students who are blind or visually impaired. Appl Meas Educ 23(2):132–152. doi:10.1080/08957341003673773
Svetina D, Levy R (2014) A framework for dimensionality assessment for multidimensional item response models. Educ Assess 19(1):35–57
Svetina D, Wang X (2014) Examination of different methods to test for invariance in accommodations when mixture data formats exist: Illustration of the NAEP. In: Paper presented at the annual meeting of American Educational Research Association, Philadelphia, PA
Swaminathan H, Rogers HJ (1990) Detecting differential item functioning using logistic regression procedures. J Educ Meas 27:361–370
Tatsuoka KK, Corter JE, Tatsuoka C (2004) Patterns of diagnosed mathematical content and process skills in TIMSS–R across a sample of 20 countries. Am Educ Res J 41(4):901–926
U.S. Department of Education (2007) Title I—Improving the academic achievement of the disadvantaged; Individuals with Disabilities Education Act (IDEA): Final rule [34 CFR Parts 200 and 300]. Federal Register, 72(67). http://ed.gov/legislation/FedRegister/finrule/2007–2/040907a.pdf. Accessed 1 Mar 2015
Xu X, von Davier M (2006) Applying the general diagnostic model to data from large scale educational surveys (ETS Research Rep. No. RR–06–08). ETS, Princeton
Zenisky AL, Sireci SG (2007) A summary of the research on the effects of test accommodations: 2005–2006 (Technical Report 47). University of Minnesota, National Center on Educational Outcomes, Minneapolis
Zenisky A, Hambleton R, Robin F (2004) DIF detection and interpretation in large-scale science assessments: informing item writing practices. Educ Assess 9:61–78
Author information
Authors and Affiliations
Corresponding author
Ethics declarations
Conflict of interest
The authors declare that they have no conflict of interest.
Additional information
Communicated by Russell George Almond.
Appendices
Appendix 1: RUM model fit summary
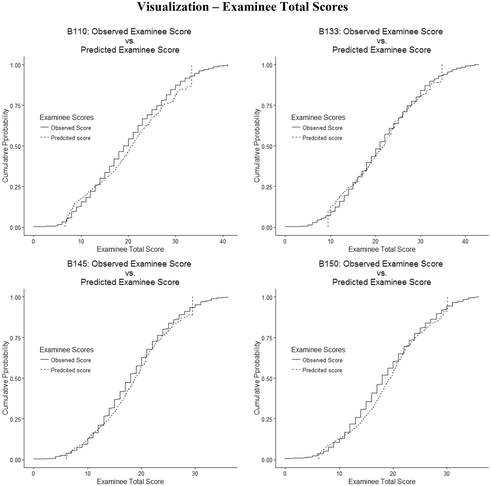
All RUM analyses were run using Markov chain Monte Carlo procedures via Arpeggio software. For each analysis, one chain of 13,000 iterations was run, after the burn-in phase of 17,000 iterations. The considered iterations were thinned by 20 and the remaining iterations were pooled to yield 1500 draws from the posterior distribution for use of model fit. Following Hartz and Roussos (2008), Henson et al. (2005), and Roussos et al. (2007), fusion model fit was examined in three ways, by: (1) visual evaluation of thinned chain plots, estimated posterior distributions, and autocorrelations of the chain estimates; (2) checking item mastery statistics; and (3) comparing observed scores with fusion model predicted scores at both item and examinee levels. Results of the aforementioned procedures showed that analyses of all four booklets have acceptable model fit. Selected plots are included below.
-
1.
Visual examination of selected posterior distribution parameter estimates (after thinning) across booklets
-
2.
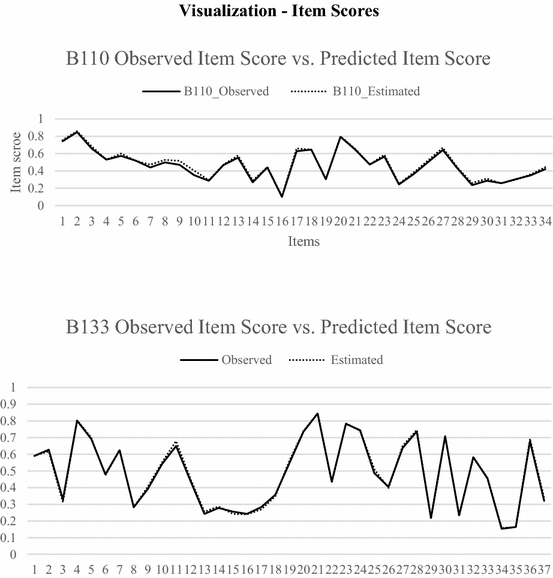
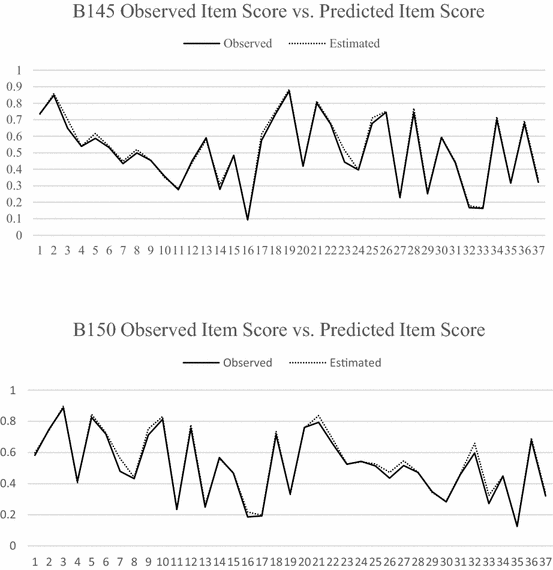
Bias and RMSEs between observed scores and model-estimated scores for both items and examinees


Summary statistics
Booklet | Bias | RMSE | Correlation | |
|---|---|---|---|---|
Summary of fusion model statistics | ||||
Examinee level | B110 | −0.5857 | 2.4847 | 0.9607 |
B133 | −0.1128 | 2.3851 | 0.9597 | |
B145 | −0.4380 | 1.9907 | 0.9603 | |
B150 | −0.5885 | 2.0509 | 0.9622 | |
Item level | B110 | −0.0154 | 0.0209 | 0.9967 |
B133 | −0.0027 | 0.0108 | 0.9987 | |
B145 | −0.0118 | 0.0206 | 0.9967 | |
B150 | −0.0153 | 0.0256 | 0.9951 | |
-
3.
Observed and model implied scores for both persons and items (similarity between the lines in the plots below suggest adequate model fit).


Appendix 2
This table specifies which attributes are associated with each item, and the performance of the various groups across these attributes. Within each item, a more complete attribute mastery for the groups can be seen
Content-based attributes | Process-based attributes | Item-type attributes |
|---|---|---|
C1 Whole numbers and integers C2 Fractions and decimals C3 Elementary algebra C4 Two-dimensional geometry C5 Data and basic statistics C6 Measuring and estimating | P1 Translate/formulate equations P2 Computation application P3 Judgmental application P4 Rule application in algebra P5 Logical reasoning P6 Solution search P7 Visual figures and graphs P9 Data management P10 Quantitative reading | S1 Unit conversion S2 Number sense S3 Figures, tables, and graphs S4 Approximation and estimation S5 Evaluate/verify options S6 Pattern recognition S7 Proportional reasoning S10 Open-ended items S11 Word problems |
Item level skill mastery attribute probability means
Item ID | Group | C1 | C2 | C3 | C4 | C5 | C6 | P1 | P2 | P3 | P4 | P5 | P6 |
|---|---|---|---|---|---|---|---|---|---|---|---|---|---|
M143601 | NonA | 0.77 | 0.43 | 0.73 | 0.65 | ||||||||
A_ET | 0.47 | 0.21 | 0.43 | 0.38 | |||||||||
A_RA | 0.43 | 0.12 | 0.42 | 0.35 | |||||||||
A_SG | 0.46 | 0.18 | 0.47 | 0.39 | |||||||||
M091701 | NonA | 0.43 | 0.73 | ||||||||||
A_ET | 0.21 | 0.43 | |||||||||||
A_RA | 0.12 | 0.42 | |||||||||||
A_SG | 0.18 | 0.47 | |||||||||||
M144901 | NonA | 0.77 | 0.43 | 0.42 | 0.54 | 0.45 | |||||||
A_ET | 0.47 | 0.21 | 0.22 | 0.31 | 0.34 | ||||||||
A_RA | 0.43 | 0.12 | 0.23 | 0.27 | 0.32 | ||||||||
A_SG | 0.46 | 0.18 | 0.24 | 0.30 | 0.30 | ||||||||
M107101 | NonA | 0.43 | 0.69 | 0.73 | 0.65 | ||||||||
A_ET | 0.21 | 0.38 | 0.43 | 0.38 | |||||||||
A_RA | 0.12 | 0.39 | 0.42 | 0.35 | |||||||||
A_SG | 0.18 | 0.43 | 0.47 | 0.39 | |||||||||
M106601 | NonA | 0.77 | 0.73 | ||||||||||
A_ET | 0.47 | 0.43 | |||||||||||
A_RA | 0.43 | 0.42 | |||||||||||
A_SG | 0.46 | 0.47 | |||||||||||
M106401 | NonA | 0.42 | |||||||||||
A_ET | 0.22 | ||||||||||||
A_RA | 0.23 | ||||||||||||
A_SG | 0.24 | ||||||||||||
M106801 | NonA | 0.77 | 0.42 | 0.73 | |||||||||
A_ET | 0.47 | 0.22 | 0.43 | ||||||||||
A_RA | 0.43 | 0.23 | 0.42 | ||||||||||
A_SG | 0.46 | 0.24 | 0.47 | ||||||||||
M144501 | NonA | 0.77 | 0.74 | 0.73 | |||||||||
A_ET | 0.47 | 0.51 | 0.43 | ||||||||||
A_RA | 0.43 | 0.47 | 0.42 | ||||||||||
A_SG | 0.46 | 0.53 | 0.47 | ||||||||||
M107601 | NonA | 0.47 | 0.73 | ||||||||||
A_ET | 0.26 | 0.43 | |||||||||||
A_RA | 0.23 | 0.42 | |||||||||||
A_SG | 0.25 | 0.47 | |||||||||||
M072901 | NonA | 0.74 | 0.45 | ||||||||||
A_ET | 0.51 | 0.34 | |||||||||||
A_RA | 0.47 | 0.32 | |||||||||||
A_SG | 0.53 | 0.30 | |||||||||||
M107201 | NonA | 0.43 | 0.45 | 0.62 | |||||||||
A_ET | 0.21 | 0.34 | 0.43 | ||||||||||
A_RA | 0.12 | 0.32 | 0.41 | ||||||||||
A_SG | 0.18 | 0.30 | 0.46 | ||||||||||
M144401 | NonA | 0.77 | 0.43 | 0.69 | 0.73 | 0.65 | |||||||
A_ET | 0.47 | 0.21 | 0.38 | 0.43 | 0.38 | ||||||||
A_RA | 0.43 | 0.12 | 0.39 | 0.42 | 0.35 | ||||||||
A_SG | 0.46 | 0.18 | 0.43 | 0.47 | 0.39 | ||||||||
M105801 | NonA | 0.42 | |||||||||||
A_ET | 0.22 | ||||||||||||
A_RA | 0.23 | ||||||||||||
A_SG | 0.24 | ||||||||||||
M106701 | NonA | 0.43 | 0.42 | 0.65 | |||||||||
A_ET | 0.21 | 0.22 | 0.38 | ||||||||||
A_RA | 0.12 | 0.23 | 0.35 | ||||||||||
A_SG | 0.18 | 0.24 | 0.39 | ||||||||||
M145001 | NonA | 0.77 | 0.43 | 0.69 | 0.54 | ||||||||
A_ET | 0.47 | 0.21 | 0.38 | 0.31 | |||||||||
A_RA | 0.43 | 0.12 | 0.39 | 0.27 | |||||||||
A_SG | 0.46 | 0.18 | 0.43 | 0.30 | |||||||||
M013131 | NonA | 0.65 | |||||||||||
A_ET | 0.43 | ||||||||||||
A_RA | 0.37 | ||||||||||||
A_SG | 0.45 | ||||||||||||
M145101 | NonA | 0.47 | 0.43 | 0.42 | 0.73 | 0.65 | |||||||
A_ET | 0.26 | 0.21 | 0.22 | 0.43 | 0.38 | ||||||||
A_RA | 0.23 | 0.12 | 0.23 | 0.42 | 0.35 | ||||||||
A_SG | 0.25 | 0.18 | 0.24 | 0.47 | 0.39 | ||||||||
M075801 | NonA | 0.77 | 0.42 | 0.73 | |||||||||
A_ET | 0.47 | 0.22 | 0.43 | ||||||||||
A_RA | 0.43 | 0.23 | 0.42 | ||||||||||
A_SG | 0.46 | 0.24 | 0.47 | ||||||||||
M106301 | NonA | 0.47 | |||||||||||
A_ET | 0.26 | ||||||||||||
A_RA | 0.23 | ||||||||||||
A_SG | 0.25 | ||||||||||||
M144001 | NonA | 0.77 | 0.45 | ||||||||||
A_ET | 0.47 | 0.34 | |||||||||||
A_RA | 0.43 | 0.32 | |||||||||||
A_SG | 0.46 | 0.30 | |||||||||||
M144201 | NonA | 0.47 | 0.73 | 0.54 | |||||||||
A_ET | 0.26 | 0.43 | 0.31 | ||||||||||
A_RA | 0.23 | 0.42 | 0.27 | ||||||||||
A_SG | 0.25 | 0.47 | 0.30 | ||||||||||
M013531 | NonA | 0.47 | |||||||||||
A_ET | 0.26 | ||||||||||||
A_RA | 0.23 | ||||||||||||
A_SG | 0.25 | ||||||||||||
M105601 | NonA | 0.77 | |||||||||||
A_ET | 0.47 | ||||||||||||
A_RA | 0.43 | ||||||||||||
A_SG | 0.46 | ||||||||||||
M105901 | NonA | 0.47 | |||||||||||
A_ET | 0.26 | ||||||||||||
A_RA | 0.23 | ||||||||||||
A_SG | 0.25 | ||||||||||||
M144301 | NonA | 0.47 | 0.43 | 0.69 | 0.73 | 0.65 | |||||||
A_ET | 0.26 | 0.21 | 0.38 | 0.43 | 0.38 | ||||||||
A_RA | 0.23 | 0.12 | 0.39 | 0.42 | 0.35 | ||||||||
A_SG | 0.25 | 0.18 | 0.43 | 0.47 | 0.39 |
Item ID | Group | P7 | P9 | P10 | S1 | S2 | S3 | S4 | S5 | S6 | S7 | S10 | S11 |
|---|---|---|---|---|---|---|---|---|---|---|---|---|---|
M143601 | NonA | ||||||||||||
A_ET | |||||||||||||
A_RA | |||||||||||||
A_SG | |||||||||||||
M091701 | NonA | ||||||||||||
A_ET | |||||||||||||
A_RA | |||||||||||||
A_SG | |||||||||||||
M144901 | NonA | 0.66 | 0.58 | 0.73 | 0.80 | ||||||||
A_ET | 0.42 | 0.29 | 0.51 | 0.54 | |||||||||
A_RA | 0.41 | 0.27 | 0.50 | 0.54 | |||||||||
A_SG | 0.43 | 0.32 | 0.51 | 0.54 | |||||||||
M107101 | NonA | ||||||||||||
A_ET | |||||||||||||
A_RA | |||||||||||||
A_SG | |||||||||||||
M106601 | NonA | 0.58 | |||||||||||
A_ET | 0.29 | ||||||||||||
A_RA | 0.27 | ||||||||||||
A_SG | 0.32 | ||||||||||||
M106401 | NonA | 0.64 | 0.58 | ||||||||||
A_ET | 0.38 | 0.29 | |||||||||||
A_RA | 0.36 | 0.27 | |||||||||||
A_SG | 0.38 | 0.32 | |||||||||||
M106801 | NonA | 0.78 | |||||||||||
A_ET | 0.52 | ||||||||||||
A_RA | 0.50 | ||||||||||||
A_SG | 0.56 | ||||||||||||
M144501 | NonA | 0.53 | 0.77 | ||||||||||
A_ET | 0.43 | 0.59 | |||||||||||
A_RA | 0.44 | 0.59 | |||||||||||
A_SG | 0.38 | 0.59 | |||||||||||
M107601 | NonA | 0.67 | |||||||||||
A_ET | 0.39 | ||||||||||||
A_RA | 0.37 | ||||||||||||
A_SG | 0.44 | ||||||||||||
M072901 | NonA | 0.58 | 0.58 | 0.78 | 0.77 | ||||||||
A_ET | 0.29 | 0.33 | 0.52 | 0.52 | |||||||||
A_RA | 0.27 | 0.29 | 0.50 | 0.51 | |||||||||
A_SG | 0.32 | 0.32 | 0.56 | 0.56 | |||||||||
M107201 | NonA | 0.77 | |||||||||||
A_ET | 0.52 | ||||||||||||
A_RA | 0.51 | ||||||||||||
A_SG | 0.56 | ||||||||||||
M144401 | NonA | 0.53 | 0.64 | 0.77 | |||||||||
A_ET | 0.43 | 0.38 | 0.52 | ||||||||||
A_RA | 0.44 | 0.36 | 0.51 | ||||||||||
A_SG | 0.38 | 0.38 | 0.56 | ||||||||||
M105801 | NonA | 0.58 | |||||||||||
A_ET | 0.29 | ||||||||||||
A_RA | 0.27 | ||||||||||||
A_SG | 0.32 | ||||||||||||
M106701 | NonA | 0.58 | |||||||||||
A_ET | 0.29 | ||||||||||||
A_RA | 0.27 | ||||||||||||
A_SG | 0.32 | ||||||||||||
M145001 | NonA | 0.58 | |||||||||||
A_ET | 0.29 | ||||||||||||
A_RA | 0.27 | ||||||||||||
A_SG | 0.32 | ||||||||||||
M013131 | NonA | 0.67 | |||||||||||
A_ET | 0.39 | ||||||||||||
A_RA | 0.37 | ||||||||||||
A_SG | 0.44 | ||||||||||||
M145101 | NonA | 0.58 | 0.80 | ||||||||||
A_ET | 0.29 | 0.54 | |||||||||||
A_RA | 0.27 | 0.54 | |||||||||||
A_SG | 0.32 | 0.54 | |||||||||||
M075801 | NonA | 0.78 | 0.80 | 0.77 | |||||||||
A_ET | 0.52 | 0.54 | 0.52 | ||||||||||
A_RA | 0.50 | 0.54 | 0.51 | ||||||||||
A_SG | 0.56 | 0.54 | 0.56 | ||||||||||
M106301 | NonA | 0.73 | 0.64 | 0.58 | 0.67 | 0.80 | 0.77 | ||||||
A_ET | 0.49 | 0.38 | 0.29 | 0.39 | 0.54 | 0.52 | |||||||
A_RA | 0.46 | 0.36 | 0.27 | 0.37 | 0.54 | 0.51 | |||||||
A_SG | 0.49 | 0.38 | 0.32 | 0.44 | 0.54 | 0.56 | |||||||
M144001 | NonA | 0.53 | 0.64 | 0.58 | 0.78 | ||||||||
A_ET | 0.43 | 0.38 | 0.29 | 0.52 | |||||||||
A_RA | 0.44 | 0.36 | 0.27 | 0.50 | |||||||||
A_SG | 0.38 | 0.38 | 0.32 | 0.56 | |||||||||
M144201 | NonA | 0.64 | 0.80 | ||||||||||
A_ET | 0.38 | 0.54 | |||||||||||
A_RA | 0.36 | 0.54 | |||||||||||
A_SG | 0.38 | 0.54 | |||||||||||
M013531 | NonA | 0.64 | 0.58 | ||||||||||
A_ET | 0.38 | 0.29 | |||||||||||
A_RA | 0.36 | 0.27 | |||||||||||
A_SG | 0.38 | 0.32 | |||||||||||
M105601 | NonA | 0.58 | 0.78 | ||||||||||
A_ET | 0.33 | 0.52 | |||||||||||
A_RA | 0.29 | 0.50 | |||||||||||
A_SG | 0.32 | 0.56 | |||||||||||
M105901 | NonA | 0.58 | 0.67 | ||||||||||
A_ET | 0.29 | 0.39 | |||||||||||
A_RA | 0.27 | 0.37 | |||||||||||
A_SG | 0.32 | 0.44 | |||||||||||
M144301 | NonA | 0.66 | 0.53 | 0.64 | 0.77 | ||||||||
A_ET | 0.42 | 0.43 | 0.38 | 0.52 | |||||||||
A_RA | 0.41 | 0.44 | 0.36 | 0.51 | |||||||||
A_SG | 0.43 | 0.38 | 0.38 | 0.56 |
About this article

Cite this article
Svetina, D., Dai, S. & Wang, X. Use of cognitive diagnostic model to study differential item functioning in accommodations. Behaviormetrika 44, 313–349 (2017). https://doi.org/10.1007/s41237-017-0021-0
Received:
Accepted:
Published:
Issue Date:
DOI: https://doi.org/10.1007/s41237-017-0021-0