
Abstract
The cement manufacturing process has been responsible for about 5 to 7 % CO2 emissions. However, during its life cycle, concrete structures are submitted to carbonation and can uptake part of CO2 emitted during its construction. In order to corroborate this potential, this study applied mathematical modeling to evaluate the performance of compression strength from a 20, 30 and 40 MPa concrete produced with different types of cements (CP III, CP IV and CP V, ARI) from 0 to 100 years of age. Based on these parameters, it was found out that CO2 uptake is directly ratable to the concrete superficial area exposed to CO2, influenced by the type of cement and concrete strength. CO2 emissions balance may become an indicator of sustainability and, in the future, it can be considered a compensatory measure in the concrete structures project.
1 Introduction
The increasing global consumption of cement and concrete has led to some discussions concerning possibilities to minimize emissions related to Portland cement production. It is estimated that more than 2 billion tons of carbon dioxide have been emitted in the last decade due to Portland cement process [1]. This fact ranks cement as one of the products that emits a huge amount of CO2. Thus, it represents almost 5 % total anthropogenic emissions [2]. Another important fact to be highlighted is that 50 % of these emissions are a result of limestone calcination (decarbonation) and the other part comes from fuel combustion during power generation to produce clinker. However, during cement lifetime, due to the reaction between CO2 that takes part of this reaction through concrete and calcium hydroxide (Ca(OH)2) in the presence of water, cement-based materials are submitted to carbonation. In cementitious structures, carbonation is considered a deterioration mechanism, because it decreases pH of a concrete. Thus, it allows concrete susceptibility to corrosion [3].
However, in non-structural concrete, carbonation can uptake CO2 from the atmosphere, to make up for partially emissions generated by cement production [4–6]. This compensation can be considered during the balance concerning greenhouse gases emissions, associated with concrete structures. In order to ensure this ability, further researches are required, which led to the development of this study.
2 CO2 uptake due to concrete carbonation
Carbonation is a result of CO2 chemical reactions with alkaline products of cement hydration, in order to form calcium carbonate (CaCO3) and water. This reaction (Ca(OH)2 + CO2 → CaCO3 + H2O) reduces concrete pH, so, steel becomes susceptible to corrosion. On the other hand, the same reaction uptakes CO2, since carbon dioxide that enters through concrete pore solution reacts with calcium hydroxide (Ca(OH)2) to produce CaCO3 in an opposite process to cement production (CaCO3 → CaO + CO2). Carbonation reaction, and consequently CO2 uptake, occurs throughout concrete structure lifetime. And according to Pade and Guimarães [7], it continues after demolition, where the process can be strengthened.
However, there is some disagreement defended by some authors regarding the potential of carbon sequestration/uptake ratio due to concrete carbonation (Table 1). This kind of research could be observed in a study carried out in Norway. Jacobsen and Jahren [8] estimated that 16 % CO2 emissions in cement production are reabsorbed by lifetime of concrete and carbonation process.
Gajda [14] reports that 7.6 % of emitted CO2 can be absorbed, but Pade and Guimarães [7] evaluate, in a study carried out in Denmark, an approach of 100 years and took into account a building demolishing, that concrete can absorb up to 57 % CO2 emissions in cement production due to carbonation. But, if building demolishing is not considered, this value is reduced to 24 %.
The disagreement in literature is mainly due to the factors that have influenced concrete carbonation (as compressive strength, exposure zone, amount of cement, age structure, among others) and are dependent upon the methodology used by researchers. Then, each structure requires specific studies for these estimates thus, other studies should be carried out to confirm that CO2 sequestration could be considered a compensatory measure due to concrete carbonation.
3 Mathematical modeling of concrete carbonation
Fib [15] stated that the durability is essentially a retrospective view of the structure performance. The expectation that a structure may be durable or not can only be evaluated through models that represent the deterioration processes, thus for the project assurance it is required the use of lifetime preview methods.
In order to understand and to model the deterioration mechanisms and their kinetic and action in the concrete structures, countless studies have emerged in the technical and scientific community. As a result, many models to estimate carbonation depth and lifetime preview were established in recent years. These models enabled considerable advances for understanding the behavior of the exposed concrete structures over time. With the aim of estimate the carbonation depth, Possan [16] compiled 39 models, which in general were based on Tuutii [17] model, that propound two periods to degradation process (initiation and propagation), separately modeled in most cases.
As the carbonation modeling can be physicochemical, numerical, analytical, or combined [18, 19] it results in empirical mathematical models [16, 20] or complexes models [19, 21]. The empirical ones, also named as simplified models, are based on adjustments of field or laboratory data or expert’s experiences, and usually have analytical solution. The complexes or phenomenological models are based on physicochemical laws, as the conservation of mass law for water and carbon dioxide. Given the complexity of these models, numerical solutions are required.
Commonly, empirical models are simpler to apply, however they may generate less accurate results due to simplifications. On the other hand, the complexes models tend to provide a major precision and generalization for the degradation process, due to the large number of considered influence variables, but they are harder to apply [16].
When it refers to concrete carbonation, both modeling segments have limitations. Empirical modeling do not conduct to a deep understanding of the involved degradation mechanisms, difficulting extrapolation and generalization, because normally the model database is limited. Besides, this models (as “k.√ t” [17], where “k” is the carbonation coefficient and “t” is the structure exposure time) don’t take into consideration all the main variables that influence the phenomenon, not describing it as the reality. Simulations with a model of this nature can conduct an error at the estimative. On the contrary, the complexes models consider a larger number of input variables, describing better the studied phenomenon, despite the difficult simulations. Many of the complexes models show few practical applications, since most of the input parameters are difficult to measure. In general, these models demand application of performance tests to specific material properties, as diffusion coefficient of CO2, Ca(OH)2 content, and others [16].
The Fig. 1 compares some literature models with similar characteristics [17, 20, 22–24]. These compared models contain simpler input data, as compressive strength, air humidity, among others.

Comparison between estimative models of concrete carbonation depth [16]
It’s remarkable that the analyzed models predict distinct carbonation depths. The proposed models by EHE [24] and Smolczyk [22] are the ones that predict bigger carbonation depths, followed by Langerblad [10], Tuutti [17] and Vesikari [23]. These models have a few input variables (in general just one) and do not consider many factors related to the carbonation process. On the other hand, the more complexes formulations such as proposed by Possan [16] and CEB 238 [20] include a larger number of input variables, enabling a better description of the the degradation process by carbonation. It’s notable that the estimated carbonation depths generated through these models are very close, which can be related with the similar number of variables used in both.
Therefore, it was decided to apply in this study the Possan [16] model, which has input data easily obtainable [25], as concrete compressive strength, cement type, type and content of pozzolanic additions employed, CO2 content of the exposure environment, air humidity and structure environment exposure (if indoors or outdoors, protect or not from the rain).
4 Estimation of CO2 uptake due to concrete carbonation
In order to calculate CO2 uptake rate during lifetime cycle of structures produced with different types of concrete, for a period from 0 to 100 years, this study was divided into six stages:
-
Step 1: Selection of concrete;
-
Step 2: Estimation of CO2 emissions resulting from cement manufacturing process, aggregates and concrete;
-
Step 3: Estimation of carbonation depth;
-
Step 4: Calculation of CO2 uptake by concrete structures during its lifetime period (0–70 years);
-
Step 5: Calculation of CO2 uptake by concrete structures after its demolition (70–100 years);
-
Step 6: CO2 balance during lifetime cycle of concrete structures.
4.1 Step 1: selection of concrete
In order to obtain the simulations, it was considered that the structure will be built in an urban area with an average relative humidity of 65 and 0.038 % CO2 content. Table 2 shows the concrete mixing ratio used in the simulations, measured by the ABCP/ACI method. A basaltic coarse aggregate is employed whose maximum diameter size is19 mm, Specific mass of 2700 kg/m3 and unit weight of 1515 kg/m3. Some natural quartz sand was applied as fine aggregate with fineness 2.9 modulus, specific mass of 2660 kg/m3 and unit weight of 1490 kg/m3.
4.2 Step 2: estimation of CO2 emissions resulting from the cement manufacturing process, aggregates and concrete
Carbon dioxide emissions from concrete production were estimated up from the cement manufacturing process until its availability at construction area, whether it is from batching plant or produced during the construction, including emissions from aggregates production ABNT 11578 [26]. Based on methodologies from IPCC [27] and CSI [28], emissions by energy use (E ene ), raw material decomposition (decarbonizing) (E desc ) and by transportation of cement manufacturing process (E trans ) were considered to estimate CO2 emissions relative to cement manufacturing process (E cim ), using Eq. 1.
For E ene , E desc e E trans calculations, it was used the methodology applied by Lima [29]. So, in order to estimate emissions from aggregates production, indicators found out in specific literature the use of 5.81 kgCO2/t for natural sand, and 15.46 kgCO2/t for crushed stone (MARCOS) [30]. Also, in order to estimate CO2 emissions by transportation, 8.4 kgCO2/t were used LIMA [29]. The energy data were collected from the National Energy Balance—NEB [31]. All calculations and estimations were performed in Excel spreadsheets.
4.3 Step 3: estimation of carbonation depth
Using the Excel® software, carbonation depth estimation of concrete through time was carried out with the degradation model proposed by Possan [16] (see Eq. 2), selected because it has readily available input variables (compressive strength, kind of cement, CO2 content in the environment) and good representativeness of damage (it represents almost 85 % of tested cases).
where (y(t)) is the average of carbonation depth (mm); (f c ) is the characteristic of compressive strength in concrete (in MPa); (k c ) is the factor according to the kind of cement (Table 3a); (k fc ) is the factor relating to compressive strength of concrete, depending on which cement is used (Table 3a); (t) is the concrete age (year); (ad) is the percentage of pozzolanic in concrete (relative to cement mass); (kad) is the factor to pozzolanic additions of concrete–silica fume, metakaolin and rice husk ash, according to the used cement (Table 3a); (RH) is the average of relative humidity (in % * 0.01) (k rh ) is the factor related to relative humidity, according to cement used (Table 3a); (CO2) is the atmospheric CO2 concentration, (in %); (K CO2 ) is the factor related to the environment CO2 content, according to the cement used (Table 3a); and (K CE ) is related to exposure to rain factor, according to exposure conditions of the structure (Table 3b).
4.4 Step 4: calculation of CO2 uptake by concrete structures during its lifetime (0–70 years)
Calculations were carried out concerning carbonation by concrete on a structural element, shown in Fig. 2, to estimate the amount of CO2 uptake during the structures’ lifetime (70 years) for different scenarios (Table 1). Based on stoichiometric calculations, CO2 uptake was estimated due to concrete carbonation by Eq. 3.

Concrete structure
Where (y) is carbonation depth of concrete (in meters); (c) is the amount of used cement to produce one m3 of concrete (without considering additions); (CaO) is the amount of calcium oxide contained in cement; (r) is CaO ratio that is totally carbonated; in other words, it is transformed into CaCO3; (A) is the surface area of concrete exposed to CO2 action (m2) and (M) is molar fraction of CO2/CaO.
4.5 Step 5: calculation of CO2 uptake by concrete structures after its demolition (70–100 years)
Estimate of CO2 uptake amount by concrete during post-demolition period was obtained by simulations of carbonation that were carried out from demolishing structure residues. So, the carbonated layer was removed over the lifetime and became “non-carbonated concrete” in 30 × 30 × 30 mm cubes (Fig. 3), considering that they would be exposed to CO2 for a period of 30 years. Therefore, the following steps were employed to estimate CO2 uptake rate by concrete after demolition:
-
(a)
Estimation of carbonation depth at the end of lifetime of a building structure (70 years);
-
(b)
Volume estimation of carbonated and non-carbonated concrete during its lifetime;
-
(c)
Definition of approximate dimensions of concrete elements after demolition (Fig. 3);
-
(d)
Calculation of the new total surface area of concrete elements after demolition, according to Eq. 4;
-
(e)
Use of Eq. 3 with the new surface area to determine CO2 (kg/m3) uptake amount after demolition.
Fig. 3 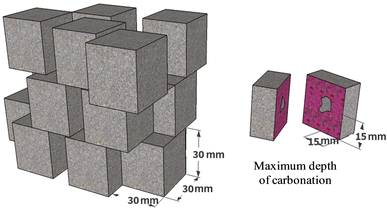
Concrete elements after demolition
$$ A_{st} = V_{nc} .\left( {\frac{{A_{sc} }}{Vc}} \right)\; \left( {{\text{m}}^{ 2} } \right) $$(4)where (A st ) is the total surface area that is in contact with the atmosphere (m2); (A sc ) is the concrete surface area (parallelepiped) (m2); (V c ) is concrete volume (parallelepiped) (m3) and (V nc ) is the concrete volume that has not occurred carbonation (m3) yet.

4.6 Step 6: CO2 balance during the life cycle of concrete structures
Equation 5 was used to estimate CO2 balance during the life cycle of concrete structures. The computed value refers to the amount of CO2 that has been emitted to manufacture each concrete (scenarios 1 to 9—Table 1) subtracted from the uptake amount along the life cycle due to carbonation, according to Eq. 5.
where (B co2 ) is CO2 balance, (E con ) is CO2 amount emitted during concrete manufacture process and (C cap ) is an amount of CO2 uptake by concrete.
5 Results
Table 4 shows carbonation depth of the structures over time, calculated by Eq. 2.
In some cases, during post-demolition period, concrete was fully carbonated before concluding the estimated life cycle of 100 years. This fact is due to shape and size of residue particles used in simulations (cube sides are equal to 30 mm). Whereas CO2 can enter through all the faces, maximum carbonation depth of each particle is 15 mm (see details in Fig. 3)
As it is expected (see Table 3), the increase of compression strength of concrete reduces carbonation depth [16, 32], so, there is some reduction on the amount of carbon absorbed from the atmosphere (see Figs. 4, 6, 8). According to Kumar et al. [33], concretes with higher compressive strength have lower porosity due to the influence of water/cement ratio, and this makes CO2 difficult to be captured.

Evolution of CO2 uptake over time in concrete with cement CP III

Quantities of CO2 emitted and carbonated in concretes—20 MPa

Evolution of CO2 uptake over time in concrete—cement CP IV

Quantities of CO2 emitted and carbonated in concrete—30 MPa

Evolution of CO2 uptake over time in concrete—cement CP V ARI
There is also some influence concerning cement during concrete carbonation. Concretes produced with cements without (CP V) additions tend to have higher compressive strength to carbonation than with (CP III and CP I) additions. This is because advance of carbonation is inversely proportional to alkalinity reserve, available in the matrix of hydrated cement paste: a role of cement chemical composition [34], influenced by its kind and content additions.
Within limits set by NBR 11578 [26] in Brazil, CP V AR I cement has a maximum of 5 % carbonate additions (Limestone) while CP III and CP IV have, respectively, 35–70 % of slag blast furnace additions and 15–50 % of fly ash contents, which alter chemical composition of cement, with direct influence on concrete carbonation as well as CO2 uptake.
Figures 4, 6 and 8 show CO2 (kg/m3) values, absorbed from the atmosphere, by concrete structures during its lifetime (0 to 70 years) and post-demolition period (70–100 years) according to strength contents. While Figs. 5, 7 and 9 show the amount of CO2 emitted to produce concrete and register the uptake amount due to carbonation during life cycle depending on the cement (according to Eqs. 3, 4).

Quantities of CO2 emitted and carbonated in concrete—40 MPa
It should be pointed out that at 20 MPa compressive strength of concrete, CO2 potential and uptake due to carbonation is on average 60 % higher than the uptake one during the lifetime period, if post-demolition is considered. It is shown the importance of considering structure demolition in CO2 balance. Similar results are observed for other concretes. This fact is due to the greater surface area of exposed concrete to CO2 action, which increases carbonated area, and therefore carbonation reaction of CO2 uptake. The considered structure according to estimates of lifetime has 6.5 m2 surface area, while during post-demolition period, an average surface area estimated of waste generated is approximately 64.47 ± 1 m2 (the area is variable in post-demolition period due to carbonated layer deduction during its lifetime, which varies with strength and cement used).
There can be seen in Figs. 5, 7 and 9 CO2 emissions as a result from concrete manufacturing process, where the positive quadrant was related to the produced emissions and the negative quadrant concerned about CO2 uptake due to concrete carbonation during the structure life cycle (lifetime and post-demolition). It was also considered the kind of cement and its compressive strength. It seems that concrete during its lifetime can uptake from 40 to 90 % CO2 emitted in its manufacturing process. In some cases, considering the structure demolition, its uptake is nearly 100 %. An example of this is a concrete made from cement CP III, where the emissions of concrete manufacture are 128 kgCO2/t while its uptake is 120 kgCO2/t (see Fig. 9).
According to Eq. 5, in Fig. 10, CO2 balance is shown in nine scenarios of study. It is presented carbon uptake percentage by concrete throughout its service life (70 years) and during the post-demolition period (up to 30 years), as well as CO2 percentage that remains in the atmosphere, in other words, which has not been captured yet.

Balance of CO2 due to concrete carbonation
It has been observed that concrete produced with cement CP IV ARI has shown a balance of the least favorable emissions, although there was a better performance concerning durability, since it has greater compressive strength to carbonation. The best results for CO2 balance in concrete produced with cement with additions (CP III and CP IV) are assigned to the cement manufacturing process, since part of the clinker is replaced by additions. Consequently, there were reductions on emissions per ton of produced cement. It was also due to alkalinity reduction in concrete with additions, which results in faster carbonation and, therefore, the largest CO2 uptake.
It should be highlighted that concrete carbonation during post-demolition is highly dependent on exposure conditions and dimensions of demolished material, so, specific research is required to evaluate, in real scale, both form and time of waste exposure to CO2 action.
6 Conclusions
According to the mathematical modeling, it was found out that concrete has potential regarding CO2 uptake due to carbonation reaction. And, during the post-demolition period, its potential can be increased up to five times. Besides the factors that affect concrete carbonation (compressive strength, kind of cement, etc.), the surface area of a structure exposed to carbon dioxide action influences CO2 uptake. The larger is the area in contact with CO2, the largest is potential uptake.
CO2 uptake, which is a result from concrete, has been important for industrial construction. Since this process is known, it is possible to indicate concrete by its performance, aiming at durability, with a minimum use of Portland cement, that can also CO2 uptake from atmosphere during the structure lifetime. This denotes that the balance of emissions can be considered in the future, a compensatory measure in design of concrete structures.
References
Yang K, Seo E, Tae S (2014) Carbonation and CO2 uptake of concrete. Environ Impact Assess Rev 46:43–52. doi:10.1016/j.eiar.2014.01.004
CDIAC—Carbon Dioxide Information Analysis Center (2007) National Cement Production Estimates: 1950–2007, 2007. Disponível em http://cdiac.ornl.gov/. Último acesso em 20 de julho de 2011
Parrot LJ (1987) A review of carbonation in reinforced concrete. Cement and concrete Association report, p 43
Pade C (2007) The CO2 uptake of concrete in the perspective of life cycle inventory. In: International Symposium on Sustainability in the Cement and Concrete Industry, Norway
Galan I, Andrade C, Mora P, Sanjuan M (2010) Sequestration of CO2 by concrete carbonation. Environ Sci Technol 44(8):3181–3186. doi:10.1021/es903581d
Possan E, Fogaça J, Pazuch C (2012) Sequestro de CO2 devido à carbonatação do concreto: potencialidades da barragem de Itaipu. Revista de estudos ambientais 14(2):28–38
Pade C, Guimaraes M (2007) The CO2 uptake of concrete in a 100 year perspective. Cement Concrete Res 47(9):1384–1356. doi:10.1016/j.cemconres.2007.06.009
Jacobsen S, Jahren P (2002) Binding of CO2 by carbonation of Norwegian OPC concrete. In: CANMET/ACI international conference on sustainability and concrete technology, Lyon
Gajda J, Miller F (2000) Concrete as a sink for atmospheric carbon dioxide: a literature review and estimation of CO2 absorption by Portland cement concrete. PCA. R&D Serial no. 2255, Chicago
Lagerblad B (2005) Carbon dioxide uptake during concrete life cycle—state of the art. CBI Report 2
Nilsson L (2011) CO2-cycle in cement and concrete part 7: models for CO2-absorption. A new model for CO2-absorption of concrete structures. Lund University, Sweden
Damin OCB (2013) Sequestro de dióxido de carbono (CO2) por resíduos de construção e demolição. Universidade Santa CecíliaPrograma de Pós-graduação em sustentabilidade de ecossistemas costeiros e marinhos, Santos: Programa de Pós-graduação em sustentabilidade de ecossistemas costeiros e marinhos
Haselbach L, Thomas A (2014) Carbon sequestration in concrete sidewalk samples. Constr Build Mater, pp 47–52. doi:10.1016/j.conbuildmat.2013.12.055
Possan E, Felix E, Thomaz WA (2016) Metodologia para estimativa da captura de CO2 devido à carbonatação do concreto. In: Poleto C (ed) Estudos ambientais, vol 4. Interciência Ltda
Fédération Internationale Du Béton (2010) FIB Bulletin 53. Model Code for Structural Concrete Textbook on behaviour, design and performance, 2nd edn. Volume 3: Design of durable concrete structures, p 390
Possan E (2010) Carbonation modeling and service life prediction of concrete structures in urban environment. Porto Alegre: Engineering School, Federal University of Rio Grande do Sul. PhD Thesis in Engineering
Tuutti K (1982) Corrosion of steel in concrete. Swedish Cement and Concrete Research Institute, Stockholm, Suecis, p 30
Muntean A, Meier S, Peter M (2005) A note on limitations of the use of accelerated concrete-carbonation tests for service-life predictions, Universität Bremen, pp 1–15
Thiéry M (2005) Modélisation de la carbonatation atmosphérique des bétons: Prise en compte des effets cinétiques et de l’état hydrique. Paris: Ecole Nationale des Ponts et Chaussées. Thèse de doctorat
Comite Euro-International Du Beton (1997) CEB 238: new approach to durability design: an example for carbonation induced corrosion. Bulletin d’ Information”, Suecis, n. 238, p 138
Papadakis VG, Vayenas CG, Fardis MN (1991) Fundamental modeling and experimental investigation of concrete carbonation. ACI Mater J 88:363–373
Smolczyk GH (1976) Physical and chemical phenomena of carbonation. In: RILEM symposium on carbonation of concrete, p 10
Vesikari E (1988) Service life prediction of concrete structures with regard to corrosion of reinforcement. In: Technical Research Centre of Finland, report 553 (Espoo), Finland, p 53
Comisión Permanente del Hormigón (2008) EHE: Instrucción de Hormigón Estructural. Ministério de obras públicas e urbanismo, Madri, Espanha
Dal Molin DCC, Masuero AB, Andrade JJO, Possan E, Masuero JR, Mennucci MM (2016) Contribuição à Previsão da Vida Útil de Estruturas de Concreto. In: Claudio de Souza Kazmierczak, Márcio Minto Fabrício (Org.) Avaliação de Desempenho de Tecnologias Construtivas Inovadoras: Materiais e Sustentabilidade. 1ed.: Editora Scienza, pp 223–270. doi:10.5935/978-85-5953-005-6.2016C008 [in portuguese]
NBR 11578 (1997) Cimento Portland composto—Especificação. ABNT—Associação Brasileira de Normas Técnicas, Rio de Janeiro, 2001. Versão Corrigida
IPCC (2006) Guidelines for National Greenhouse Gas Inventories. Intergovernmental Panel on Climate Change. http://www.ipcc.ch
CSI: Cement Sustainability Initiative (2011) WBCSD: World Business Council for Sustainable Development [Online]. http://www.wbcsdcement.org/pdf/tf1_co2%20protocol%20v3.pdf. Acesso em 14 4 2016
Lima J (2010) Avaliação das consequências da produção de concreto no Brasil para as mudanças climáticas, Escola Politécnica da Universidade de São Paulo, EPUSP
Marcos M (2009) Análise da emissão de CO2 em edificações através de uma ferramenta CAD-BIM. In: SIGraDi 2009 sp—from modern to digital: the challenges of a transition, São Paulo
BRASIL. Ministério das Minas e Energia (MME) (2012) Balanço Energético Nacional 2012: Ano base 2011. Empresa de Pesquisa Energética—EPE, Rio de Janeiro
Pauletti C, Possan E, Dal Molin DCC (2007) Carbonatação acelerada: estado da arte das pesquisas no Brasil. Ambiente construído 7:7–20
Kumar R, Bhattacharjee B (2003) Porosity, pore size distribution and in situ strength of concrete. Cement Concrete Res 33:155–164. doi:10.1016/S0008-8846(02)00942-0
Meyer A (1987) The importance of the surface layer for the durability of concrete structures. In: International conference on concrete durability, Atlanta
Acknowledgments
We thank financial support from National Council for Scientific and Technological Development (CNPq) and Center for Advanced Studies on Dam Safety from the Itaipu Technological Park (CEASB/PTI).
Author information
Authors and Affiliations
Corresponding author
Rights and permissions
About this article

Cite this article
Possan, E., Felix, E.F. & Thomaz, W.A. CO2 uptake by carbonation of concrete during life cycle of building structures. J Build Rehabil 1, 7 (2016). https://doi.org/10.1007/s41024-016-0010-9
Received:
Accepted:
Published:
DOI: https://doi.org/10.1007/s41024-016-0010-9