
Abstract
Since the 2019 novel Coronavirus disease (COVID-19) spread across the globe, risks brought by the pandemic set in and stock markets tumbled worldwide. Amidst the bleak economic outlook, investors’ concerns over the pandemic spread rapidly through social media but wore out shortly. Similarly, the crash only caused a relatively short-lived bear market, which bottomed out and recovered quickly. Meanwhile, technology stocks have grabbed the spotlight as the digitally advanced sectors seemed to show resilience in this Coronavirus-plagued market. This paper aims to examine market sentiments using social media to predict the stock market performance before, during and after the March 2020 stock market crash. In addition, using the Organisation for Economic Co-operation and Development Taxonomy of Sectoral Digital-intensity Framework, we identified market sectors that have outperformed others as the market sentiment was impacted by the unfolding of the pandemic. The daily stock performance of a usable sample of 1619 firms from 34 sectors was first examined via a combination of hierarchical clustering and shape-based distance measure. This was then tested against a time series of daily price changes through augmented vector auto-regression. Results show that market sentiments towards the pandemic have significantly impacted the price differences. More interestingly, the stock performance across sectors is characterized by the level of digital intensity, with the most digitally advanced sectors demonstrating resilience against negative market sentiments on the pandemic. This research is among the first to demonstrate how digital intensity mitigates the negative effect of a crisis on stock market performance.
1 Introduction
The outbreak of 2019 novel Coronavirus disease (COVID-19) has brought widespread risks and investor concerns worldwide, with the stock prices in all major stock markets seeing sudden and unprecedented fall. The Coronavirus stock market crash was among the fastest falls in financial history [1]. Amidst the bleak economic outlook, investors’ concerns over the pandemic seemed to spread rapidly through social media but wore out shortly after that. Social media data measure people’s attention on unexpected incidents and can serve as a timely indicator that drives investment dynamics. For example, salient patterns exhibited in social media have been employed as an unconventional source of strategic information to predict stock market movements [2]. In fact, like the sudden surge and decline in social media postings on the pandemic, the crash only caused a relatively short-lived bear market, which bottomed out and recovered quickly.
Meanwhile, many countries have imposed lockdown measures in attempts to slow the spread of the life-threatening virus, from mandatory geographic quarantines, non-mandatory recommendations to working from home, closures of certain types of business entities, or bans on mass events and gatherings. These measures have brought those that are categorized as ‘non-essential’ brick-and-mortar business activities close to complete standstill. However, reports have suggested that even as most corporeal business activities halted, trade and consumption continued to grow online as the virus peaked [3]. This is also well reflected in the financial markets—technology stocks have grabbed the spotlight as the digitally intensive sectors seemed to show resilience in this Coronavirus-plagued market. Changes in consumer habits—an accelerated embrace of e-commerce, home entertainment and working from home [4]—have strengthened the already dominant positions of a few mega-cap technology companies, such as Amazon.com, PayPal and Alphabet, Google's parent company[5].
Data science, coupled with computational biology, is helping in myriad ways with applications including epidemiology, drug discovery, and molecular design for diagnostic and therapeutic purposes [6,7,8]. A number of data driven models, mathematical models, and predictive models have been developed for COVID-19 [9,10,11,12,13]. This paper aims to apply data science methods to predict the stock market performance using social media data before, during and after the March 2020 stock market crash. Specifically, using the Organisation for Economic Co-operation and Development (OECD) Taxonomy of Sectoral Digital-intensity Framework [14], we model market sentiments using cumulative Twitter postings on COVID-19 to predict the stock market performance and investigate what are the sectors that have outperformed others as market sentiments are impacted by the unfolding pandemic. In particular, we are interested to find out how digital intensity moderates the effect of market sentiments on firms’ stock prices, particularly due to largescale unanticipated events such as a pandemic.
This research contributes to the existing literature by examining the influence of market sentiments associated with COVID-19, as derived using cumulative social media postings, upon the stock market performance. While previous research has considered the use of social media to improve stock performance forecasting [15, 16], this research is among the first few to demonstrate how digital intensity could mitigate the negative effect of market sentiments on stock market performance in a time of crisis.
The rest of the paper is organized as follows. The next section introduces the extant literature covering three fields of research: the impact of largescale unanticipated incidents on stock performance; the relationships between social media and the stock markets; and the sectoral digital intensity. This is then followed by a section that depicts the empirical study, detailing the research method and data analysis. The discussion section features the implications drawn from the key findings to both research and practice.
2 Literature Review
This research aims to investigate what are the sectors that have a competitive advantage despite the adverse effect of the pandemic. The subsequent sub-section looks at social media and financial markets, reviewing the literature on how social media data have been employed in examining investors’ sentiments and stock market performance. Furthermore, considering that digitally advanced firms performed ostensibly better in the financial markets, the OECD taxonomy of sectors by digital-intensity [14], which is adopted as the framework for classifying the sectors in the present study, is then introduced.
2.1 Effect of Largescale Unanticipated Events on Stock Markets
According to the Efficient Market Hypothesis (EMH), the aggregate decisions of all participants in the market should accurately reflect the value of public companies and their common shares at any given moment of time. Yet, empirical evidence has shown that, in violation of EMH, people tend to “overreact” to unanticipated and dramatic news events [17, 18]. Over-reaction may occur in the short run when investors turn extremely pessimistic during downturns, or place too much emphasis on recent incidents while discounting historical data, which results in prices falling excessively on bad news [18].
In the current research, the COVID-19 pandemic is conceptualized as an instance of large-scale unanticipated adverse events. In the past, various studies have examined the impact of disasters or major incidents on stock markets. For instance, Barrett et al. [19] studied the effects of aviation accidents on stock returns in 1987; Shelor et al. [20] and Lee et al. [21] analysed the effects of natural disasters, such as hurricanes and earthquakes, on the stock markets. Cam and Ramiah [22] studied how investors react in the presence of unique large-scale disasters, such as the 9/11 terrorist attacks. Their results show considerable stock market overreactions, which are in agreement with an availability bias acknowledged in the behavioural finance literature, driven by the unprecedented loss and the successive high media attention these events typically receive [23].
Like other types of catastrophic events, COVID-19 is characterized by extreme uncertainty, whose transmission characteristics and consequences to human bodies were largely unknown. The rapid increase in new cases and death tolls have a significant emotional and material impact worldwide. The virus has certainly adjusted the investor perception on the micro and macroeconomic outlook, resulting in a ‘market-wide shock’. In fact, the impact of COVID-19 on the stock market is more significant than previous disasters due to its fast transmission across the world and it is expected to co-exist with humans over the long-term [24].
In the past, there have been many epidemics that impacted stock markets worldwide, such as Influenza, Ebola, and Severe Acute Respiratory Syndrome (SARS). All of these events have caused extensive impact on the financial markets. For the United States, a higher incidence of flu is associated with decreased trading, decreased volatility, decreased returns, and higher bid-ask spreads [25]. SARS infected more than 8000 people in 2003 and shaved 12.8% off the Standard & Poor (S&P) 500 over 38 trading days; Avian Influenza in 2004, Middle East Respiratory Syndrome (MERS) in 2012 and Ebola in 2013–2014 resulted in 5.8 to 7.3% drop to the S&P 500 over different lengths of time. Similarly, the market suffered a near 12.9% pullback in a span of 66 trading days due to the outbreak of Zika virus between 2015 and 2016 [26]. Nonetheless, none of the preceding epidemics were comparable to COVID-19 in terms of its number of cases infected and destruction to the economy and the financial markets. In order to stop the transmission, countries have shut down their business and people are advised to stay home. As a result, unemployment rates have increased; tourism and supply chains around the world have been disrupted [27]. Khurram, Liu and Hayfa [24] argue that COVID-19 has paused the economic cycle throughout the world, and that the health crisis has successfully induced the global financial crisis. Since the outbreak of COVID-19, major financial markets, such as the S&P 500, National Association of Securities Dealers Automated Quotations System (NASDAQ) 100, and Nikkei 225, have been confronted with a severe collision of nearly 30% in market values. Markets are close to collapse as they were during the Global Financial Crisis (GFC) between 2007 and 2009 [28], but more perilous [29]. In addition, the financial volatility index (VIX), also known as "Fear gauge," has moved to the highest level, while the 10-year treasury yield index in the US has dropped to record low figures [27]. According to an assessment by the Asian Development Bank (ADB), the global cost of COVID-19 could be $4.1 trillion.
While the economies are being hit hard, we observe an almost V-shaped recovery in several stock markets, despite the international gloomy economic outlook. There are many discussions on the possible reason behind the rapid rebound, such as fiscal stimulus from the Fed and Congress, expectations of a strong economic recovery and major technology stocks that help drive the gains [30, 31]. This paper posits that the stock market rebound is partly attributed to the fading worries about the virus. The measures taken by nations around the world to manage COVID-19—restricting travel, shuttering nonessential businesses and mandatory social distancing policies—are having obvious impacts on slowing contagion. Coronavirus complacency arrives after overblown fears fuelled by media, which seem to contribute to the volatility of the stock market.
2.2 Social Media and Stock Markets
Most conventional research that examines the impact of largescale unanticipated events on stocks have mainly used intervention analysis [32] or event studies [33]. These incidents are typically operationalized as dummy variables, which are not able to directly assess the public attention to outlying events, nor quantify such effects. Some exceptions include Liu et al.’s [34] study on aviation accidents and Ding et al.’s [35] research on the impact of COVID-19. Both Liu et al. [34] and Ding et al. [35] determine market sentiments towards critical events using Search Indices, and assess their effects on stock prices.
Stock prices are influenced by a variety of fundamental factors. Investor sentiments play an important role in shaping the stock market [36]. Numerous professional and amateur analysts and investors use Twitter to post news articles and opinions, often more frequently than the mainstream news media [16]. As a meaningful channel for users to share information, social media have been integrated into many aspects of decision-making processes in our daily lives [37], including investment decisions [15]. Social media data reveal significant public interest, almost in real time. As such, it serves as a convenient and appropriate source to measure market sentiments.
Several extant studies have shown that social media data measure people’s attention and sentiments and provide timely feedback on investment dynamics. Bollen et al. [2] reveal that Twitter feeds are correlated to the value of the Dow Jones Industrial Average (DJIA) over time. Their work is in line with the findings of Gilbert and Karahalios [38], who construct public anxiety indices from online comments to estimate moves of the S&P 500. Several other important studies have also shed light on the various aspects of financial market performance in relation to social media. For example, Sprenger et al. [16] deploy machine learning algorithms to construct a different bullishness index, which is predictive of stock returns days later. Smailovic, Grcar, Lavrac, and Znidarsic [39] find sentiment (i.e., positive emotion) in Twitter postings to be predictive of stock returns. Saini and Sharma conduct a comparative analysis of various prediction techniques deployed to predict stock price using public sentiments from social media and other news sources [40]. These results confirmed the feasibility of using social media as a proxy for market sentiments.
Sul et al., [15] analyse the cumulative sentiments (positive and negative) in tweets on S&P 500 firms and model them against the stock returns of those firms. Cumulative posts that capture the collective interest of investors are an appropriate reflection of market sentiments and useful indicators for predicting investment decision making [15]. This study builds upon Sul et al. [15] in applying cumulative social media feeds as an indication of collective attention towards a largescale unanticipated incident, i.e. COVID-19, to study their impact on the stock performance across sectors.
2.3 Digital Intensity of Sectors
Despite the spread of COVID-19 resulting in the stalling of brick-and-mortar business activities, reports have shown that COVID-19 is accelerating the rise of the digital trade. Digitally-enabled companies are thriving in a time of crisis [3, 41]. Firms that have undergone digitalisation are more capable to maintain some degree of business operation and revenue stream amidst the pandemic. Changes are affecting multiple aspects (e.g. product, process and business model innovation) and stages of innovation (e.g. research, development, commercialisation), the prevalence of which may differ across sectors [42].
Recent OECD work [14] benchmarks sectors in accordance to their level of digital intensity. The OECD’s Taxonomy of Digital Intensive Sectors is one of the most established sectorial digitalization frameworks [42, 43]. This framework provides a systematic overview of digitalisation and its various manifestations: its technological indicators consist of Information and Communications Technology (ICT) equipment and software investment relative to total fixed investment; Purchases of ICT intermediate goods and services relative to output; Stock of robots per employee; Number of ICT specialists over total employment (also referred to as “ICT-specialist intensity”); and Propensity to engage in e-commerce sales. The indicators considered highlight how the degree of digitalisation in sectors is shaped by firms’ investments in various “digital” assets, the approach to interact with markets, the (type of) human capital and skills required, and the way production is operationalized.
There are 36 sectors in the OECD Structural Analysis (STAN) database, ranked by their intensity in the above-mentioned dimensions. For each indicator, cross-country averages are calculated at the sector level and used to benchmark each sector relative to all the others. Table 1 displays an overall summary of the sectors by quartile of digital intensity. Specifically, the taxonomy lists sectors according to their relative position in the overall economy’s ranking and categorizes them into “high”, “medium–high”, “medium–low” and “low” digital intensity, depending on whether sectors appear in the top 25% (or quartile, denoted as “high”), in the bottom 25% (“low”), or in between the two.
As illustrated in Table 1, some sectors lag in the degree of digitalisation, such as agriculture, mining, and real estate. By contrast, the technology sector, media, financial services, and professional services are ahead of the curve. The uneven development of digitalisation matters as it is creating a new digital divide between the digital “haves” and “have-mores” across sectors. Firms with advanced digital assets and capabilities have been found to enjoy faster growth in revenue and profit margin and generate higher return to shareholders [14].
Digital transformation is a multifaceted phenomenon that has profound impact. Technologies have always served as key resources in handling issues with regards to complex product-service systems [44]. For manufacturing companies, a service-oriented transformation enabled by technological revolution is deemed to be important by both trade [45] and academic literature [46]. Technologies such as the Internet of things and artificial intelligence offer new pathways to innovative business models, transforming traditional manufacturing to smart manufacturing where the operations require minimal human intervention[47].
In a post-COVID-19 ‘new normal’, it is posited that in enhancing societal and economic resilience, digital connectivity has emerged as a crucial alternative to the physical equivalent [48]. It is observed that the stock price of Zoom Video Communications, Inc., a web conferencing platform provider, has risen from US$70 in early Jan 2020 to US$150 at the end of March 2020 amid the market crash. The “GAFAM” stocks—Google; Apple; Facebook; Amazon; and Microsoft—have significantly outperformed broader market indices because of travel restrictions and social distancing orders [5]. As many companies plunge into the financial unknown, sectors with a pre-existing digital ecosystem instil investors’ confidence in the companies and their stocks [3, 49]. Thus, sectors that have embarked on digital transformation, the digital “have-mores”, are more resilient to the adverse effect of market sentiments from COVID-19, while other sectors that are succumbing with total standstill are amongst the most negatively affected.
3 Empirical Study
3.1 Research Design
To differentiate the sectors that have performed relatively well from those that have been more heavily impacted by the unfolding of the pandemic, we carry out an empirical study using data from daily cumulative Twitter feeds on COVID-19 and stock prices. The OECD Taxonomy of Sectoral Digital-intensity Framework [14] is referenced to classify the sectors.
The study comprises two phases. The first Phase used hierarchical clustering and shape-based distance (SBD) to validate the categorisation of firms specified in the OECD Sectoral Digital-intensity Framework, extending the approaches by Sardá-Espinosa [50] and Paparrizos and Gravano [51]. The analysis identified two distinct clusters, i.e., a “sensitive” cluster and a “resilient” cluster. The second Phase modelled daily cumulative Twitter feeds on COVID-19 and stock price changes in an augmented vector auto-regression (VAR) [52]. The analysis compared the stock performance of firms across the two levels of digital intensity, i.e., low/medium, and high, according to the OECD Sectoral Digital-intensity Framework. The empirical investigation in the two phases built upon each other, supporting the notion that market sentiments towards COVID-19 as reflected in Twitter feeds affect the stock prices.
3.2 Data Sources and Analysis
Using data from FactSet, we selected close to 2000 firms listed on the NASDAQ according to the sectoral information in 2020. As one of the world’s largest stock exchange based on market capitalization, NASDAQ represents one of the most extensively studied stock exchange database among the academic community [53, 54]. Data collection from such a popular platform facilitates gleaning findings that would hold both academic and practical significance. Sectors are selected according to the OECD Taxonomy of Sectoral Digital-intensity Framework [14]. The sample comprised four categories of firms: “high”, “medium–high”, “medium–low” and “low” digital intensity, depending on whether sectors appear in the top 25% (or quartile, denoted as “high”), in the bottom 25% (“low”), or in between the two.
From the initial sample, all entries with missing values were eliminated. Pharmaceutical and biopharmaceutical sectors are playing an essential role at the front lines against the virus. While global stock markets take a COVID-19 hit, pharmaceutical stocks are generally outperforming the others, with increased investments in the race to develop therapeutics and vaccines. Manufacturers of diagnostic kits, sanitizers and surgical masks are all ramping up production to meet unprecedented demand. As the present study mainly focuses on how digitally advanced sectors show resilience against negative market sentiments under crisis, firms belonging to the pharmaceutical and biopharmaceutical sectors were removed from the sample to avoid confounding effects. Additionally, we also removed hotels, resorts and cruise lines from the sample. As one of the hardest-hit industries, these sectors were largely affected by travel restrictions, social distancing and lockdowns, which are not relevant to the research focus of digitalisation. The final dataset consists of 1619 firms from 34 sectors.
Although these stocks in the sample cover only 31% of all stocks on the NASDAQ, they represent an economically significant segment of the total market as they account for close to 40% of total NASDAQ market capitalization in the first half of 2020. The average market capitalization of the sampled stocks is US$8,540 million, with a median value of US$643 million. The sampled time period (all trading days between early January to early May) allows a reasonable amount of time lag for the COVID-19 outbreak to generate public attention and stir market response. Table 2 summarizes the descriptive statistics of the firms in each sector. From the column of average daily price changes during the sample time period, some sectors (e.g., agricultural commodity, apparel/footwear retail, construction, etc.) exhibit negative price movement, whereas some sectors such as Internet retail and telecommunication that are likely to be resilient during the pandemic exhibit positive price change. Additionally, we examine the stock price trends of the top companies in two sampled industries (i.e., chemical products and Internet retail) before, during and after the March 2020 stock market crash (see Fig. 1). A mixed effect of the COVID-19 outbreak is observed in the chemical products sectors. In contrast, industries like Internet retail provide a silver lining amid the gloomy stock market with a stronger turn-around than other sectors. Stocks exhibit different degrees of rebound from the pandemic crash. In Phase 1, we intend to group together firms of similar performance in Coronavirus-plagued market and similar degree of rebound following the market crash.

Stock Price Movement of Representative Industries. The stock prices of Amazon.com.Inc were scaled down (i.e., actual stock price/20) to fit into a comparable view with other companies in the Internet retail sector
In Phase 2, the daily cumulative Twitter postings on COVID-19 are collected from Tweet Binder [55]. Between mid-January 2020 to early May, there were 628,809,016 tweets generated on COVID-19 on Twitter [55], which captured the evolution of several keywords: #covid19 OR #Coronavirus OR Coronavirus OR #covid-19. In mid-March, Twitter showed an unprecedented increase in tweets related to the Coronavirus in a very short span of time (see Fig. 2). Cumulative Twitter postings have been used as a source of data in several studies [15], yet how such social media behaviours evolve during the course of a pandemic has not been extensively studied hitherto. We posit that such daily cumulative data are a timely reflection of the market attention on the catastrophic crisis. This research is the first to employ social media feeds to examine how critical incidents influence stock prices of firms across different sectors. Such data not only offer insights into investors' collective attention under unexpected incidents, but also reflect the changes over time.

Source: Tweet Binder [46]
Twitter feeds related to COVID-19. The streamer captures the daily cumulative tweet counts by #covid19 OR #Coronavirus OR Coronavirus OR #covid-19 to reflect the evolution of tag words.
4 Results
4.1 Phase 1 Results
Instead of comparing static descriptive indicators of firms, this study employs clustering methodology on dynamic stock time series from Jan 2020 to early June 2020 [56]. The choice of time-series clustering approaches depends on the elements of (dis)similarity or distance measures, clustering algorithms and evaluation [56, 57]. Liao [58] summarizes that a majority of time-series clustering methods are adapted from static clustering algorithms with alteration of similarity or prototype extraction function, or transformation that converts dynamic series to obtain static features. Most time series clustering approaches are based on k-means and hierarchical clustering with different specifications of (dis)similarity measures suitable for the problems. However, k-means algorithm variations (e.g., fuzzy c-means) are more compatible to analyse time series of equal length [56, 58, 59]. Hierarchical clustering is more applicable to our dataset of daily market capitalization as not all the firms trade every day. It also requires a distance measure such as Dynamic Time Warping (DTW) distance to generate dissimilarity matrices [51].
Hierarchical clustering method groups objects into tree-based clusters including agglomerative method and divisive approach [60]. The agglomerative tree starts with single object clusters and iteratively groups them into larger clusters by dissimilarity measures. All objects will merge into one cluster unless stop criteria are defined. It will stop if all objects are grouped into one cluster or certain criteria are satisfied. For example, the agglomerative tree continues growing until it gets to the maximum number of clusters. The divisive tree starts with one cluster having all objects and iteratively splitting the cluster until all objects reach single object clusters. The visualized result of hierarchical clustering depicts a binary tree which is constructed by nodes and their children nodes. The children nodes under one parent node are more like each other compared to the children nodes that belong to another parent node. Similarity between clusters is defined in two ways, namely single linkage and complete linkage. The former takes the similarity of the closest pair, whereas the latter takes the similarity of the furthest pair [60]. DTW distance is a popular choice in the context of time-series clustering [50, 56]. DTW compares time series where the timing or the tempo of the variations may vary between the series [61]. However, it is a computationally expensive option which takes multiple approaches of optimization to improve its time and memory efficiency [52].
We follow two steps to conduct hierarchical clustering using DTW distance [61]. The first step is to calculate the distance between time series using the DTW method. It is followed by calculating hierarchical cluster analysis over these dissimilarities. To calculate a DTW distance, considering any two time series to compare, \(X\left( {x_{1} ,x_{2} , \ldots , x_{n} } \right)\) and \(Y\left( {y_{1} ,y_{2} , \ldots , y_{m} } \right)\), the first step is to compute a local cost matrix (lcm), which has all pairwise distances with \(n \times m\) dimensions. \(p\) corresponds to the \(l_{p}\) norm that defines the distance measures used to construct the lcm matrix. As the second step, an optimum path denoted as ϕ = {(1, 1),…,(n, m)} is searched to minimize the alignment between X and Y by iteratively looping through the lcm from lcm(1, 1) to lcm(n, m). For each step, the direction would be identified when the least cost increased under the chosen constraints [62]. The final distance \(DTW_{p} \left( {x, y} \right)\) is computed in Eq. (1) using m ϕ the per-step weighting coefficient and M ϕ the corresponding normalization constant.
We apply the DTW algorithm to all stock prices over the sample time period which are represented as numeric matrices and interpreted row-wise. The main outputs of the DTW algorithm are the minimum global distance between each pair of stock price time series. This distance matrix acts as inputs to enter hierarchical clustering. The hierarchical DTW clustering is conducted based on z-scores normalization with shape-based centroid. Another important decision is to choose the optimal number of clusters when using hierarchical clustering, however, this decision could be subjective. The recommended evaluation methods of clustering performance are to examine the cluster validity indices (CVIs) [63, 64]. There are internal CVIs and external indices which are commonly used in assessing the clustering performance. The internal CVIs are prone to check cluster purity, while the external indices are used to validate the results based on a known accurate clustering result. Table 3 briefly summarizes the commonly used CVIs with their evaluation criteria.
Employing the listed methods, we test a different number of clusters on our data, ranging from two to seven clusters using a R technique proposed by Montero and Vilar [68]. Table 4 summarizes the clustering results. The consensus of two clusters is reached by fulfilling a majority of the CVI indices. The results show 547 firms belong to Cluster 1 with 1072 firms in Cluster 2.
By analysing the extracted members in each cluster, we examine the two clusters by comparing their stock time series patterns (see Fig. 3). A weaker softening trend of stock price is observed in Cluster 1 amid COVID-19 outbreak. The stock prices quickly level off and regain an upward tilt after 23rd March. Thus, these firms seem to be less sensitive to the COVID-19 pandemic. The stock prices in Cluster 2 show a L-shaped movement along the sample period, whereby a steeper decline is observed with a slower rate of recovery. The firms are more likely to be sensitive to the COVID-19 pandemic. Comparing the centroids of the two clusters (see Fig. 4), we observe a K-shaped recovery where different sectors recover at different rates and magnitudes and the path of recovery continues to diverge.

Members of Cluster 1 (left) and Cluster 2 (right)
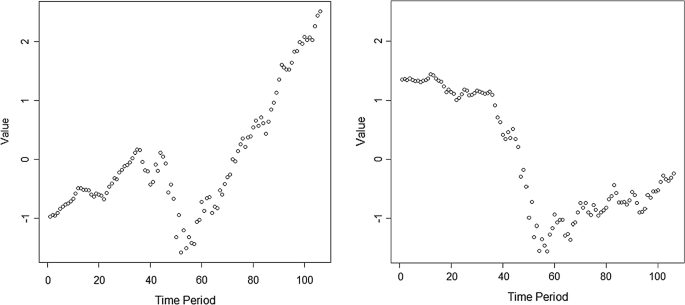
Centroid of Cluster 1 (left) and Cluster 2 (right)
To address the research query, the percentage of firms under the “Slow Recovery Cluster” and the “Better Recovery Cluster” is cross-tabulated with the level of digital transformation, with intensive and less intensive levels following the OECD taxonomy of digital-intensity. The OECD taxonomy categorizes sectors into “high”, “medium–high”, “medium–low” and “low” digital intensity depending on their relative position in the overall economies’ ranking. Quartile rankings is used to measure how a sector has performed against all other sectors in terms of digital intensity. The rankings range from "Top 25%" to "Bottom 25%". The top 25% sectors are assigned to "high", followed by the second highest 25% sectors denoted as “medium–high”. Those with the lowest 25% digital intensity are labelled as “low”, and the second lowest 25% are named “medium–low”. We assigned the sectors in the categories of “low”, “medium–low” and “medium–high” into Group 2 the “less digital intensive” set, whereas the sectors of “high” digital intensity are categorized as “digital intensive” into Group 1. This classification is in line with OECD’s methodology for implementation of the G20 roadmap for digitalisation, which compares sectors of operation that are among the top 25% of digital-intensive sectors versus not (Top Digital Intensive vs Less) [43].Transport equipment and telecommunications are members of the digital intensive sectors, whereas agricultural commodities and chemical products are among less digital intensive industries. Analysis is conducted to validate if the level of digital intensity is related with the two clusters, i.e., “Slow Recovery Cluster” and “Better Recovery Cluster”. The descriptive summary of the slow recovery cluster and the better recovery cluster can be found in Table 5.
Consistent with expectation, a bigger portion of firms (47%) within the highly digitally transformed industries, such as telecommunications, Internet retail and professional services, falls under the “Better Recovery Cluster”, as indicated in Table 5. 80% of the firms in the lower rung, including agriculture, fall in the “Slow Recovery Cluster”. In addition, Pearson \(\chi^{2}\) statistic is used to examine the two-way associations with the number of firms in the cells (\(\chi^{2}\)(1) = 128.51, p < 0.001). We observed that the top industries which have 50% companies or above fall under the “better recovery cluster” including food retail (90%), Internet retail (77%), computer communications (69%) and major telecommunications (50%). All these sectors belong to the “digital intensive” category except for food retail. However, the strong performance of the food retail sector can be explained by the nature of the business. As the pandemic spreads across, the business is expected to operate and continue to provide essential goods to households and communities day by day. However, the urge for food retail to adopt digital transformation is clear because of increased online and mobile sales [69]. In comparison, the industries in the lower rung which has less than 20% of firms under the “better recovery cluster” include electric utilities (14%), movies/entertainment (14%), other transportation (14%), agricultural commodities/milling (12%), apparel/footwear retail (11%), construction materials (10%), water utilities (8%), real estate investment trusts (7%), real estate development (2%) and media conglomerates (0%). All these sectors are of less digital intensity except for the sector of other transportation. However, the financial performance of this sector is largely affected by the demand shock caused by COVID-19 crisis, excess supply, and significant oil price decline and is less likely to be linked to its digital intensity. The results show some directional support toward the relative impact of digital intensity. It indicates the degree of digital transformation (digital intensive, less digital intensive) is a relevant grouping variable which could be further tested in the Phase 2 analysis.
4.2 Phase 2 Results
From the plotted pair of proxies– the NASDAQ index and the daily cumulative Twitter postings on COVID-19, negatively correlated movement of the two proxies is present. Stock prices plummet when tweets about “COVID-19” increase. Instead of testing correlation between proxy variables, based on the results in Phase 1, we adopt VAR model to examine the mutual causality relationship between the daily cumulative Twitter postings on COVID-19 and stock price fluctuation under different levels of digital intensity [34, 70, 71]. One way is to test the effects of posting trends on the stock price fluctuation for each respective group of companies. The other way is to examine for each group of firms if the stock price fluctuation induces or reduces public concerns on COVID-19. We use Granger causality to identify the leading relationship between the stock price fluctuation and the daily cumulative twitter postings on COVID-19. We also investigate the timing and length of the effects. The algorithm is implemented in R (Fig. 5).

NASDAQ Composite (^IXIC) Charts
To ensure the validity of Granger-causality test, we need to validate the stationarity of both time series that enter the analysis because the non-stationarity of one or both time series would cause spurious causality [72]. We employ Augmented Dickey–Fuller (ADF) Test and Kwiatkowski–Phillips–Schmidt–Shin (KPSS) to check stationarity for both time series. The null hypothesis of the former test is that the time series are non-stationary. The null hypothesis for the latter is stationarity to conduct a cross-check. Table 6 presents the ADF and KPSS statistics for the daily cumulative Twitter postings on COVID-19 and the average daily stock price variation for each group of firms. The daily variation is the average of day-on-day price change of the firms in each group. The ADF and KPSS results show that the first-order difference eliminates stationarity for both time series. It also determines the order of integration and time series models [73].
Following the Toda-Yamamoto (TY) procedure, Eq. (2) and (3) are constructed. Yt denotes the average daily stock price variation in percentage. Xt represents the daily cumulative Twitter postings on COVID-19. p denotes the lag order, and ap, bp, cp, dp, are the coefficients of Yt-p and Xt-p with the constant terms a0 and c0. \(u_{t}\) and \(v_{t}\) represent the error terms in Eq. (2) and (3) respectively. The null hypothesis for Eq. (2) is H0: b1 = b2 = … = bp = 0 with the alternative hypothesis HA: 'Not H0'. If H0 can be rejected, X is the Granger-cause of Y. Equation (3) tests Granger causality from the other direction—that is, H0: d1 = d2 = … = dp = 0 and HA: 'Not H0'. Similarly, if H0 could be rejected, Y is the Granger-cause of X. In another word, Eq. (2) is to see if the prior values of X together with Y’s own past values can predict Y better than solely using Y’s own history. Equation (3) is to see if the predictions of X can be better made on its own history values and Y’s past values than the predictions of X based on its own history.
Table 6 shows the first order differencing of X and Y eliminating the unit root, which determines the maximum order of integration as one, denoted I (1). According to the TY procedure, the VAR model uses the levels of the data without differencing. Another consideration for X and Y is to determine the appropriate lag length. According to the information criteria of Akaike Information Criterion (AIC), Hannan Quinn (HQ), Schwarz Criterion (SC) and Final Prediction Error (FPE), a lag of six is deemed appropriate for the model. Toda and Yamamoto [73] point out the advantage of the TY method is to save the cointegration test and avoid pre-test bias. Additionally, we need to ensure no residual serial correlation in the specified VAR model. We conduct a Portmanteau test and find Lag 6 removes residual serial autocorrelation.
The VAR model with Lag 6 is selected and 1 additional lag is added to each equation as the maximum order of integration—I(1). Then, we construct the augmented VAR model for Eq. (2) and Eq. (3). A Wald test is used to test the Granger causality hypothesis whether the coefficients of the first 6 lagged values of X in Eq. (2) and the coefficients of the first six lagged values of Y in Eq. (3) are zero. The coefficient of the 7th lag is not included because it is the additional lagged value to fix the asymptotics and ensure Wald test statistics of asymptotical chi-square distribution. When the null hypothesis of Wald test is rejected, a Granger causality is implied. The results are presented in Table 7.
Table 7 shows that Twitter postings on COVID-19 Granger cause the stock price changes of firms in Group 1 and Group 2. The stock price fluctuation in Groups 1 and 2 also imposes an impact on cumulative Twitter postings on COVID-19. These results show that the fluctuation of stock prices would trigger a swing in market sentiment and vice versa. As a further investigation step, we test the magnitudes and the directions of these impacts using the augmented VAR models with the results in Tables 8 and 9.
As we are interested to differentiate the impact of Twitter postings on stock price fluctuation among the firms of different levels of digital intensity, a detailed investigation of Eq. (2) is made on two groups of firms—one digital intensive (Group 1), the other one less digital intensive (Group 2). Consistent with our prediction, the cumulative Twitter postings are negatively related to the stock price fluctuation of firms in Group 1, lagged by two days. A two-period lag is found with stronger negative impact of Twitter postings on stock price in Group 2. This indicates cumulative Twitter postings would trigger stronger negative changes in stock prices of firms in Group 2 than those in Group 1. It is evident that digital intensity of firms mitigates the negative effect of market sentiments because of largescale unanticipated crisis on stock market performance. When stocks prices plummet amid COVID-19 pandemic, firms with high degree of digital intensity have out-performed the others.
The results of Eq. (3) show the impact of stock price variation on cumulative Twitter postings for firms in Group 1 and those in Group 2. As seen from Table 9, stock price changes cause swings of cumulative Twitter postings in a negative direction for Group 1 and Group 2, lagged by one period. In terms of magnitude of the impact, stock price increase will lead to a deeper decline of cumulative Twitter postings in Group 1. The impact on cumulative Twitter postings is stronger for the firms in Group 1 than for those in Group 2.
5 Discussion
5.1 Contributions to Knowledge, Methodology and Practice
This research has set out to examine how market sentiments affect the stock market performance under COVID-19. Market sentiments are modelled with cumulative social media postings on COVID-19, which reflect the overall consensus about the market as a whole. Performance is operationalised by the stock price differences of firms within the sectors. All sectors under investigation are organized according to OECD Digital-intensity Framework.
Analysis is conducted in two phases. Phase 1 establishes a two-group model on how stock prices adjust to the sudden emergence of the COVID-19 pandemic. Stock prices of a majority of firms across the most digitally advanced sectors have remained resilient when an unexpected crisis puts the market to test, while sectors that lag behind are among the most negatively impacted.
Phase 2 confirms that cumulative Twitter postings on COVID-19 are predictive of stock performance. There is further evidence to demonstrate that the sectoral digital intensity of firms can mitigate the adverse impact of market sentiments induced by largescale unanticipated events. As stock prices dipped amid the pandemic, the digital “have-mores” out-performed the rest and recovered quickly after the crash. Findings in Phase 2 also suggest that stock price changes can in turn influence market sentiments. That is, the market has responded more favourably towards the most digitally advanced firms and sectors and more negatively towards the laggards under crisis.
Governments worldwide have imposed lockdowns in the cities to slowdown the magnitude and speed at which the pandemic is developing. Such lockdowns have led to a near complete standstill of much corporeal economic activities. Yet, certain business trades and consumer purchases have not only continued online, but actually grown considerably. Demand for digital services and portable computing devices have risen as people switch to remote working and learning. Many are envisioning the emergence of a post-COVID-19 ‘new normal’, where there will be a strong prominence of digitalisation. In view of these developments, the market may have given eminence to and greater confidence in firms and sectors that are most digitally advanced as they are in a better position to sustain operations not only amid the pandemic, but also to leverage the full potential in the post-COVID-19 ‘new normal’. Thus, we observe a pronounced gap between the digital “haves” and “have-mores” in their stock market performance.
This study contributes to understanding about how digital intensity moderates the effect of market sentiments on firms’ stock prices, particularly due to largescale unanticipated events such as a pandemic. Researchers acknowledge the importance of alignment between a firm's business and digital strategies [74]. Information technology (IT) strategy and technological investments have been found to influence profitability and the market value of the firm [75]. While extant research has examined the use of technology and organizational performance [76], this study is among the first few to demonstrate how sectors and companies on the digital frontier can give rise to disproportionate gains in the stock market. While past research suggests that the stock market reacts more positively to announcements related to digital investments, such as appointments of chief digital officers [77] or engaging in e-commerce [78], our findings focus on sectoral digitalisation as the potential mitigating circumstances when bad news occurs.
The findings also suggest that people do take recent stock prices into consideration when posting online about COVID-19, and such posting behaviours will in turn drive future stock price changes. However, the magnitude of such effect depends on the level of sectoral digital intensity.
In terms of methodology, while the majority of conventional research have studied the impact of largescale unexpected incidents on stocks using intervention analysis [32] or event studies [33], this study demonstrated the feasibility of using cumulative social media postings on negative events to measure market sentiments, especially on largescale unanticipated events that can affect the stock prices of firms across sectors. This presents researchers with an alternative to quantify market sentiments and expand the research arsenal to incorporate social media trends, which can offer higher explanatory power.
5.2 Limitations and Future Research
This research has some limitations which offer opportunities for future investigation. Firstly, the study looks into how sectoral digital intensity mitigates the impact of negative market sentiments on the stock market, focusing on the period before, during and after the March 2020 COVID-19 stock market crash. It is possible that there is already a gap between the digital ‘Haves’ and ‘Have-mores’ in their stock performance before the crisis. Past research has confirmed that the stock market reacts positively to firms that embrace digital initiatives, such as appointments of newly created chief digital or data officer positions [77] or engaging in e-commerce [78]. Future studies can look into the long-run stock price performance of firms with effective digital strategies.
Secondly, after the March 2020 COVID-19 stock market crash, many of the major stock indices have regained much of their lost territory since early April, and such recovery so far has been fuelled by aggressive stimulus packages rolled out by governments to boost the economy. The resuming of business activities and trade is also underpinning market optimism and rebound. The confounding effects of government intervention and support are hard to capture within the current model. Future research can examine how such government intervention restores public confidence and accelerates the market rebound. Moreover, this research adopts a batch processing methodology. Future research can look into real-time prediction of stock performance using social media streaming [47].
Third, the literature on sectoral digital intensity suggests a large and widening divide among firms within each sector. We did not capture the within sector relative digital intensity in the current study. Future research should compare the digital “haves” and “have mores” within each sector.
Lastly, while the speed of innovation is accelerating economy-wise, not all firms within the same sectors are similarly equipped to respond to new challenges and tap into new opportunities. This research has not looked into the possible causes of the widening divide between sectors in digital intensity. With the entry of new digital start-ups and technology firms and the emergence of new market segments, sectoral boundaries are blurring. Future research may aim to uncover how the various conditions lead to an increasing divide between the “haves” and the “have-mores”. A longitudinal study to identify the changes in digital capabilities within each sector can help reveal the process of such changes.
References
Mazur M, Dang M, Vega M (2021) COVID-19 and the March 2020 stock market crash: evidence from S&P1500. Financ Res Lett 38:1090. https://doi.org/10.1016/j.frl.2020.101690
Bollen J, Mao H, Zeng X (2011) Twitter mood predicts the stock market. J Comput Sci 2(1):1–8. https://doi.org/10.1016/j.jocs.2010.12.007
Huang X, Kuijpers D, Li L, Sha S (2020) Xia C (2020) How Chinese consumers are changing shopping habits in response to COVID-19, McKinsey & Company. McKinsey & Company Accessed 6:2020
Sheth J (2020) Impact of Covid-19 on consumer behavior: Will the old habits return or die? J Bus Res 117:280–283. https://doi.org/10.1016/j.jbusres.2020.05.059
Kshetri N (2020) COVID-19 Meets Big Tech. Computer 53(08):10–13. https://doi.org/10.1109/MC.2020.2996698
Saxena N, Gupta P, Raman R, Rathore AS (2020) Role of data science in managing COVID-19 pandemic. Indian Chem Eng 62(4):385–395. https://doi.org/10.1080/00194506.2020.1855085
Sliwoski G, Kothiwale S, Meiler J, Lowe EW Jr (2013) Computational methods in drug discovery. Pharmacol Rev 66(1):334–395. https://doi.org/10.1124/pr.112.007336
Wong ZSY, Zhou J, Zhang Q (2019) Artificial Intelligence for infectious disease Big Data Analytics. Infect Dis Health 24(1):44–48. https://doi.org/10.1016/j.idh.2018.10.002
Mohamadou Y, Halidou A, Kapen PT (2020) A review of mathematical modeling, artificial intelligence and datasets used in the study, prediction and management of COVID-19. Appl Intell 50(11):3913–3925. https://doi.org/10.1007/s10489-020-01770-9
Wang P, Lu J-A, Jin Y, Zhu M, Wang L, Chen S (2020) Statistical and network analysis of 1212 COVID-19 patients in Henan, China. Int J Infect Dis 95:391–398. https://doi.org/10.1016/j.ijid.2020.04.051
Livadiotis G (2020) Statistical analysis of the impact of environmental temperature on the exponential growth rate of cases infected by COVID-19. PLoS ONE 15(5):e0233875–e0233875. https://doi.org/10.1371/journal.pone.0233875
Menebo MM (2020) Temperature and precipitation associate with Covid-19 new daily cases: A correlation study between weather and Covid-19 pandemic in Oslo. Norway Sci Total Environ 737:139659. https://doi.org/10.1016/j.scitotenv.2020.139659
Bragazzi NL, Dai H, Damiani G, Behzadifar M, Martini M, Wu J (2020) How Big Data and Artificial Intelligence Can Help Better Manage the COVID-19 Pandemic. Int J Environ Res Public Health 17(9):3176. https://doi.org/10.3390/ijerph17093176
Calvino F, Criscuolo C, Marcolin L, Squicciarini M (2018) A taxonomy of digital intensive sectors. OECD Science, Technology and Industry Working Papers. https://doi.org/10.1787/f404736a-en
Sul HK, Dennis AR, Yuan L (2017) Trading on Twitter: using social media sentiment to predict stock returns. Decis Sci 48(3):454–488. https://doi.org/10.1111/deci.12229
Sprenger TO, Tumasjan A, Sandner PG, Welpe IM (2014) Tweets and trades: the information content of stock microblogs. Eur Financ Manag 20(5):926–957. https://doi.org/10.1111/j.1468-036X.2013.12007.x
De Bondt WFM, Thaler R (1985) Does the stock market overreact? J Financ 40(3):793–805. https://doi.org/10.1111/j.1540-6261.1985.tb05004.x
Nofsinger JR (2005) Social mood and financial economics. J Behav Financ 6(3):144–160. https://doi.org/10.1207/s15427579jpfm0603_4
Barrett WB, Heuson AJ, Kolb RW, Schropp GH (1987) The adjustment of stock prices to completely unanticipated events. Financ Rev 22(4):345–354. https://doi.org/10.1111/j.1540-6288.1987.tb01258.x
Shelor RM, Anderson DC, Cross ML (1992) Gaining from loss: property-liability insurer stock values in the aftermath of the 1989 California earthquake. J Risk Insur 59(3):476–488. https://doi.org/10.2307/253059
Lee K-J, Lu S-L, Shih Y (2018) Contagion effect of natural disaster and financial crisis events on international stock markets. J Risk Financ Manag 11(2):16. https://doi.org/10.3390/jrfm11020016
Cam MA, Ramiah V (2014) The influence of systematic risk factors and econometric adjustments in catastrophic event studies. Rev Quant Finan Acc 42(2):171–189. https://doi.org/10.1007/s11156-012-0338-4
Pompian M (2012) Behavioral finance and wealth management: how to build investment strategies that account for investor biases. Wiley
Shehzad K, Liu X, Kazouz H (2020) COVID-19’s disasters are perilous than Global Financial crisis: a rumour or fact? Financ Res Lett 36:101669. https://doi.org/10.1016/j.frl.2020.101669
McTier BC, Tse Y, Wald JK (2013) Do Stock Markets Catch the Flu? J Financ Quant Anal 48(3):979–1000. https://doi.org/10.1017/S0022109013000239
Li Y (2020) Market reactions to past virus scares show stocks may have more to lose. CNBC. https://www.cnbc.com/2020/01/28/market-reactions-to-major-virus-scares-show-stocks-have-more-to-lose.html
Leduc S, Liu Z (2020) The Uncertainty Channel of the Coronavirus. FRBSF. Accessed 30 March 2020
Tooze A (2020) The crisis has brought the economy to a near halt, and left millions of people out of work. But thanks to intervention on an unprecedented scale, a full-scale meltdown has been averted—for now. The Guardian. Accessed 2020 2020
Georgieva K (2020) IMF managing director Kristalina Georgieva's statement following a G20 ministerial call on the coronavirus emergency. International Monetary Fund. Accessed 23 March 2020 2020
Banerji G (2020) Why did stock markets rebound from Covid in record time? Here are five reasons. Wall Street J. Accessed 15 September 2020
Winck B (2020) Cries for more stimulus are overblown and stock investors should stop throwing ‘tantrums’ about it, says a Wall Street chief strategist. Business Insider. Accessed 2020
Box GEP, Tiao GC (1975) Intervention analysis with applications to economic and environmental problems. J Am Stat Assoc 70(349):70–79. https://doi.org/10.1080/01621459.1975.10480264
MacKinlay AC (1997) Event studies in economics and finance. J Econ Lit 35(1):13–39
Liu Y, Peng G, Hu L, Dong J, Zhang Q (2019) Using Google Trends and Baidu Index to analyze the impacts of disaster events on company stock price. Ind Manag Data Syst 120(2):350–365. https://doi.org/10.1108/IMDS-03-2019-0190
Ding D, Guan C, Chan CML, Liu W (2020) Building stock market resilience through digital transformation: using Google trends to analyze the impact of COVID-19 pandemic. Front Bus Res China 14:21. https://doi.org/10.1186/s11782-020-00089-z
Baker M, Wurgler J (2007) Investor Sentiment in the Stock Market. J Econ Perspect 21(2):129–152. https://doi.org/10.2139/ssrn.962706
boyd dm, Ellison NB, (2007) Social network sites: definition, history, and scholarship. J Comput-Mediat Comm 13(1):210–230. https://doi.org/10.1111/j.1083-6101.2007.00393.x
E G, K K Widespread worry and the stock market. In: ICWSM 2010 - Proceedings of the 4th International AAAI Conference on Weblogs and Social Media, Washington, DC, 2010. pp 58–65
Smailović J, Grčar M, Lavrač N, Žnidaršič M (2014) Stream-based active learning for sentiment analysis in the financial domain. Inf Sci 285:181–203. https://doi.org/10.1016/j.ins.2014.04.034
Saini A, Sharma A (2019) Predicting the unpredictable: an application of machine learning algorithms in Indian stock market. Ann Data Sci. https://doi.org/10.1007/s40745-019-00230-7
Baig A, Hall B, Jenkins P, Lamarre E (2020) McCarthy B (2020) The COVID-19 recovery will be digital: A plan for the first 90 days. McKinsey & Company Accessed 14:2020
Paunov C, Planes-Satorra S (2019) How are digital technologies changing innovation?: Evidence from agriculture, the automotive industry and retail. OECD Publishing, OECD Science. https://doi.org/10.1787/67bbcafe-en
OECD (2018) Towards the implementation of the G20 roadmap for digitalisation: skills, business dynamics and competition. Report prepared at the request of the 2017 G20 German Presidency
Neu WA, Brown SW (2005) Forming successful business-to-business services in goods-dominant firms. J Serv Res 8(1):3–17. https://doi.org/10.1177/1094670505276619
Noventum Service Management (2016) Manufacturers’ advanced services: IoT as the key to profitability and growth. White Paper. Accessed 2016
Coreynen W, Matthyssens P, Bockhaven WV (2017) Boosting servitization through digitization: Pathways and dynamic resource configurations for manufacturers. Ind Market Manag 60:42–53. https://doi.org/10.1016/j.indmarman.2016.04.012
Tien JM (2017) Internet of Things, Real-Time Decision Making, and Artificial Intelligence. Ann Data Sci 4(2):149–178. https://doi.org/10.1007/s40745-017-0112-5
Okuda A, Karazhanova A (2020) Digital Resilience Against COVID-19. United Nation ESCAP. Accessed 31 March 2020
Blackburn S, LaBerge L, O’Toole C (2020) Schneider J (2020) Digital strategy in a time of crisis. McKinsey & Company Accessed 22:2020
Sard´a-Espinosa A (2018) Comparing Time-Series Clustering Algorithms in R Using the dtwclust Package
Paparrizos J, Gravano L (2017) Fast and accurate time-series clustering. Acm T Database Syst 42(2):8. https://doi.org/10.1145/3044711
Shi Y, Tian YJ, Kou G, Peng Y, Li JP (2011) Optimization based data mining: theory and applications. Springer
Bordino I, Battiston S, Caldarelli G, Cristelli M, Ukkonen A, Weber I (2012) Web search queries can predict stock market volumes. PLoS ONE 7(7):e40014. https://doi.org/10.1371/journal.pone.0040014
Weng B, Lu L, Wang X, Megahed FM, Martinez W (2018) Predicting short-term stock prices using ensemble methods and online data sources. Expert Syst Appl 112:258–273. https://doi.org/10.1016/j.eswa.2018.06.016
Analytics T (2020) Covid 19—Twitter evolution. Tweet Binder. Accessed 8 May 2020 2020
Aghabozorgi S, Seyed Shirkhorshidi A, Ying Wah T (2015) Time-series clustering – A decade review. Inf Syst 53:16–38. https://doi.org/10.1016/j.is.2015.04.007
Olson DL, Shi Y (2007) Introduction to business data mining. McGraw-Hill/Irwin
Liao TW (2005) Clustering of time series data-a survey. Pattern Recognit 38(11):1857–1874. https://doi.org/10.1016/j.patcog.2005.01.025
Golay X, Kollias S, Stoll G, Meier D, Valavanis A, Boesiger P (1998) A new correlation-based fuzzy logic clustering algorithm for fMRI. Magn Reson Med 40(2):249–260. https://doi.org/10.1002/mrm.1910400211
Hastie T, Tibshirani R, Friedman J (2009) The elements of statistical learning. Springer
Giorgino T (2009) Computing and visualizing dynamic time warping alignments in R: the dtw package. J Stat Softw 31(7):1–24
Giorgino T (2009) Computing and visualizing dynamic time warping alignments in R: the dtw package. J Stat Softw 31(i07):1–24
Arbelaitz O, Gurrutxaga I, Muguerza J, Pérez JM, Perona I (2013) An extensive comparative study of cluster validity indices. Pattern Recognit 46(1):243–256. https://doi.org/10.1016/j.patcog.2012.07.021
Lei Y, Bezdek JC, Chan J, Vinh NX, Romano S, Bailey J (2017) Extending information-theoretic validity indices for fuzzy clustering. IEEE Trans Fuzzy Syst 25(4):1013–1018. https://doi.org/10.1109/TFUZZ.2016.2584644
Rousseeuw PJ (1987) silhouettes: a graphical aid to the interpretation and validation of cluster analysis. J Comput Appl Math 20:53–65. https://doi.org/10.1016/0377-0427(87)90125-7
Saitta S, Raphael B, Smith IFC (eds) (2007) A Bounded Index for Cluster Validity, vol 4571. Machine Learning and Data Mining in Pattern Recognition. MLDM 2007. Lecture Notes in Computer Science. Springer
Kim M, Ramakrishna RS (2005) New indices for cluster validity assessment. Pattern Recogn Lett 26:2353–2363
Montero P, Vilar JA (2014) TSclust: An R Package for Time Series Clustering. J Stat Softw 62(1):1–43
Markenson S (2020) Grocery’s Ecommerce Evolution during COVID-19. Food Marketing Institute. https://www.fmi.org/blog/view/fmi-blog/2020/06/23/grocery-s-ecommerce-evolution-during-covid-19
Tetlock PC (2007) Giving content to investor sentiment: the role of media in the stock market. J Financ 62(3):1139–1168. https://doi.org/10.1111/j.1540-6261.2007.01232.x
Deng S, Huang ZJ, Sinha AP, Zhao H (2018) The interaction between microblog sentiment and stock return: an empirical examination. MIS quart 42(3):895–918
He Z, Maekawa K (2001) On spurious Granger causality. Econ Lett 73(3):307–313. https://doi.org/10.1016/S0165-1765(01)00498-0
Toda HY, Yamamoto T (1995) Statistical inference in vector autoregressions with possibly integrated processes. J Econom 66(1–2):225–250. https://doi.org/10.1016/0304-4076(94)01616-8
Sabherwal R, Sabherwal S, Havakhor T, Steelman Z (2019) How does strategic alignment affect firm performance? the roles of information technology investment and environmental uncertainty. MIS Q 43(2):453–474. https://doi.org/10.25300/misq/2019/13626
Mithas S, Rust RT (2016) How information technology strategy and investments influence firm performance: conjecture and empirical evidence. MIS Q 40(1):223–245. https://doi.org/10.25300/misq/2016/40.1.10
Hanelt A, Firk S, Hildebrandt B, Kolbe LM (2021) Digital M&A, digital innovation, and firm performance: an empirical investigation. Eur J Inf Syst 30(1):3–26. https://doi.org/10.1080/0960085X.2020.1747365
Hendricks KB, Singhal VR (2001) The Long-Run Stock Price Performance of Firms with Effective TQM Programs. Manag Sci 47(3):359–368. https://doi.org/10.1287/mnsc.47.3.359.9773
Subramani M, Walden E (2001) The Impact of E-Commerce Announcements on the Market Value of Firms. Inf Syst Res 12(2):135–154. https://doi.org/10.1287/isre.12.2.135.9698
Author information
Authors and Affiliations
Corresponding author
Ethics declarations
Conflicts of interest
The author declared they have no conflict of interest.
Additional information
Publisher's Note
Springer Nature remains neutral with regard to jurisdictional claims in published maps and institutional affiliations.
Rights and permissions
About this article

Cite this article
Guan, C., Liu, W. & Cheng, J.YC. Using Social Media to Predict the Stock Market Crash and Rebound amid the Pandemic: The Digital ‘Haves’ and ‘Have-mores’. Ann. Data. Sci. 9, 5–31 (2022). https://doi.org/10.1007/s40745-021-00353-w
Received:
Revised:
Accepted:
Published:
Issue Date:
DOI: https://doi.org/10.1007/s40745-021-00353-w