
Abstract
Background
Industrialization has led to more varied and attractive high-calorie foods. Health problems such as obesity and diabetes are partially attributed to eating-related self-regulation difficulties that may be caused by increasingly frequent cues for highly palatable foods. Research studies aim at understanding the factors underlying responses to food cues. This has led to the development of food stimuli databases. However, they present some limitations.
Objectives
This study aimed at providing a controlled set of pictures, including 40 food pictures with high- and low-calorie stimuli, matched with 40 non-food pictures. The second objective was to provide a ready-to-use database with normative data regarding responses and associations between demographic, anthropometric and eating-related characteristics, and picture ratings.
Participants
A sample of 264 participants rated the total set of pictures.
Measures
Attractiveness, arousal and palatability were assessed for each picture, as well as participant’s current type of diet, BMI, hunger levels and eating behaviors (uncontrolled and emotional eating).
Results
Image characteristics (shape, colors, luminance) were comparable between food and matched non-food pictures. Positive correlations were found between hunger levels and attractiveness, arousal and palatability of food. Uncontrolled and emotional eating was positively correlated with high-calorie food palatability, and uncontrolled eating was positively correlated with high-calorie food attractiveness. Participants who did not report any specific diet rated high-calorie foods as more attractive and arousing, whereas vegan and vegetarian participants assessed low-calorie foods as more attractive and palatable.
Conclusion
The Food-Cal controlled set of picture database can be considered as a useful tool for experimental research.
Level of evidence
Level V, cross-sectional descriptive study.
Introduction
Industrialization has led to more varied and attractive high-calorie foods. Researchers partially attribute rising rates of obesity, diabetes and cholesterol problems to eating-related self-regulation difficulties that may be caused by these increasingly frequent cues for highly palatable foods (e.g., [29]). Research also suggests that access to highly palatable foods—when combined with past hedonic deprivation such as restrictive behaviors and/or stressful events—may lead to increased activation of the dopaminergic seeking system, which can increase overeating, emotional eating or binging (e.g., [5, 18, 36]). In response to these increasing health problems, public policies have turned these concerns into a priority [34], and researchers in the fields of physiology, psychology or cognitive neurosciences increased the number of studies related to the factors underlying responses to high-calorie food. In experimental investigations, the visual processing of food appraisal has become a reference [16, 27, 32, 38]. Research studies have even shown a causal relationship between attentional training with food pictures (e.g., increasing attentional bias towards healthy foods or Go/no-go task training in order to increase impulse inhibition towards palatable foods; [23, 43]) and future eating behaviors (healthy eating or ability to reduce food intake during dieting). Indeed it has been shown that food pictures elicit brain responses that are similar to those elicited by real food and that responses towards non-food pictures are distinct from responses towards food pictures. For instance, in a normal-weight sample, food pictures yielded higher orbitofrontal cortex and insula activation in comparison to non-food pictures [24, 33, 44]. At a neural level, several studies also showed distinct processing in response to high- and low-calorie food images [13, 24, 37]. For instance, high-calorie stimuli yielded extensive activation of the medial and dorsolateral prefrontal cortex, thalamus and hypothalamus, whereas low-calorie stimuli yielded significant activation of medial orbitofrontal and primary gustatory cortex. At a psychological level, high-calorie pictures were perceived as more palatable and involved higher levels of desire to eat than low-calorie stimuli [21]. It is, therefore, possible to measure and to develop specific responses towards food cues via food pictures. However, individual differences should be taken into account as they can affect brain responses [4]. For example, the type of diet can alter neural and behavioral responses to food images [19], in particular in vegetarians and vegans [39].
Some databases of food pictures have been developed: Foodcast Research Image Database (FRIDa; [11]); Food-pics [4], Full4Health (F4H; [8]) and the Open Library of Affective Foods (OLAF; [30]). They offer a wide range of food pictures categorized into subcategories (vegetables, meat, natural food, artificial food, rotten food…). However, they present some methodological limitations.
A first limitation concerns the pictures’ caloric content. Although a number of studies referred to the caloric content [20, 25], the methodology used to distinguish high- versus low-calorie food pictures was unclear in the published databases. As in other studies based on food pictures ([14, 31, 35, 37]), most of these databases included non-food objects (except F4H), but none matched the food pictures with non-food pictures while controlling for their visual characteristics. Therefore, different potential confounders such as pictures’ perceptual characteristics (shape of the main object, dominant colors, global luminance) may drive the responses toward food vs. non-food pictures and affect attractiveness and arousal judgments. Furthermore, the choice to create a large set of pictures is interesting (N = 883 pictures in Food-pics; N = 877 in FRIDa; N = 370 in F4H; N = 132 in OLAF), but leads to certain validation problems. For instance, during the rating phase, each participant cannot reliably evaluate every picture given the size of the database. Therefore, in these studies, each participant only rated a randomized subset of pictures. Hence, each image was rated by a relatively small sample of participants (in Food-pics: M = 48.8, SD = 22.9; in FRIDa: M = 18.86, SD = .96; in F4H: high-calorie M = 72, SD = 13, low-calorie M = 77, SD = 10). In sum, previous databases did not match food with non-food pictures and only had a small number of participants rate each picture.
Past research has shown that high- and low-calorie foods generate different brain activations and behaviors (e.g., [13, 24]). We, therefore, developed two categories of food pictures: high- and low-calorie pictures. We also added matched non-food pictures in order to control for the effects of picture characteristics other than the content, for example color or luminance. As suggested by Knebel and colleagues [26] for controlled image databases, we also controlled for picture features in order to make sure that the observed effects would follow from the parameter of interest (category of picture) rather than from low-level physical features such as luminance or color. Indeed, these low-level features may affect attractiveness and perception of object characteristics. For example, in a study researchers showed that picture luminance affected the perception of food freshness and hence behaviors towards these foods can differ according to perceived freshness [1]. In another study, researchers showed the impact of color on consumption [15].
The main objective of the current study was to develop a complementary controlled database with a smaller set of pictures, but well controlled in terms of perceptual equivalence between high-, low-calorie and non-food control stimuli, attractiveness, arousal and palatability, all rated by all the participants. The second objective was to provide researchers with a ready-to-use database with normative data regarding responses and associations between demographic (age, gender), anthropometric (Body Mass Index) and eating-related characteristics (hunger, type of diet, eating behaviors), and picture ratings.
The Food-Cal database includes 80 stimuli composed of 40 pictures of food with high- and low-calorie content (HC vs. LC) and 40 matched non-food pictures.
Methods
Stimuli
Images were edited following the procedures later detailed in the data analysis sub-section. The database comprises 80 pictures divided into two categories: food (40 images) and matched non-food-pictures (40 images). Food items are subdivided into high-calorie foods (e.g., rolled meat sausage, churros; 20 images) and low-calorie foods (e.g., tomato, apple; 20 images) with 10 pictures depicting sweet (e.g., candies or kiwi fruit) and savory (e.g., French fries or green beans) food in each subcategory. Food images could include single (e.g., one hot-dog, one kiwi fruit) or several items (e.g., two slices of melon), as well as mixed dishes (e.g., vegetarian fried Asian-dish with beans, carrot and broccoli). A nutritionist-dietician assessed the caloric content of each food picture to validate the defined categories (high-calorie = HC vs. low-calorie = LC). Forty neutral (non-food) pictures were matched to each of the 40 food pictures based on the following criteria: global shape, range of colors, luminance and resolution of the pictures. All images were selected from a commercial database available on the Internet and can be freely sent by the first author: http://francais.istockphoto.com/.
Participants
Participants were recruited for the validation experiment via an advertisement posted on a social network website with a link towards the study which was accessible for response for 1 week. Participants who took part in the study during that week were volunteers. No gratification was given to participants. In total, 269 participants completed the online study.
Procedure
The experiment was carried out in accordance with The Code of Ethics of the World Medical Association (Declaration of Helsinki) for experiments involving humans. First, participants gave their informed consent to take part in this study. In order to validate the database, participants completed the survey online using Qualtrics. The survey was divided into three main parts comprising the assessment of eating habits, the evaluation of the pictures’ attractiveness, arousal and palatability and the Three-Factor Eating Questionnaire (TFEQ-R21; [6]). The completion of the survey lasted approximately 30 min.
Measures
Eating habits and hunger levels
The first part of the survey comprised four questions developed for the purpose of this study assessing participants’ hunger and eating habits:
-
(a)
« How hungry are you right now?», rated from (1) «not at all» to (7) «extremely» (Likert scale).
-
(b)
«When was your last meal/snack?», rated from (1) «less than 1 h» to (3) «more than 3 h» (nominal scale).
-
(c)
«It was»: a snack; breakfast; lunch; afternoon tea; dinner (nominal scale).
-
(d)
«Are you following a diet in which you are not allowed to eat one of these products?»: animal products; meat; pork only; sugar products; fat products (nominal scale). In this article, we use the term “dieters” when referring to those who selected one of these categories. This means that the “dieters” are those who exclude certain categories of food. It does not refer to dieting under medical prescription. We refer to vegetarians when they exclude meat from their diet, and we refer to “vegans” when they exclude any animal products (e.g., eggs, cheese…).
Picture rating
In this part, participants were asked to rate the 80 pictures based on the three dimensions described below. The images were randomly displayed and stayed on the screen until the participants gave their responses. The responses were given by selecting the chosen rating with the mouse. The following responses were studied in order to assess useful food-related picture effects [2]:
-
(a)
Attractiveness. This dimension assessed how an item appears to be attractive. Only the extremes were labelled: (1) «Not attractive at all» and (7) «very attractive» (Likert scale in seven points).
-
(b)
Arousal. Five symbolic characters depicting different degrees of arousal were displayed. Participants had to choose among the five characters from «quiet» to «excited».
-
(c)
Palatability (only for food pictures). The statement was: «How much would you like to eat what is depicted on the photograph?», rated from (1) «not at all» to (7) «extremely» (Likert scale in seven points).
Eating behaviors
Participants completed the Three-Factor Eating Questionnaire-Revised, composed of 21 items (TFEQ-R21; [6]; French version by [9]). This questionnaire includes three dimensions: (a) cognitive restraint (six items; e.g., «I don’t eat some foods because they make me fat»), (b) uncontrolled eating (nine items; e.g., «sometimes, when I start eating, I just can’t seem to stop») and (c) emotional eating (six items; e.g., «When I feel sad, I often eat too much»). According to these authors [6], cognitive restraint (CR) refers to a deliberate restriction of food intake aiming at controlling body weight or increasing weight loss. Uncontrolled eating (UE) refers to the tendency to eat more than needed due to a loss of control over intake. Emotional eating (EE) refers to overeating triggered by dysphoric mood. Internal-consistency coefficients (Cronbach’s α) for each of the three scales were satisfactory (CR: .82; UE: .93; EE: .85). We calculated the mean scores for each subscale which can range from 1 to 4. This questionnaire aimed at assessing the relationship between food image ratings and eating behaviors.
At the end of the survey, participants completed demographic and anthropometric information: age, gender, height, weight, occupation and educational level.
Data analyses
To provide future users a clear and normative food database, we performed the following analyses:
-
(a)
Image characteristics Original photographs were of different sizes. We used MatLab R2009b (The Mathworks, Inc. Natick, USA) to crop, rotate and resize all images to a final size of 500 × 500 pixels (e.g., Fig. 1). Images were converted from RGB to CIE 1976 L*a*b* space. Dimensions of the L*a*b* space include L for lightness and a and b for the color-opponent dimensions (red/green, blue/yellow). Values for lightness can range from 0 to 100. Values for the color-opponent dimensions can range from − 128 to 127 with green and yellow having negative values. In CIE L*a*b* space a white screen has a value (100, 0, 0). As shown in Fig. 1, images could include background and shadows. Because pixels contribute to lightness when the image is shown on a screen, we estimated lightness over the entire image. However, because background pixels were not informative when estimating chromatic content of food or non-food images, we estimated a and b values after removing the background pixels.
Fig. 1 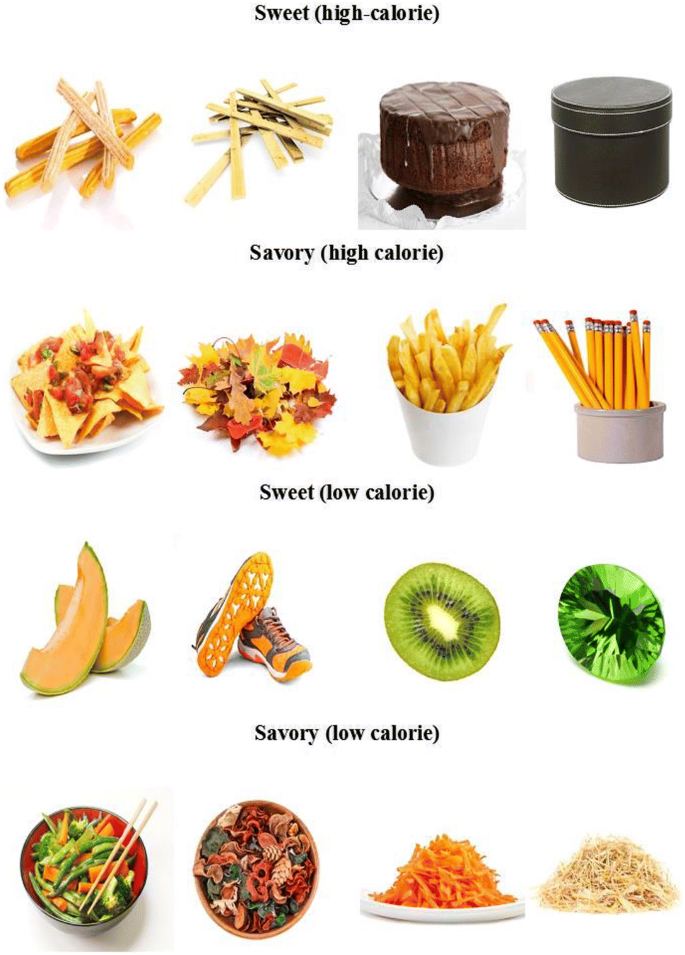
Sample images from the two food picture categories (HC/LC) with their matched neutral object photos
To control perceptual equivalence between food and neutral (non-food) items we used the structural similarity index (SSIM) defined by Wang et al. [45]. Unlike average estimates of image characteristics, the SSIM compares the luminance, contrast and structural characteristics of two images on a pixel-wise basis. It is amongst the best choices to evaluate how close two images are. Two identical images have a SSIM of 1. For example, the churros and wood plank shown in Fig. 1 have SSIM values of .96, .77 and .83 for their luminance, contrast and structural components, respectively. They are thus considered as being very similar concerning these characteristics. Table 1 gives the mean values for the position in L*a*b* space as well as SSIM measures for our four groups of food items and their matched non-food image.
Table 1 Image characteristics descriptive statistics: means and standard deviations of image characteristics (L*a*b*) and similarity index (SSIM) -
(b)
Correlational analyses (Pearson’s correlation tests) were performed to assess the relations between demographic, anthropometric, eating-related and behavioral characteristics (age, BMI, hunger level and eating behaviors) and the attractiveness, arousal and palatability of each image category. Bonferroni correction was used to control for multiple correlation testing. Correlations were thus considered significant for a p value < .008.
-
(c)
Analyses of variance were performed in order to analyze the impact on picture ratings of the variables included in the study in order to give information for future studies on the variables that need to be controlled.
-
Picture ratings The effects of the pictures’ categories on the different dimensions (attractiveness, arousal, palatability) were assessed by means of three separate analyses of variance (ANOVA). Each ANOVA included two within-subject factors: the image type (food vs. non-food) and the caloric content (HC vs. LC).
-
Influence of diet The effects of the type of diet (absence of diet, fat-free, sugar-free, pork-free, vegan or vegetarian) on attractiveness, arousal and palatability ratings were assessed through additional ANOVAs including the diet type as between-subject factor (i.e., Diet × Type × Caloric content).
-

The normality of the distributions and the homogeneity of the variances were tested before the analyses using Kolmogorov–Smirnov and Lilliefors, and Bartlett’s tests, respectively.
Results
Sample characteristics
A total of 269 native French speakers completed the survey (86.62% female). One participant was excluded because the age was inferior to 18 and we did not have parental informed consent. Two other participants were excluded on the basis of their age because they were outside the age range with more than 2 standard deviations above the mean age of 24.2. The age range for the subsequent statistical analyses was, therefore, 18–50 years. Two other participants were excluded as they were outside the Body Mass Index (BMI = kg/m2) range with more than 2 standard deviations above the mean BMI of 23.01. The final sample thus included 264 participants. Table 2 shows the demographic characteristics and eating behavior information of the sample.
Correlational analyses
Hunger was positively correlated with attractiveness (r = .207, p = .001), arousal (r = .238, p < .001) and palatability (r = .308, p < .001) of the food pictures. When hungry, participants also rated the LC-pictures as more palatable (r = .170, p = .006). There were also marginal negative correlations between age and HC-picture attractiveness (r = − .118, p = .056), and palatability (r = − .120, p = .052) (Table 3).
The emotional eating subscale score was positively correlated with HC-picture palatability ratings (r = .199, p = .001). The scores on the uncontrolled eating subscale correlated positively with HC-picture attractiveness (r = .175, p = .004), arousal (r = .150, p = .015), and palatability (r = .278, p < .001) (Table 3).
Picture rating
The results of the three separate analyses of variance (ANOVAs) for attractiveness, arousal and palatability scores including the type of stimuli (food vs. non-food) and the caloric content (HC vs. LC) are shown in Table 4.
Attractiveness
The ANOVA showed a significant main effect of picture type on the attractiveness for food compared to non-food-items (F(1, 263)= 562.43, p < .001, \(\eta^{2}_{p}\) .68). Planned comparison showed that HC-pictures were not considered as more attractive than LC-pictures (F(1, 263) = 3.80, p = .052).
Arousal
The ANOVA showed a significant main effect of picture type on higher arousal rating for food compared to non-food-pictures (F(1, 263) = 282.67, p < .001, \(\eta^{2}_{p}\) .52). The ANOVA also showed a significant main effect of caloric content: HC-pictures were rated as more arousing than LC-pictures (F(1, 263) = 11.95, p < .001, \(\eta^{2}_{p}\) .04). There was a significant interaction between picture type and calorie content (F(1, 263) = 84.26, p < .001, \(\eta^{2}_{p}\) .24). Planned comparisons showed that HC-pictures were rated as more arousing than LC-pictures (F(1, 263) = 45.58, p < .001).
Palatability
The ANOVA did not show any significant effect of caloric content. HC and LC-pictures did not differ significantly in terms of palatability (F(1, 263) = .157, p > .05).
Influence of type of diet
The term “diet” in this study refers to the exclusion of certain foods such as meat or sugar. This variable aimed at controlling for the effect of food exclusion on picture ratings. The results of the three separate ANOVAs performed on each measure with diet (no diet vs. dieters vs. vegetarians), Type (food vs. matched non-food) and Caloric content (HC vs. LC) as predicted factors are shown in Table 4.
Attractiveness
The ANOVA showed a significant interaction between caloric content and diet (F(2, 261) = 3.99, p < .05, \(\eta^{2}_{p}\) = .03). There was also a significant interaction between picture type and calorie content (F(1, 261) = 15.53, p < .001, \(\eta^{2}_{p}\) = .06). Finally, results showed a significant interaction effect between picture type, caloric content and diet (F(2, 261) = 3.91, p < .05, \(\eta^{2}_{p}\) = .03). All the other interactions were not significant. Planned comparisons showed that participants not following a specific diet rated HC-pictures as more attractive than LC-pictures (F(1, 261) = 8.07, p < .01). Vegetarian and vegan participants rated LC-pictures as more attractive than HC-pictures (F(1, 261) = 4.66, p < .05). There was no significant difference regarding palatability among the dieters (F(1, 261) = .50, p > .05).
Arousal
The ANOVA showed a significant interaction between picture type and caloric content (F(1, 261) = 29.51, p < .001, \(\eta^{2}_{p}\) = .10), and a marginal interaction between picture type, caloric content and diet (F(2, 261) = 2.62, p = .075, \(\eta^{2}_{p}\) = .02). Post-hoc tests showed that participants who were not following a specific diet rated HC-pictures as more arousing than LC-pictures (p < .001). In contrast, the vegetarians and vegans were not more aroused by HC than by LC food pictures (p > .09).
Palatability
ANOVA showed a significant effect of caloric content (F(1, 261) = 5.82, p < .05). There was a significant interaction between caloric content and diet (F(2, 261) = 5.17, p < .01, \(\eta^{2}_{p}\) = .04). Planned comparisons showed that HC and LC-pictures did not differ significantly in terms of palatability among dieters (F(1, 261) = .99, p > .05) and participants who were not following a specific diet (F(1, 261) = 1.48, p > .05). In contrast, vegetarians and vegans rated LC-pictures as more palatable than HC-pictures (F(1, 261) = 8.03, p < .01).
Discussion
This study presents the development of a controlled food picture database including 80 food and non-food pictures matched in terms of shape, colors and size. Food pictures comprise high- and low-calorie food stimuli. Previous databases offered a wide range of pictures, but without matched controls on these dimensions. Therefore, our main goal was to provide a controlled database. The secondary aim was to analyze the impact of demographic, anthropometric and eating-related variables on picture ratings of attractiveness, arousal and palatability, in order to give information on the variables that need to be controlled for in future studies. We also included analyses of individual differences in demographic, anthropometric and eating-related variables, as well as image characteristics.
The study was carried out on a sample of 264 French participants. Regarding image type, food pictures were rated as more attractive and arousing than non-food pictures. This implies that the matched non-food items can effectively be used as neutral control stimuli in comparison with food items. In line with previous studies [13, 24], participants also rated high-calorie food pictures as more arousing and attractive compared to low-calorie pictures which corroborates findings showing that high- and low-calorie food stimuli activate different neural areas (e.g., [40]). However, in this study, no difference was shown in measures of palatability between high- and low-calorie food pictures, even if there were differences in attractiveness ratings. This result may come from the fact that attractiveness is more associated with the desire to eat and palatability with the likability of the foods presented on the photographs. This result differs from a recent study [21] showing that HC-pictures were perceived as more palatable than LC-pictures. This difference could be explained by a confounding factor: level of hunger. The more the participants are hungry, the more they are attracted and find HC-pictures palatable [17]. It has been shown that hunger increases brain response to the sight of food pictures in reward areas [42]. In our study, most participants were not very hungry (M = 3.01, SD = 1.73 on a 1 to 7 scale). This may have influenced the results on palatability. The more the participants were hungry the more they rated HC-pictures as attractive, arousing and palatable. Hunger also correlated with LC-pictures in terms of palatability. As for age, the older the participants were, the lower they rated attractiveness and palatability of HC-pictures. As in other picture database studies, the BMI did not affect picture ratings of attractiveness or palatability [4, 11]. The results also showed that emotional eating was positively correlated with HC-picture palatability and that uncontrolled eating was associated with HC-pictures’ attractiveness and arousal. These results are in line with previous studies showing that when individuals feel stressed they tend to eat more high-calorie food [12, 41], and participants who tend to eat when they feel aversive emotions are also those who are the most impulsive towards food stimuli, particularly high-calorie foods [28].
Regarding the influence of diet on picture ratings, participants without any specific diet rated HC-pictures as more attractive and arousing. This effect may be due to the positive association between HC-food and positive sensations as shown in previous studies on human brain response to HC-foods (e.g., [24]). Baillene [3] highlighted that HC-food stimuli activate the corticostriatolimbic reward circuits and impact affect and arousal. However, as we have seen above, individual differences, such as diet choices can affect neural responses to foods [4]. Previous studies showed that vegetarians, in both implicit and explicit measures, had more positive attitudes toward vegetables than towards meat [22]. Similarly, in the current study, vegan/vegetarian participants rated LC-pictures as more attractive and palatable. In the present database, most of the high-calorie items were sugar, fatty and meat foods while low-calorie food was represented by vegetables or fruits. Therefore, the results here presented are in line not only with past research studies on vegan/vegetarian participants, but also reflect the over-representation of vegetables in the low-calorie category and meat in the high-calorie category in the present database that seems to discriminate the effect of diet.
Some limitations must be underlined. First, the correlations were significant but weak. Second, our study was carried out on a relatively small sample (N = 264), although the number of participants rating all the pictures was higher than in past research studies. Third, age range was only 18–50 years (M = 24.20, SD = 6.69). Therefore, the current study does not present any information on younger or older populations. Fourth, the sample came from the general population. A complementary study would be needed to assess the specificities of clinical population ratings of these pictures. Fifth, the female portion of the sample was particularly high (86.62%). This variable needs to be taken into account because some studies report more craving and restrained eating in women [7, 10]. This is also important for future studies which could involve clinical populations (such as those with eating disorders which could influence the characteristics of pictures used). Furthermore, the use of a French population is a factor that needs to be taken into account if future studies are carried out in various cultural settings. Another limitation refers to the categories of dieting. In the current study, we only assessed the exclusion of certain types of food (meat, sugar…), but we did not assess participants with specifically prescribed diets.
To conclude, even though there are certain limitations to this study, the database developed appears to be a useful tool for future research studies in the field of eating behaviors. It may allow researchers to select a small, controlled and ready-to-use database for experimental research in this domain. It will also enable to study food perception in comparison with matched non-food items. The total image set is freely available by sending your request to the first author. We provide normative data on image characteristics as well as individual differences in demographic anthropometric and eating-related variables that researchers may take into account when analyzing their own data.
References
Arce-Lopera C, Masuda T, Kimura A, Wada Y, Okajima K (2013) Luminance distribution as a determinant for visual freshness perception: evidence from image analysis of a cabbage leaf. Food Qual Preferences 27:202–207
Ares G, Varela P (2018) Methods in consumer research, volume 2: alternative approaches and special applications. Elsevier, Cambridge
Balleine BW (2005) Neural bases of food-seeking: affect, arousal, and reward in corticostriatolimbic circuits. Physiol Behav 86:717–730
Blechert J, Meule A, Busch NA, Ohla K (2014) Food-pics: an image database for experimental research on eating and appetite. Front Psychol 5:617. https://doi.org/10.3389/fpsyg.2014.00617
Boggiano MM, Chandler PC, Viana JB, Oswald KD, Maldonado CR, Wauford PK (2005) Combined dieting and stress evoke exaggerated responses to opioids in binge-eating rats. Behav Neurosci 119:1207–1214
Cappelleri JC, Bushmakin AG, Gerber RA, Leidy NK, Sexton CC, Lowe MR, Karlsson J (2009) Psychometric analysis of the Three-Factor Eating Questionnaire-R21: results from a large diverse sample of obese and non-obese participants. Int J Obes 33:611–620. https://doi.org/10.1038/ijo.2009.74
Cepeda-Benito A, Fernandez MC, Moreno S (2003) Relationship of gender and eating disorder symptoms to reported cravings for food: construct validation of state and trait craving questionnaires in Spanish. Appetite 40(1):47–54. https://doi.org/10.1016/S0195-6663(02)00145-9
Charbonnier L, van Meer F, van der Laan LN, Viergever MA, Smeets PA (2016) Standardized food images: a photographing protocol and image database. Appetite 96:166–173. https://doi.org/10.1016/j.appet.2015.08.041
de Lauzon B, Romon M, Deschamps V, Lafay L, Borys JM, Karlsson J et al (2004) The Three-Factor Eating Questionnaire-R18 is able to distinguish among different eating patterns in a general population. J Nutr 134:2372–2380
Dinkel A, Berth H, Exner C, Rief W, Balck F (2005) German version of the Restraint Scale for the assessment of restrained eating. Diagnostica 51(2):67–74
Foroni F, Pergola G, Argiris G, Rumiati RI (2013) The FoodCast research image database (FRIDa). Front Hum Neurosci 7:51. https://doi.org/10.3389/fnhum.2013.0005
Foster MT, Warne JP, Ginsberg AB, Horneman HF, Pecoraro NC, Akana SF, Dallman MF (2009) Palatable foods, stress, and energy stores sculpt corticotropin-releasing factor, adrenocorticotropin, and corticosterone concentrations after restraint. Endocrinology 150(5):2325–2333. https://doi.org/10.1210/en.2008-1426
Frank S, Laharnar N, Kullmann S, Veit R, Canova C, Hegner YL, Fritsche A, Preissl H (2010) Processing of food pictures: influence of hunger, gender, and calorie content. Brain Res 1350:159–166. https://doi.org/10.1016/j.brainres.2010.04.030
Führer D, Zysset S, Stumvoll M (2008) Brain activity in hunger and satiety: an exploratory visually stimulated fMRI study. Obesity 16:945–950
Genschow O, Reutner L, Wänke M (2012) The color red reduces snack food and soft drink intake. Appetite 58:699–702
Giel KE, Friederich H-C, Teufel M, Hautzinger M, Enck P, Zipfel S (2011) Attentional processing of food pictures in individuals with anorexia nervosa: an eye-tracking study. Biol Psychiatry 69:661–667. https://doi.org/10.1016/j.biopsych.2010.09.047
Goldstone AP, Prechtl de Hernandez CG, Beaver JD, Muhammed K, Croese C, Bell G, Durighel G, Hughes E, Waldman A, Frost G, Bell JD (2009) Fasting biases brain reward systems towards high-calorie foods. Eur J Neurosci 30(8):1625–1635. https://doi.org/10.1111/j.1460-9568.2009.06949.x
Hagan MM, Chandler PC, Wauford PK, Rybak RJ, Oswald KD (2003) The role of palatable food and hunger as trigger factors in an animal model of stress induced binge eating. Int J Eat Disord 34:183–197
Hoffman SR, Stallings SF, Bessinger RC, Brooks GT (2013) Differences between health and ethical vegetarians. Strength of conviction, nutrition knowledge, dietary restriction, and duration of adherence. Appetite 65:139–144. https://doi.org/10.1016/j.appet.2013.02.009
Holsen LM, Lawson EA, Christensen K, Klibanski A, Goldstein JM (2014) Abnormal relationships between the neural response to high- and low-calorie foods and endogenous acylated ghrelin in women with active and weight-recovered anorexia nervosa. Psychiatry Res Neuroimaging 223:94–103. https://doi.org/10.1016/j.pscychresns.2014.04.015
Houben K, Roefs A, Jansen A (2012) Guilty pleasures II: restrained eaters’ implicit preferences for high, moderate, and low-caloric food. Eat Behav 13:275–277. https://doi.org/10.1016/j.eatbeh.2012.03.007
Houwer JD, De Bruycker ED (2007) Implicit attitudes towards meat and vegetables in vegetarians and nonvegetarians. Int J Psychol 42(3):158–165. https://doi.org/10.1080/00207590601067060
Kakoschke N, Kemps E, Tiggemann M (2014) Attentional bias modification encourages healthy eating. Eat Behav 15:120–124. https://doi.org/10.1016/j.eatbeh.2013.11.001
Killgore WD, Young AD, Femia LA, Bogorodzki P, Rogowska J, Yurgelun-Todd DA (2003) Cortical and limbic activation during viewing of high- versus low-calorie foods. Neuroimage 19:1381–1394. https://doi.org/10.1016/S1053-8119(03)00191-5
Killgore WD, Yurgelun-Todd DA (2010) Sex differences in cerebral responses to images of high- versus low-calorie food. NeuroReport 21:354–358. https://doi.org/10.1097/WNR.0b013e32833774f7
Knebel JF, Toepel U, Hudry J, LeCoutre J, Murray MM (2008) Generating controlled image sets in cognitive neuroscience research. Brain Topogr 20:284–289
Kroemer NB, Krebs L, Kobiella A, Grimm O, Pilhatsch M, Bidlingmaier M, Zimmermann US, Smolka MN (2013) Fasting levels of ghrelin covary with the brain response to food pictures. Addict Biol 18:855–862. https://doi.org/10.1111/j.1369-1600.2012.00489.x
Meule A, Lutz A, Vögele C, Kübler A (2012) Women with elevated food addiction symptoms show accelerated reactions, but no impaired inhibitory control, in response to pictures of high-calorie food-cues. Eat Behav 13(4):423–428. https://doi.org/10.1016/j.eatbeh.2012.08.001
Meule A, Vögele C (2013) The psychology of eating. Front Psychol 4:215. https://doi.org/10.3389/fpsyg.2013.00215
Miccoli L, Delgado R, Guerra P, Versace F, Rodríguez-Ruiz S, Fernández-Santaella MC (2016) Affective pictures and the open library of affective foods (OLAF): tools to investigate emotions toward food in adults. PLoS ONE 11(8):e0158991. https://doi.org/10.1371/journal.pone.0158991
Morris JS, Dolan RJ (2001) Involvement of human amygdala and orbitofrontal cortex in hunger-enhanced memory for food stimuli. J Neurosci 21:5304–5310
Murdaugh DL, Cox JE, Cook EW, Weller RE (2012) fMRI reactivity to high-calorie food pictures predicts short- and long-term outcome in a weight-loss program. Neuroimage 59:2709–2721. https://doi.org/10.1016/j.appet.2011.11.029
Nijs IM, Franken IH, Muris P (2008) Food cue-elicited brain potentials in obese and healthy-weight individuals. Eat Behav 9(4):462–470. https://doi.org/10.1016/j.eatbeh.2008.07.009
Payson S (1994). Using historical information to identify consumer concerns about food safety, vol 1835. Technological Bulletin, US Department of Agriculture, pp 1–19
Porubska K, Veit R, Preissl H, Fritsche A, Birbaumer N (2006) Subjective feeling of appetite modulates brain activity: an fMRI study. Neuroimage 32:1273–1280. https://doi.org/10.1016/j.neuroimage.2006.04.216
Rogers PJ, Hill AJ (1989) Breakdown of dietary restraint following mere exposure to food stimuli: interrelationships between restraint, hunger, salivation, and food intake. Addict Behav 14:387–397
Siep N, Roefs A, Roebroeck A, Havermans R, Bonte ML, Jansen A (2009) Hunger is the best spice: an fMRI study of the effects of attention, hunger, and calorie content on food reward processing in the amygdala and orbitofrontal context. Behav Brain Res 198:148–158. https://doi.org/10.1016/j.bbr.2008.10.035
Simmons WK, Martin A, Barsalou LW (2005) Pictures of appetizing foods activate gustatory cortices for taste and reward. Cereb Cortex 15:1602–1608. https://doi.org/10.1093/cercor/bhi038
Stockburger J, Renner B, Weike AI, Hamm AO, Schupp HT (2009) Vegetarianism and food perception. Selective visual attention to meat pictures. Appetite 52(2):513–516. https://doi.org/10.1016/j.appet.2008.10.001
Toepel U, Knebel JF, Hudry J, le Coutre J, Murray MM (2009) The brain tracks the energetic value in food images. Neuroimage 44(3):967–974. https://doi.org/10.1016/j.neuroimage.2008.10.005
Tryon MS, Carter CS, de Cant R, Laugero KD (2013) Chronic stress exposure may affect the brain’s response to high calorie food cues and predispose to obesogenic eating habits. Physiol Behav 120:233–242. https://doi.org/10.1016/j.physbeh.2013.08.010
Van der Laan LN, de Ridder DT, Viergever MA, Smeets PA (2011) The first taste is always with the eyes: a meta-analysis on the neural correlates of processing visual food cues. Neuroimage 55(1):296–303. https://doi.org/10.1016/j.neuroimage.2010.11.055
Van Koningsbruggen GM, Veling H, Stroebe W, Aarts H (2014) Comparing two psychological interventions in reducing impulsive processes of eating behaviour: effects on self-selected portion size. Br J Health Psychol 19:767–782. https://doi.org/10.1111/bjhp.12075
Wang Z, Bovik AC, Sheikh HR, Simoncelli EP (2004) Image quality assessment: from error visibility to structural similarity. IEEE Trans Image Process 13(4):600–612. https://doi.org/10.1109/tip.2003.819861
Wang GJ, Volkow ND, Telang F, Jayne M, Ma J, Rao M, Zhu W, Wong CT, Pappas NR, Geliebter A, Fowler JS (2004) Exposure to appetitive food stimuli markedly activates the human brain. Neuroimage 21(4):1790–1797. https://doi.org/10.1016/j.neuroimage.2003.11.026
Author information
Authors and Affiliations
Corresponding author
Ethics declarations
Conflict of interest
The authors declared that they had no conflicts of interest with respect to their authorship or the publication of this article.
Ethical approval
All procedures performed in the study were in accordance with the ethical standards of the institutional research committee and with the 1964 Helsinki declaration and its later amendments.
Informed consent
All participants signed an informed consent before completing the study.
Additional information
Publisher's Note
Springer Nature remains neutral with regard to jurisdictional claims in published maps and institutional affiliations.
This article is part of topical collection on Food and Addiction.
Rights and permissions
About this article

Cite this article
Shankland, R., Favre, P., Corubolo, D. et al. Food-Cal: development of a controlled database of high and low calorie food matched with non-food pictures. Eat Weight Disord 24, 1041–1050 (2019). https://doi.org/10.1007/s40519-019-00687-8
Received:
Accepted:
Published:
Issue Date:
DOI: https://doi.org/10.1007/s40519-019-00687-8