
Abstract
Background
Combination therapies with cetuximab (Erbitux®; Merck Serono UK Ltd) and panitumumab (Vectibix®; Amgen UK Ltd) are shown to be less effective in adults with metastatic colorectal cancer who have mutations in exons 2, 3 and 4 of KRAS and NRAS oncogenes from the rat sarcoma (RAS) family.
Objective
The objective of the study was to estimate the cost effectiveness of these drugs in patients with previously untreated RAS wild-type (i.e. non-mutated) metastatic colorectal cancer, not eligible for liver resection at baseline, from the UK National Health Service and Personal Social Services perspective.
Methods
We constructed a partitioned survival model to evaluate the long-term costs and benefits of cetuximab and panitumumab combined with either FOLFOX (folinic acid, fluorouracil and oxaliplatin) or FOLFIRI (folinic acid, fluorouracil and irinotecan) vs. FOLFOX or FOLFIRI alone. The economic analysis was based on three randomised controlled trials. Costs and quality-adjusted life-years were discounted at 3.5% per annum.
Results
Based on the evidence available, both drugs fulfil the National Institute for Health and Care Excellence’s end-of-life criteria. In the analysis, assuming discount prices for the drugs from patient access schemes agreed by the drug manufacturers with the Department of Health, predicted mean incremental cost-effectiveness ratios for cetuximab + FOLFOX, panitumumab + FOLFOX and cetuximab + FOLFIRI compared with chemotherapy alone appeared cost-effective at the National Institute for Health and Care Excellence’s threshold of £50,000 per quality-adjusted life-year gained, applicable to end-of-life treatments.
Conclusion
Cetuximab and panitumumab were recommended by the National Institute for Health and Care Excellence for patients with previously untreated RAS wild-type metastatic colorectal cancer, not eligible for liver resection at baseline, for use within the National Health Service in England. Both treatments are available via the UK Cancer Drugs Fund.
In metastatic colorectal cancer, mutations in exons 2, 3 and 4 of KRAS and NRAS oncogenes from the rat sarcoma (RAS) family may reduce response to monoclonal therapies with cetuximab and panitumumab. Therefore, these therapies may not be effective in patients with such mutations. |
Under patient access schemes agreed by the manufacturers of these drugs with the UK Department of Health, cetuximab and panitumumab given in combination with either FOLFOX (folinic acid, fluorouracil and oxaliplatin) or FOLFIRI (folinic acid, fluorouracil and irinotecan) appear cost-effective in previously untreated patients with metastatic colorectal cancer not eligible for liver resection at baseline, who do not have such mutations. |
The National Institute for Health and Care Excellence Appraisal Committee recommended cetuximab and panitumumab in combination with either FOLFOX or FOLFIRI for this patient population. The drugs are recommended only when the companies provide them with the patient access scheme discounts. |
1 Introduction
Colorectal, also known as bowel, cancer is any cancer of the colon (large bowel), rectum and appendix. It is the fourth most common cancer, and the second most common cause of cancer death in the UK [1]. Approximately 41,300 new cases of colorectal cancer (CRC) were reported in the UK in 2014. Colorectal cancer primarily affects adults, with the median age of patients at diagnosis of over 70 years. Metastatic colorectal cancer (mCRC) refers to disease that has spread beyond the large intestine and nearby lymph nodes to other parts of the body, most often to the liver. Between 10% and 25% of people with CRC have metastatic disease at the time of diagnosis, and about 50% of patients who have undergone surgery for early-stage disease eventually develop metastases [2].
Treatment options for mCRC include surgery, chemotherapy, radiotherapy and supportive care. Research suggests that resection of liver metastases from colorectal cancer can substantially increase overall survival (OS); for those patients who do not undergo resection, survival prognosis is relatively poor. The 5-year OS of patients with mCRC (diagnosed 1996–2002) in England was 6.6% [3], while the survival rate in patients who underwent colorectal liver resection (starting April 1988 through July 2002) was 33% [4]. Typically, liver resection would be performed in patients with metastases confined to the liver. As reported in Adam et al. [4], about 80% of patients with mCRC with colorectal liver metastases have unresectable disease at diagnosis. Chemotherapy treatment can significantly downsize the primary unresectable tumour, and thus offer the possibility of curative resection and therefore prolong survival. For the majority of patients, however, surgery with curative intent following downsizing chemotherapy is not an option owing to the widespread nature of their disease and/or poor suitability for surgery. Such patients are treated with palliative intent to improve the duration and the quality of the individual’s remaining life.
The National Institute for Health and Care Excellence (NICE) clinical guideline 131 [5] recommends chemotherapy options for people with colorectal cancer including fluorouracil and folinic acid in combination with oxaliplatin (FOLFOX); tegafur in combination with fluorouracil and folinic acid; capecitabine in combination with oxaliplatin (XELOX); and capecitabine alone. In practice, fluorouracil and folinic acid may also be used in combination with irinotecan (FOLFIRI) in people for whom oxaliplatin is not suitable. According to our clinical expert, Dr. Mark Napier, FOLFOX and FOLFIRI are offered to patients with mCRC in the National Health Service (NHS) most often: they account for ~30 and ~10% of all first-line treatments, respectively.
Chemotherapy may be combined with biological agents, cetuximab (CET) [Erbitux®; Merck Serono UK Ltd, Feltham, UK] [6] and panitumumab (PAN) [Vectibix®; Amgen UK Ltd, Cambridge, UK] [7]. These are monoclonal antibodies targeting the epidermal growth factor receptor, recognised as an important player in the development of CRC. Recent research suggests that mutations in exons 2, 3 and 4 of the genes, Kristen rat sarcoma (KRAS) and neuroblastoma rat sarcoma (NRAS) [which belong to oncogenes from the rat sarcoma, RAS, family [8, 9]], are a strong predictor of resistance to epidermal growth factor receptor-targeted drugs [2, 10,11,12,13,14,15]; and therefore such therapies may not be effective in patients with the RAS mutations, which constitute about 50% of all patients with mCRC (prevalence of the RAS mutations is detailed in Online Resource 1).
In light of these developments, the marketing authorisations for CET [16] and PAN [17] were updated by the European Medicines Agency in 2013 to restrict use to patients without KRAS and NRAS mutations in exons 2, 3 and 4. In 2015, NICE invited the manufacturers of these drugs to submit evidence for their clinical and cost effectiveness, in combination with chemotherapy, in patients with mCRC with previously untreated RAS wild-type (WT) [i.e. non-mutated] tumours, who are not eligible for liver surgery at baseline, as part of the Institute’s Multiple Technology Appraisal process [18, 19]. At the time of this technology appraisal (TA439), CET had marketing authorisation for use in combination with FOLFOX or FOLFIRI for patients with liver metastases (see NICE TA176 [20]), while PAN had a UK marketing authorisation for use in combination with FOLFOX [21]; both drugs were available via the UK Cancer Drugs Fund for the first-line treatment of mCRC without mutations in exon 2 of the KRAS oncogene only (refer to [20] and [21] for further details on the marketing authorisation criteria).
The work reported here builds on the previous TA176. The Peninsula Technology Assessment Group (PenTAG), commissioned to act as the assessment group in this multiple technology appraisal, prepared an independent health economic assessment of these technologies, which was submitted to NICE on 7 August, 2015. After that, seven additional economic analyses requested by NICE were conducted by PenTAG. The project was completed in March 2017. A summary of the most recent analysis, dated January 2017, and a summary of the NICE guidance are reported in this article. Further details are available on the NICE website [22].
2 Methods
In our report to NICE, results were presented for the overall population of patients with mCRC, and a subgroup of patients with metastases confined to the liver at the diagnosis of metastatic disease, which comprised about a quarter of all patients with mCRC. In the previous NICE guidance, TA176 [20], the liver metastases subgroup was considered a distinct subgroup of patients with mCRC. In this appraisal, however, the NICE Committee concluded based on advice from commentators and consultees that people with liver-only metastases were no longer a distinct subgroup in current clinical practice. Here, we present the results for the overall patient population with mCRC; for the analysis relevant to the liver metastases subgroup, refer to the Committee papers dated 2 March, 2017 [22].
2.1 Clinical Effectiveness
We conducted systematic reviews of clinical and cost effectiveness using a pre-specified protocol registered in PROSPERO (CRD #42015016111) [23]. A network meta-analysis was performed based on five randomised controlled trials (RCTs) identified during our systematic literature review of clinical evidence (see Tables 1–4, Online Resource 2). Since it was not possible to construct a complete network for FOLFOX- and FOLFIRI-containing chemotherapy regimens owing to the lack of randomised evidence connecting these treatments, two separate networks were generated (Fig. 1). Data from three RCTs, PRIME [11], PEAK [13] and OPUS [24], contributed to the estimation of clinical effectiveness of FOLFOX-containing regimens; the effectiveness of FOLFIRI-containing treatments was based on the CRYSTAL [25] and FIRE-3 [12] RCTs. No evidence was identified on the effectiveness of PAN + FOLFIRI in patients with mCRC.

FOLFOX (folinic acid + fluorouracil + oxaliplatin) and FOLFIRI (folinic acid + fluorouracil + irinotecan) treatment networks. These treatments were considered in our base case, with the exception of those containing bevacizumab (BEV).*Baseline trial, CET cetuximab, PAN panitumumab, RCT randomised controlled trial
Bevacizumab + FOLFOX and bevacizumab + FOLFIRI trials were used in the network meta-analysis to complete the network; bevacizumab arms, however, were excluded from the base case, because they had not been recommended by NICE for the first-line treatment of metastatic colorectal cancer; also, bevacizumab-containing regimens for first-line mCRC had been delisted from the UK Cancer Drugs Fund [26, 27]. The cost utility of these treatments was examined in scenario analyses (refer to [22] for further details).
In the base-case analysis, PRIME and CRYSTAL were considered baseline trials for the FOLFOX and FOLFIRI networks, respectively (Fig. 1). PRIME was selected as a baseline trial as it had a larger patient population of interest (512 RAS WT patients) compared with the other relevant RCT, OPUS (which had only 87 patients) (Fig. 1). The CRYSTAL RCT was chosen since the only treatments compared in this trial were CET + FOLFIRI and FOLFIRI; the other relevant RCT, FIRE-3, considered bevacizumab + FOLFIRI, which was examined in sensitivity analyses only. In the FOLFOX regimens network, FOLFOX was the baseline treatment, while FOLFIRI was the baseline treatment in the FOLFIRI regimens network.
The network meta-analyses were undertaken within a Bayesian framework in WinBUGS (Version 1.4.3). Vague priors were assumed for the model parameters. For the analysis of progression-free survival (PFS), OS and objective response rate, models with a normal likelihood and identify link were used, while adverse events (AEs) were modelled using a binomial likelihood and logit link [28]. For the analysis of the AEs, where there were no events reported in a study arm, a continuity correction of 0.5 was added to every cell for that particular study [28]. Owing to the small number of RCTs contributing to each network, only fixed-effects models were considered. Markov Chain Monte Carlo simulations with three chains were run for 150,000 iterations with a burn-in of 50,000. Convergence was assessed using the autocorrelation, density and trace plots for all monitored variables, and by checking that each chain was sampling from the same posterior distribution. The results of these analyses are presented in Online Resource 2.
The clinical evidence for CET and PAN was derived from post-hoc subgroup analyses for patients with RAS WT metastatic colorectal cancer, as no RCTs with RAS WT mCRC intention-to-treat populations were identified in the systematic literature review. Allocation of patients to subgroups was based on re-evaluation for RAS status of tumor samples from the KRAS WT exon 2 population. The subgroups of patients with RAS WT and RAS mCRC were generally similar in prognosis at baseline, allocation concealment, blinding, outcome reporting and loss to follow-up [22].
In clinical practice, FOLFOX may be administered in different regimens, commonly FOLFOX4 (oxaliplatin 85 mg/m2; fluorouracil 2000 mg/m2; and leucovorin 400 mg/m2) and FOLFOX6 (oxaliplatin 100 mg/m2; fluorouracil 2800 mg/m2; and leucovorin 400 mg/m2). These regimens are regarded as similar in effectiveness (see our report [29]). Based on clinical opinion, we considered FOLFOX6 in the base case, as this regimen is more commonly used in England [29] (it requires less administration time and is therefore less costly).
Direct evidence suggests a treatment effect in favour of the addition of CET or PAN to chemotherapy compared with chemotherapy alone. Addition of CET to FOLFOX resulted in increased median OS of 19.8 months vs. 17.8 months for FOLFOX alone [24]. However, the difference in survival was not statistically significant. CET + FOLFIRI demonstrated a statistically significant increase of 8.2 months in median OS vs. FOLFIRI alone (28.4 months vs. 20.2 months, respectively) [25]. Median OS of patients taking PAN + FOLFOX was 25.8 months vs. 20.2 months for patients treated with FOLFOX alone [30], with the difference in survival being statistically significant. The combination therapies with FOLFOX and FOLFIRI were shown to also improve PFS in patients with mCRC. A summary of direct and indirect evidence of efficacy and safety outcomes for CET + FOLFOX, CET + FOLFIRI, PAN + FOLFOX and the comparative treatments is provided in Tables 5 and 6 (Online Resource 2).
2.2 Cost Effectiveness
2.2.1 Treatments and Comparators
In our base-case analysis, treatments with CET + FOLFOX, PAN + FOLFOX and FOLFOX (FOLFOX network); and CET + FOLFIRI and FOLFIRI (FOLFIRI network) were compared.
2.2.2 Model Structure
Of 1979 search results obtained in our systematic review of cost effectiveness, no studies completely answered the decision problem addressed in this appraisal. A de novo, discrete-time partitioned survival model [31] was constructed to evaluate the cost utility of combination treatments with CET and PAN over the life span of patients with mCRC (Fig. 2). The model was implemented in Microsoft Excel (2013).

Model structure. * For cetuximab + folinic acid + fluorouracil + irinotecan (FOLFIRI) and FOLFIRI only. BSC best supportive care, DFS disease-free survival (defined as the length of time after primary treatment for the cancer that the patient survives without any signs or symptoms of the disease), PFS progression-free survival (defined as the length of time during and after the treatment of the disease that a patient lives with the disease but it does not get worse)
The model simulates a cohort of people with RAS WT mCRC starting on first-line treatment. The treatment is given until disease progression with the exception of CET + FOLFIRI and FOLFIRI: for these treatment arms, there is a period in first-line PFS [denoted by “PFS* (no treatment)” in Fig. 2] during which patients are not receiving active therapy because in the relevant RCT, CRYSTAL, the mean duration of these treatments was less than the mean time in PFS. As liver resection is likely to increase patient survival substantially, it was important to take account of this effect in the economic analysis. In the model, it is assumed that patients, who become eligible for resection after active first-line treatment, undergo one or more surgeries to resect liver metastases (this pathway is shown under “Resection” in Fig. 2). Liver surgery in patients with mCRC is usually performed 12–16 weeks after treatment initiation [20, 32]. For simplicity, all resections are modelled at the start of simulation, with a loss of accuracy of ~1% owing to inaccuracy in the timing, and hence discounting, of costs and quality-adjusted life-years (QALYs) for resected patients. Patients whose tumors could not be resected despite the downsizing therapy are given second-line treatment upon disease progression followed by third-line best supportive care (BSC) after further progression (see “No resection”, Fig. 2). In the model, patients whose liver resection was successful (R0-resection) are not actively treated during disease-free survival (DFS), and receive BSC treatment on disease progression, which is the same as the third-line BSC for non-resected patients. Those patients whose resection was not successful are given the same treatment as non-resected patients, i.e. second- and third-line therapies (Fig. 2).
Of note, Kaplan–Meier survival data, used in our analysis, already include resection survival failure, and therefore the resection failure rate is not modelled separately. “Death” is an absorbing state in this model. Circular arrows in Fig. 2 denote that patients can remain in a health state at the end of each model cycle. Because in our analysis we employed the partitioned survival approach [31], state transitions depicted by straight arrows in Fig. 2 were not modelled explicitly. In the model, all patients are assumed aged 63 years at the start of first-line treatment, with 66% of patients male, which is consistent with baseline patient characteristics from the pivotal RCTs (in the model, these affect age-related utilities and background mortality); the impact of these assumptions on the results was examined in sensitivity analyses.
The primary health outcomes in the model are life-years attained in each treatment, expressed in QALYs; the main economic outcome is the incremental cost-effectiveness ratio (ICER). Total per-patient costs and QALYs for each treatment are estimated over the model time horizon of 30 years. Future costs and benefits are discounted at 3.5% per annum. The perspective is that of the NHS and Personal Social Services in accordance with the NICE reference case [19]. The model cycle is 1 month, with a half-cycle correction applied using the mid-cycle method [33].
Two approaches to modelling survival and time on different treatments were considered: one approach, implemented in the main analysis, was based completely on data from the clinical trials; the other approach, employed in a scenario analysis, assumed only PFS on first-line drugs from the RCTs, with post-progression survival estimated from the published literature. Of note, the base-case analysis reported to NICE on 7 August, 2015, was based on the second approach. A comparative analysis of these approaches is provided in Online Resource 3.
2.2.3 Treatment Effectiveness
In the model, the difference in clinical effectiveness between the first-line treatments is represented by the difference in first-line PFS, the difference in OS, and the rates of liver resection and AEs.
2.2.3.1 Disease-Free and Overall Survival Post-Resection
In the previous assessment, TA176, OS after liver resection with curative intent was derived from Adam et al. [32]. We performed a forward reference search for this publication in PubMed to identify more recent studies reporting survival after liver resection for colorectal metastases. This yielded two studies: Adam et al. [4] and Adam et al. [34]. Importantly, the key information on patient population (such as age and gender composition), OS, DFS after liver resection, and the frequency of liver surgeries for colorectal metastases were reported in Adam et al. [32] only. Therefore, we selected Adam et al. [32] as the evidence source of these estimates. The choice of study, however, had little impact on cost-effectiveness results.
With no evidence to the contrary, it was assumed that DFS and OS in resected patients were independent of first-line treatment. Weibull and log-logistic models were fitted to survival data using the method of least squares. General background non-CRC mortality was modelled explicitly because the DFS reported in Adam et al. [32] was immature, with about 20% of patients being still in the pre-progression state at the end of the study observation period. The Weibull model for PFS was selected for the base-case analysis as it provided the most plausible predictions of DFS survival 8 years after the start of treatment (Fig. 3). The estimated mean DFS was 4.1 years assuming the Weibull distribution, which is substantially greater than the predicted mean PFS for unresected patients, which varied from 0.6 year to 1 year depending on treatment (see Tables 1 and 2, Online Resource 7). For the base-case analysis, the log-logistic model of OS was selected, as the OS predicted by this model was consistent with the Weibull model for DFS (i.e. OS was always greater than DFS). Assuming a 30-year model time horizon, the estimated mean OS in resected patients was 6.2 years.

Disease-free survival (DFS) and overall survival (OS) post-resection. a A Kaplan-Meier estimate of DFS in patients with resected metastatic colorectal cancer from Adam et al. [32], and a Weibull model for DFS from the base-case analysis, extrapolated beyond the observational period of 10 years. b A Kaplan–Meier estimate of survivor function in patients with resected metastatic colorectal cancer from Adam et al. [32], and a log-logistic model for OS from the base-case analysis. PenTAG Peninsula Technology Assessment Group
2.2.3.2 Progression-Free and Overall Survival for Non-Resected Patients
First-Line Progression-Free Survival for Non-Resected Patients Progression-free survival for non-resected patients was estimated as outlined below (a detailed description is provided in Sect. 1.2, Online Resource 4):
-
A.
First, we extrapolated PFS for each treatment arm from the RCTs.
-
B.
Second, the mean PFS and the standard error of the mean were calculated from each extrapolated PFS curve.
-
C.
Next, we performed a mixed-treatment comparison on the mean PFS. We chose to base the mixed-treatment comparison on the mean survival, not the hazard ratio, to avoid making an additional assumption on proportional hazard.
-
D.
Then, the mean DFS for patients post-resection was estimated from Adam et al. [32] as described above (this was assumed to apply in all modelled treatment arms).
-
E.
Finally, PFS for non-resected patients was derived from the mean PFS for all patients (Step C), the mean DFS for resected patients (Step D), and the proportion of resected patients in each treatment arm, assuming that PFS for non-resected patients has the same parametric form for all treatment arms (Weibull) with the shape parameter estimated in Step A. Another important assumption made here is that PFS in resected patients could be approximated by DFS. However, inaccuracy arising from this approximation is likely to have little impact on the model predictions because the results are relatively insensitive to our assumption for survival after disease progression. The resulting PFS curves are shown in Fig. 4.
Fig. 4 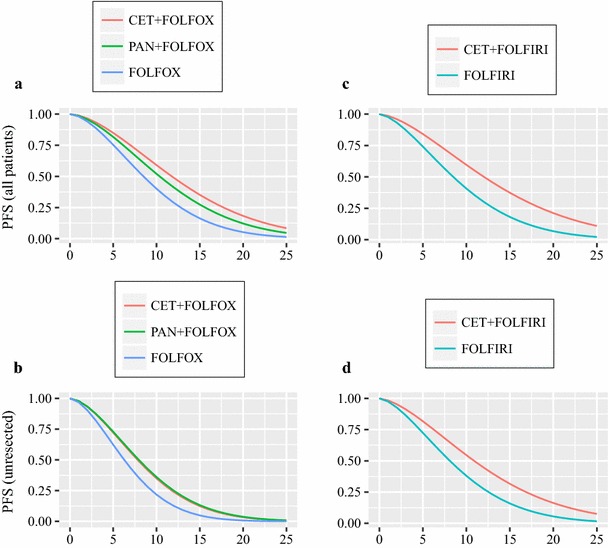
First-line progression-free survival (PFS) for non-resected patients. a, b Treatments from the FOLFOX (folinic acid + fluorouracil + oxaliplatin) network. c, d Treatments from the FOLFIRI (folinic acid + fluorouracil + irinotecan) network. CET cetuximab, PAN panitumumab, PenTAG Peninsula Technology Assessment Group

Second-Line Progression-Free Survival for Non-Resected Patients We were advised by our clinical expert that it would be reasonable to assume a second-line treatment with FOLFIRI after first-line FOLFOX-based therapies, and second-line FOLFOX after first-line FOLFIRI-based treatments. Under this assumption, PFS in patients receiving second-line treatments was modelled based on Tournigand et al. [35]. The authors reported Kaplan–Meier estimates of PFS for patients receiving second-line treatments with FOLFOX and FOLFIRI for a period of ~12 months. The Kaplan–Meier curves were extracted using DigitizeIt [36]. Weibull distributions were fitted to each of the data sets using the method of least squares, with weights decreasing linearly from unity at 0 months to zero at 11 months to reflect the reduction over time in the number of patients at risk, observed in the RCTs (Fig. 5). One of the reasons for selecting Weibull distributions for PFS was the lowest or nearly the lowest Akaike information criterion and Bayesian information criterion values. Additionally, it seems desirable to choose the same type of distribution for each treatment within the FOLFOX network and, separately, for each treatment within the FOLFIRI network because the choice of distribution affects mean PFS, and we believe that substantial evidence would be required to choose different distributions. In addition, our clinical expert considered the resulting extrapolations reasonable.

Second-line progression-free survival (PFS) for non-resected patients. Kaplan–Meier estimates of PFS in patients with metastatic colorectal cancer [35], and Weibull models from the base-case analysis for (a) second-line FOLFOX (folinic acid + fluorouracil + oxaliplatin) and (b) second-line FOLFIRI (folinic acid + fluorouracil + irinotecan). PenTAG Peninsula Technology Assessment Group
We assumed that PFS on second-line FOLFOX and FOLFIRI is independent of first-line treatment, and therefore applied the same estimates in all treatment arms. The proportion of progressions due to death while on second-line treatment was assumed to be the same as for DFS post-resection, i.e. 6% (Sect. 1.1, Online Resource 4).
Overall Survival for Non-Resected Patients Overall survival for patients who did not undergo liver resection for colorectal metastases was modelled from the RCTs using the same method as for PFS for non-resected patients (described under Steps A–E above). As for PFS, the best model fits were selected on the basis of the lowest Akaike information criterion and Bayesian information criterion, and the clinical plausibility of model predictions. Weibull models were found to be most appropriate (Fig. 6).

Overall survival (OS) estimates used in the base-case analysis to model OS for non-resected patients. a OS for patients treated with cetuximab (CET) + FOLFOX (folinic acid + fluorouracil + oxaliplatin) and FOLFOX (not adjusted for subsequent treatment as explained in the main text). b OS for patients taking panitumumab (PAN) + FOLFOX and FOLFOX (OS curves for FOLFOX are shown with and without adjustment for subsequent treatment). c OS for patients taking CET + FOLFIRI (folinic acid + fluorouracil + irinotecan) and FOLFIRI (with and without adjustment for subsequent treatment)
The survival data reported in the RCTs were likely to be confounded by subsequent therapies, although the proportions of patients receiving subsequent active treatments were low. The inverse probability of censoring weighting [37] was employed by Amgen, the manufacturer of PAN, and the rank-preserved structural failure time method [37] was used by Merck Serono, the manufacturer of CET, to correct for imbalances in subsequent treatments. Owing to the lack of data, survival adjustment for the CET + FOLFOX and FOLFOX comparison could not be performed.
The resulting OS curves for the combination treatments with PAN + FOLFOX and CET + FOLFIRI (Fig. 6b and c) lie above the OS estimates for relevant comparators, indicating that patients with mCRC survive longer on the combination treatments with the monoclonal therapies. For CET + FOLFOX, however, predicted survival in non-resected patients is worse compared with chemotherapy alone (Fig. 6a), which might be owing to the fact that the OS estimates were not adjusted for subsequent treatment.
2.2.4 Adverse Events
The network meta-analysis reported results for neutropenia, paresthesia, rash and skin conditions for all comparators from the FOLFOX network, and for skin conditions and diarrhea for the comparators from the FOLFIRI network. In our clinical expert’s opinion, not all clinically important AEs were likely to have been picked up in the network meta-analysis; therefore, we used an alternative approach to estimate AE-related costs and QALYs, which was not reliant on incidences of AEs from every pivotal trial. The methodology is detailed in Sect. 1.3 (Online Resource 2).
2.2.5 Costs
Unit costs were inflated to 2015/16 prices by inflating them first to 2013/14 prices using the Hospital and Community Health Services Pay & Prices Index [38], and then to 2015/16 prices at a rate of 1.64% per annum. Where conversion from other currencies to GBP was required, International Monetary Fund purchasing power parity was used to convert within year (e.g. from 2010 EUR to 2010 GBP), after which inflation was applied. The CCEMG – EPPI-Centre Cost Converter [39] was used for the purchasing power parity conversion (Fig. 1 and Table 7, Online Resource 5).
2.2.5.1 Treatment Duration
The modelled mean duration of the first-line treatments was derived from the pivotal RCTs (Table 1, Online Resource 5). The mean duration of the second-line treatments was based on Tournigand et al. [35] (Sect. 1.1.2, Online Resource 5) [40]. After discontinuation of the second-line treatments, non-resected patients were assumed to be given BSC, i.e., palliative care, until death; the same treatment was administered to resected patients upon disease progression.
2.2.5.2 Drug Acquisition
Drug acquisition costs were obtained, where possible, from the Commercial Medicines Unit electronic market information tool (CMU eMit) database [41]. For other drugs, list prices from the British National Formulary [42] were used in accordance with the NICE reference case [19]. The mean drug acquisition cost per patient was calculated as the product of the mean duration of first-line treatment, drug acquisition cost per unit time and dose intensity. Cetuximab dosing, based on body surface area, was estimated as in Sacco et al. (2010) [43] from a weight distribution of patients receiving palliative chemotherapy for CRC (provided by the lead author), while PAN dosing was directly based on this weight distribution. The drug list prices are shown in Table 2 (Online Resource 5).
2.2.5.3 Drug Administration
The costs of drug administration are all borne by the NHS and Personal Social Services of administering chemotherapy to a patient, excluding the direct cost of drug acquisition (i.e. payments to drug manufacturers or distributors). The following cost components were included: delivery, pharmacy costs, infusion pump and line maintenance.
CET and PAN are delivered as intravenous infusions prior to initiation of the other component of chemotherapy (FOLFOX or FOLFIRI) [6, 7]. FOLFOX6 and FOLFIRI consist of 2-h infusions (leucovorin plus oxaliplatin or irinotecan), followed by bolus 5-fluorouracil and then prolonged infusional 5-fluorouracil (46 h). Estimated drug delivery costs were similar across the treatments, ~£400 per administration (Table 3, Online Resource 5). The Summary of Product Characteristics for CET recommends a weekly dose of 250 mg/m2 body surface area [6]. However, in NHS practice in England, a dose of 500 mg/m2 body surface area may be given fortnightly that can substantially reduce the administration cost. In the analysis presented here, fortnightly administration of CET was assumed for consistency with current clinical practice in England.
2.2.5.4 Cost of Liver Resection
Based on clinical advice, liver resections for mCRC were costed as very complex procedures, with 80% of them being open operations and the remaining 20% laparoscopic surgeries. The estimated unit cost was £10,440 per surgery inflated to 2015/16 prices using the average increase in the prices index (Fig. 1 and Table 7, Online Resource 5). Adam et al. [32] reported the mean of 1.6 liver resections per patient with mCRC; this assumption resulted in the total cost of liver surgery of £16,704 per patient (the derivation of this cost is described in detail in Sect. 1.4, Online Resource 5). The rates of liver resection were informed by the pivotal RCTs: 7.3% on the CET + FOLFIRI treatment and 2.1% on the FOLFIRI treatments (taken from the CRYSTAL trial [25]); the resection rates in patients on PAN + FOLFOX and FOLFOX were taken from PRIME [11] (they constitute commercial-in-confidence information and therefore are not presented here [29]); the resection rate of 20.7% for CET + FOLFOX was estimated from OPUS and PRIME as explained in Sect. 1.5 (Online Resource 5).
2.2.5.5 Other Costs
Since genetic testing is necessary for monoclonal therapies, the cost of £400 per patient was incorporated, assuming that 50% of patients have RAS WT mCRC and that the cost of testing is £200 per test (personal communication, All Wales Medical Genetics Service and the Genetics Laboratory at Royal Devon and Exeter Hospital). Other costs included medical management, not covered by other cost categories; oncology outpatient attendances; blood tests; imaging tests (magnetic resonance imaging and computed tomography); colonoscopy; and palliative care (Table 5, Online Resource 5). The cost of managing AEs was estimated from unit costs presented in Table 6 (Online Resource 5).
2.2.6 Utilities
The principles, recommended by the NICE Decision Support Unit in the UK [44], were followed for the identification, review and synthesis of health state utility values from the literature. Sources of utilities for patients with KRAS WT mCRC only were identified. We believe, however, that utilities from the KRAS WT patient population would not differ significantly from those related to patients with RAS WT.
Health state utilities from the main analysis are shown in Table 1 (Online Resource 6). The utility value for the “PFS (1st-line treatment)” health state (Fig. 2) was 0.767; the utility for “Progressive disease (2nd-line treatment)” was slightly lower, 0.762; for “Progressive disease (3rd-line BSC)”, the utility was 0.641. A well-established methodology of Ara and Brazier (2010) [45], updated to use Health Survey for England 2012 data [46], was employed for estimation of the post-resection progression-free utility:
The utility post-resection at time 0 and age 63 years was 0.83. The utility in disease progression post-successful resection was calculated by averaging the second- and third-line utilities, weighted by the time spent in each line of treatment, which resulted in the utility value in this health state of 0.67. Disutilities of grade 3/4 AEs, shown in Table 2 (Online Resource 6), were applied for a length of 1 week in line with the approach used in Freeman et al. (2014) [47]. Grade 1/2 AEs were assumed to have no disutility.
3 Results
3.1 Base-Case Analysis
A summary of the base-case results is shown in Error! Reference source not found.; a full breakdown is presented in Online Resource 7. The combination treatments with CET and PAN appear more clinically effective and more costly than their comparators. In the FOLFOX network, PAN + FOLFOX is predicted to yield the longest survival of 2.85 years, while FOLFOX will result in the shortest survival of 2.18 years with an inverse probability of censoring weighting adjustment applied, and 2.35 years without the adjustment. Patients treated with CET + FOLFIRI are predicted to live, on average, for 2.9 years after disease diagnosis, while survival of patients on FOLFIRI is shorter: 1.82 years and 2.1 years as predicted with and without adjustment for subsequent treatment, respectively.
In the FOLFOX network, the PAN + FOLFOX arm accrued the most QALYs, 1.86; CET + FOLFOX resulted in 1.67 QALYs; treatment with FOLFOX resulted in QALYs of 1.45 and 1.55 with and without adjustment for subsequent treatment, respectively. CET + FOLFIRI was predicted to result in 1.92 QALYs; the treatment with FOLFIRI yielded 1.43 QALYs when adjustment for subsequent treatment was applied, and 1.26 QALYs without the adjustment (Table 1).
The mean base-case ICERs ranged from £68,079 for CET + FOLFIRI vs. FOLFIRI to £243,975 for CET + FOLFOX vs. FOLFOX (Table 1). The major cost component was the drug acquisition costs of first-line treatments with CET and PAN, £31,914 (CET + FOLFIRI) and £26,521 (PAN + FOLFOX) per patient, respectively (Tables 1 and 2, Online Resource 7), followed by the cost of drug administration of first-line treatments. When zero price for CET and PAN was assumed, PAN + FOLFOX and CET + FOLFIRI were not cost-effective at the willingness-to-pay threshold of £20,000 per QALY gained (which represents the lower bound of a threshold range of £20,000–£30,000 per QALY gained usually considered by NICE when making decisions on the cost effectiveness of health technologies [19]): the respective ICERs were ~£22,000 and ~£21,000 per QALY gained.
To improve the cost effectiveness of CET and PAN, Merck Serono and Amgen proposed patient access schemes (PASs) [the PASs are confidential and therefore not detailed here]. When the PAS discounts were applied and OS was adjusted for subsequent treatment, PAN + FOLFOX and CET + FOLFIRI were cost-effective at the willingness to pay of £50,000 per QALY gained [22]. Because of limited data, it was not possible to estimate, under the same assumptions, the ICER for CET + FOLFOX vs. FOLFOX; when OS was not adjusted for subsequent treatment, the ICER for this comparison exceeded £50,000 per QALY gained.
3.2 Sensitivity and Uncertainty Analyses
The effect on the model predictions of plausible variations in the model parameters (reported in detail in [22]) was explored in sensitivity analyses. One-way deterministic sensitivity analysis indicated that the cost-effectiveness results were most sensitive to the rates of liver resection, DFS and OS post-resection, PFS for non-resected patients, and treatment duration. Probabilistic ICERs were very similar to the deterministic ICERs. Cost-effectiveness acceptability curves, estimated under the list prices of CET and PAN, are shown in Fig. 7. At the threshold of £50,000 per QALY gained, FOLFOX is likely to be the most cost-effective treatment among the treatments from the FOLFOX network (with the probability of 0.981); CET + FOLFOX is extendedly dominated by the alternative treatment strategies. The probability of FOLFIRI being the most cost-effective treatment in the FOLFIRI network at the threshold of £50,000 per QALY gained is equal to 1.

Cost-effectiveness acceptability curves from the base-case probabilistic sensitivity analysis. a FOLFOX (folinic acid + fluorouracil + oxaliplatin) network. b FOLFIRI (folinic acid + fluorouracil + irinotecan) network. CET cetuximab, PAN panitumumab, QALY quality-adjusted life-year
3.3 Model Validation
The economic model was validated in the following ways: (1) the model code was examined for correctness by members of the Peninsula Technology Assessment Group who did not build the model; (2) a simplified model that did not rely on model cycles was built to quickly identify errors in the full model; (3) the model outputs under extreme parameter values were examined for reasonableness; and (4) face validity of the model predictions was tested using numerous graphical outputs.
4 End-of-Life Criteria
The criteria of short life expectancy of patients (normally less than 24 months), and the extension to life (of at least an additional 3 months) offered by a new treatment compared with those currently available in the NHS are considered by NICE when making decisions on end-of-life treatments. We estimated the mean life expectancy of 2.18 and 1.82 months for patients on FOLFOX and FOLFIRI, respectively. Survival improvement for CET + FOLFOX vs. FOLFOX was under 3 months (0.17 years); this estimate, however, was obtained without adjustment of the OS for subsequent treatment.
Given the available evidence, the end-of-life criteria were met on the following basis:
-
The predicted mean survival for patients on both FOLFOX and FOLFIRI are close to the threshold of 24 months, with the estimate for FOLFOX being only slightly higher than the threshold. The NICE Appraisal Committee concluded that from a clinical- and evidence-based standpoint, these two regimens are equivalent in terms of efficacy, and only differ in their toxicities. Assuming that FOLFOX and FOLFIRI have similar efficacy, and taking into account high uncertainty in the survival estimates, the Committee concluded that the criterion for a short life expectancy for both treatments was met.
-
Both CET and PAN met the extension-to-life criterion because these treatments are likely to prolong survival, on average, by more than 3 months.
5 Discussion
The model-based analysis presented here was conducted by the Peninsula Technology Assessment Group, an independent academic group not sponsored by any manufacturers of CET and PAN. In our analysis, we used up-to-date clinical effectiveness data collected through a systematic literature review. Drug acquisition costs were obtained, where possible, from the Commercial Medicines Unit eMit database, which reflects the true cost of acquiring these drugs to the NHS in England. We explored areas of uncertainty through sensitivity and scenario analyses. Though the ICERs for the anti-epidermal growth factor receptor therapies vs. chemotherapy alone altered quite substantially, none fell below a willingness-to-pay threshold of £20,000 per QALY gained.
Only the manufacturer of CET, Merck Serono, conducted a model-based analysis as part of this appraisal. There are many similarities between our model and the company’s model. However, there are several important differences that result in very different estimates of the cost effectiveness of CET. The major differences relate to model assumptions on post-resection PFS and progressive disease, and PFS in unresected patients; the rates of liver resection; acquisition and administration costs; the costs of liver surgery and progressive disease post-resection ([22]).
There are important sources of uncertainty in our economic analysis. Here, we briefly discuss only some of the issues. For further details, refer to our report to NICE [22].
5.1 Systematic Review of Effectiveness Studies
First, the clinical evidence for CET and PAN was derived from post-hoc subgroup analyses for patients with RAS WT mCRC. It is known that subgroup analyses are frequently underpowered because subgroups include fewer patients than the main treatment groups. In the pivotal trials, this problem was exacerbated by a low number of tumour samples available for RAS WT testing, performed retrospectively, with the only exception being the PEAK trial where the extended RAS subgroup analysis was pre-specified.
Second, in the network meta-analysis, it was not possible to construct a complete treatment network with the FOLFOX- and FOLFIRI-containing regimens. It was therefore not possible to compare the FOLFOX- and FOLFIRI-based treatments.
Finally, no evidence on the effectiveness of PAN + FOLFIRI was available at the time of the appraisal. Hence, it was not possible to assess the cost effectiveness of this treatment.
5.2 Economic Analysis
In the analysis, it was assumed that CET is administered fortnightly (as this is current UK clinical practice), and that the clinical effectiveness of CET would be the same as in the trials where this drug was administered weekly. However, there might be a difference in effectiveness between these schedules, which might contribute to the uncertainty in the cost-effectiveness results.
Another source of uncertainty in the model predictions is related to the PFS and OS data used in the analysis. Although the data were of high quality, as they were sourced from RCTs, the clinical and cost effectiveness of CET + FOLFOX are much more uncertain compared with the other combination treatments because the number of patients in the OPUS trial was substantially lower than in the other trials. The uncertainty could have been increased as a result of methodology employed when estimating PFS and OS for non-resected patients. To obtain such estimates, we adjusted PFS and OS from the RCTs, which related to both resected and unresected patients, by use of external data from Adam et al. [32]. Since individual patient data from the RCTs were not available, this method should be regarded as an approximation only.
In the study reported by Adam et al. [32], no patients received either CET or PAN before liver resection for colorectal metastases. It is therefore possible that post-resection survival for patients initially treated with these drugs could differ from that reported in the source.
The evidence is poor for the accuracy and effectiveness of companion diagnostic for testing RAS mutation status. Owing to the paucity of data available, we assumed that these are the same in clinical practice as they are in the trials, which in practice would likely to result in lower effectiveness for CET and PAN.
The economic analysis presented here was designed for the NHS in England. However, it can easily be adapted for the healthcare systems of other countries.
6 Conclusions
We assessed the cost effectiveness of first-line treatments with CET and PAN for patients with RAS WT mCRC (i.e. cancer without mutations in exons 2, 3 and 4 of KRAS and NRAS oncogenes), not eligible for liver resection at baseline. The cost effectiveness of these drugs in the UK has been previously evaluated [40]. However, this is the first study considering CET and PAN for the RAS WT mCRC population in first-line settings in the context of the NHS in England.
Based on the available evidence, CET and PAN fulfill NICE’s end-of-life criteria. Although the combination treatments with CET and PAN have been shown to improve patient survival compared with treatments currently available in the NHS, under the list prices for these drugs such therapies are highly unlikely to represent an effective use of NHS resources; the mean base-case ICERs for the combination therapies exceeded common willingness-to-pay thresholds used by NICE. Under the PAS discounts, however, PAN + FOLFOX and CET + FOLFIRI were cost-effective at the threshold of £50,000 per QALY gained. After careful consideration of the available evidence and clinical experts’ opinion on the similarity of treatment effects of FOLFOX and FOLFIRI, the NICE Appraisal Committee concluded that the ICER for CET + FOLFOX vs. FOLFOX was likely to be similar to that for CET + FOLFIRI vs. FOLFIRI. Therefore, treatment with CET + FOLFOX was also likely to be cost-effective at £50,000 per QALY gained.
The Committee recommended CET and PAN in combination with FOLFOX or FOLFIRI as first-line end-of-life treatments for adults with RAS WT mCRC, not eligible for liver resection at baseline. The drugs are recommended only when the companies provide them with the PAS discounts agreed with the UK Department of Health. They are available through the UK Cancer Drugs Fund for treating non-mutated RAS mCRC within the NHS in England.
Data Availability Statement
We are happy to consider releasing copies of our economic model to not-for-profit organisations within the UK or overseas, such as other universities or government agencies. Please, contact Martin Hoyle at M.W.Hoyle@exeter.ac.uk.
References
Cancer Research UK. Bowel cancer incidence statistics. London: Cancer Research UK; 2011. http://www.cancerresearchuk.org/cancer-info/cancerstats/types/bowel/incidence/#source23. Accessed 23 Jan 2015.
Van Cutsem E, Cervantes A, Nordlinger B, Arnold D, Group EGW. Metastatic colorectal cancer: ESMO clinical practice guidelines for diagnosis, treatment and follow-up. Ann Oncol. 2014;25(Suppl. 3):iii1–9. https://doi.org/10.1093/annonc/mdu260.
National Cancer Intelligence Network. Colorectal cancer. 2009. http://www.ncin.org.uk/cancer_type_and_topic_specific_work/cancer_type_specific_work/colorectal_cancer/. Accessed 5 Jun 2017.
Adam R, Wicherts DA, de Haas RJ, Ciacio O, Levi F, Paule B, et al. Patients with initially unresectable colorectal liver metastases: is there a possibility of cure? J Clin Oncol. 2009;27(11):1829–35. https://doi.org/10.1200/JCO.2008.19.9273.
National Institute for Health and Care Excellence. Colorectal cancer: diagnosis and management. 2014. https://www.nice.org.uk/guidance/cg131. Accessed 9 May 2017.
Merck Serono. Summary of product characteristics: Erbitux (cetuximab). Feltham, UK: Merck Serono; 2014.
Amgen Ltd. Summary of product characteristics: Vectibix (panitumumab). Cambridge: Amgen Ltd; 2014.
Downward J. Targeting RAS signalling pathways in cancer therapy. Nat Rev Cancer. 2003;3(1):11–22. https://doi.org/10.1038/nrc969.
Goodsell DS. The molecular perspective: the ras oncogene. Oncologist. 1999;4(3):263–4.
Bokemeyer C, Bondarenko I, Hartmann JT, Braud F, Schuch G, Zubel A, et al. Efficacy according to biomarker status of cetuximab plus FOLFOX-4 as first-line treatment for metastatic colorectal cancer: the OPUS study. Ann Oncol. 2011;22(7):1535–46. https://doi.org/10.1093/annonc/mdq632.
Douillard JY, Siena S, Cassidy J, Tabernero J, Burkes R, Barugel M, et al. Final results from PRIME: randomized phase III study of panitumumab with FOLFOX4 for first-line treatment of metastatic colorectal cancer. Ann Oncol. 2014;25:1346–55.
Heinemann V, Weikersthal LF, Decker T, Kiani A, Vehling-Kaiser U, Al-Batran SE, et al. FOLFIRI plus cetuximab versus FOLFIRI plus bevacizumab as first-line treatment for patients with metastatic colorectal cancer (FIRE-3): a randomised, open-label, phase 3 trial. Lancet Oncol. 2014;15(10):1065–75. https://doi.org/10.1016/S1470-2045%2814%2970330-4.
Schwartzberg LS, Rivera F, Karthaus M, Fasola G, Canon JL, Hecht JR, et al. PEAK: a randomized, multicenter phase II study of panitumumab plus modified fluorouracil, leucovorin, and oxaliplatin (mFOLFOX6) or bevacizumab plus mFOLFOX6 in patients with previously untreated, unresectable, wild-type KRAS exon 2 metastatic colorectal cancer. J Clin Oncol. 2014;32:2240–7.
European Medicines Agency. Cetuximab (Erbitux): summary of opinion (post authorisation). London: European Medicines Agency; 2011.
European Medicines Agency. Panitumumab (Vectibix): summary of opinion (post authorisation). London: European Medicines Agency; 2011.
European Medicines Agency. Cetuximab (Erbitux) assessment report (variation assessment report; EMEA/h/C/000558/II/0062). London: European Medicines Agency; 2013.
European Medicines Agency. Panitumumab (Vectibix) assessment report (variation assessment report; EMEA/H/C/000741/II/0050). London: European Medicines Agency; 2013.
National Institute for Health Research. Health Technology Assessment (HTA) programme. 2016. http://www.hta.ac.uk. Accessed 8 Apr 2016.
National Institute for Health and Care Excellence. Guide to the methods of technology appraisal. 2013. http://www.nice.org.uk/article/pmg9/chapter/foreword. Accessed 20 Feb 2018.
National Institute for Health and Care Excellence. Technology appraisal 176 (TA176): cetuximab for the first-line treatment of metastatic colorectal cancer. London: NICE; 2009.
NHS England. Cancer drugs fund decision summary: panitumumab: treatment of adult patients with wild-type RAS (KRAS and NRAS) metastatic colorectal cancer (mCRC) in first-line in combination with FOLFOX. London: NHS England; 2014. Available from: https://www.google.co.uk/url?sa=t&rct=j&q=&esrc=s&source=web&cd=3&ved=0ahUKEwjV8v2m4rPVAhVpJcAKHXWCBVgQFggwMAI&url=https%3A%2F%2Fwww.nice.org.uk%2Fguidance%2Fta240%2Fdocuments%2Fcolorectal-cancer-metastatic-panitumumab-terminated-appraisal-appendix-b-ge-proposal-paper-january-20152&usg=AFQjCNFLNQSDzjhnmBQESt9XA7YRfoT9hg. Accessed 20 Feb 2018.
National Institute for Health and Care Excellence. Cetuximab (review of TA176) and panitumumab (partial review of TA240) for the first line treatment of metastatic colorectal cancer [ID794]. 2017. https://www.nice.org.uk/guidance/ta439/evidence. Accessed 9 Aug 2017.
PROSPERO international prospective register of systematic reviews. Cetuximab (review of TA176) and panitumumab (partial review of TA240) for the first line treatment of metastatic colorectal cancer. 2015. http://www.crd.york.ac.uk/PROSPERO/display_record.asp?ID=CRD42015016111. Accessed 12 Jun 2017.
Tejpar S, Kohne CH, Ciardiello F, Lenz HJ, Heinemann V, Klinkhardt U, et al. FOLFOX4 plus cetuximab treatment and RAS mutations in colorectal cancer. Eur J Cancer. 2015;51(10):1243–52.
Van Cutsem E, Lenz HJ, Kohne CH, Heinemann V, Tejpar S, Melezinek I, et al. Fluorouracil, leucovorin, and irinotecan plus cetuximab treatment and RAS mutations in colorectal cancer. J Clin Oncol. 2015;33(7):692–700. https://doi.org/10.1200/JCO.2014.59.4812.
England NHS. Cancer drugs fund decision summary: bevacizumab in combination with 1st line single agent fluoropyrimidine-based chemotherapy for metastatic colorectal cancer. London: NHS England; 2015.
National Institute for Health and Care Excellence. National cancer drugs fund list. 2017. https://www.england.nhs.uk/publication/national-cancer-drugs-fund-list/. Accessed 5 Jun 2017.
Dias S, Welton NJ, Sutton AJ, Ades AE. NICE DSU technical support document 2: a generalised linear modelling framework for pairwise and network meta-analysis of randomised controlled trials. Sheffield: National Institute for Health and Care Excellence Decision Support Unit; 2014.
National Institute for Health and Care Excellence. Cetuximab and panitumumab for previously untreated metastatic colorectal cancer. 2017. https://www.nice.org.uk/guidance/ta439. Accessed 9 May 2017.
Douillard JY, Oliner KS, Siena S, Tabernero J, Burkes R, Barugel M, et al. Panitumumab-FOLFOX4 treatment and RAS mutations in colorectal cancer. N Engl J Med. 2013;369:1023–34.
Woods B, Sideris E, Palmer S, Latimer N, Soares M. NICE DSU TSD19: partitioned survival analysis for decision modelling in health care: a critical review. 2017. http://scharr.dept.shef.ac.uk/nicedsu/wp-content/uploads/sites/7/2017/06/Partitioned-Survival-Analysis-final-report.pdf. Accessed 12 Jun 2017.
Adam R, Delvart V, Pascal G, Valeanu A, Castaing D, Azoulay D, et al. Rescue surgery for unresectable colorectal liver metastases downstaged by chemotherapy: a model to predict long-term survival. Ann Surg. 2004;240(4):644–57 (discussion 57–8).
Soares MO, Canto ECL. Continuous time simulation and discretized models for cost-effectiveness analysis. Pharmacoeconomics. 2012;30(12):1101–17. https://doi.org/10.2165/11599380-000000000-00000.
Adam R, De Gramont A, Figueras J, Guthrie A, Kokudo N, Kunstlinger F, et al. The oncosurgery approach to managing liver metastases from colorectal cancer: a multidisciplinary international consensus. Oncologist. 2012;17(10):1225–39. https://doi.org/10.1634/theoncologist.2012-0121.
Tournigand C, Andre T, Achille E, Lledo G, Flesh M, Mery-Mignard D, et al. FOLFIRI followed by FOLFOX6 or the reverse sequence in advanced colorectal cancer: a randomized GERCOR study. J Clin Oncol. 2004;22(2):229–37. https://doi.org/10.1200/JCO.2004.05.113.
Bormann I. Digitizer software. 2015. http://www.digitizeit.de/. Accessed 20 Feb 2018.
Latimer NR, Abrams KR, Lambert PC, Crowther MJ, Wailoo AJ, Morden JP, et al. Adjusting survival time estimates to account for treatment switching in randomized controlled trials: an economic evaluation context: methods, limitations, and recommendations. Med Decis Making. 2014;34(3):387–402. https://doi.org/10.1177/0272989X13520192.
Curtis L. Unit costs of health and social care 2014. Canterbury: Personal Social Services Research Unit, University of Kent; 2014.
CCEMG and EPPI-Centre. CCEMG - EPPI-Centre Cost Converter. 2014. https://eppi.ioe.ac.uk/costconversion/default.aspx. Accessed 1 Aug 2015.
Hoyle M, Crathorne L, Peters J, Jones-Hughes T, Cooper C, Napier M, et al. The clinical effectiveness and cost-effectiveness of cetuximab (mono- or combination chemotherapy), bevacizumab (combination with non-oxaliplatin chemotherapy) and panitumumab (monotherapy) for the treatment of metastatic colorectal cancer after first-line chemotherapy (review of technology appraisal no. 150 and part review of technology appraisal no. 118): a systematic review and economic model. Health Technol Assess. 2013;17(14):1–237. https://doi.org/10.3310/hta17140.
Department of Health, Commercial Medicines Unit. Drugs and pharmaceutical electronic market information (eMIT). 2015. https://www.gov.uk/government/publications/drugs-and-pharmaceutical-electronic-market-information-emit. Accessed 20 Feb 2018.
Joint Formulary Committee. British national formulary. 69th ed. London: BMJ Group and Pharmaceutical Press; 2015.
Sacco JJ, Botten J, Macbeth F, Bagust A, Clark P. The average body surface area of adult cancer patients in the UK: a multicentre retrospective study. PLoS One. 2010;5(1):e8933. https://doi.org/10.1371/journal.pone.0008933.
Papaioannou D, Brazier JE, Paisley S. NICE DSU technical support document 9: the identification, review and synthesis of health state utility values from the literature. London: National Institute for Health and Care Excellence; 2010.
Ara R, Brazier JE. Using health state utility values from the general population to approximate baselines in decision analytic models when condition-specific data are not available. Value Health. 2011;14(4):539–45. https://doi.org/10.1016/j.jval.2010.10.029.
Digital N. Health survey for England 2012. The Health and Social Care Information Centre, London. 2013. https://digital.nhs.uk/catalogue/PUB13218. Accessed 1 Aug 2015.
Freeman K, Connock M, Cummins E, Gurung T, Taylor-Phillips S, Court R, et al. Fluorouracil plasma monitoring: the My5-FU assay for guiding dose adjustment in patients receiving fluorouracil chemotherapy by continuous infusion. Coventry: Warwick Evidence; 2014.
Huxley N, Crathorne L, Varley-Campbell J, Tikhonova I, Snowsill T, Briscoe S, et al. The clinical effectiveness and cost-effectiveness of cetuximab (review of technology appraisal no. 176) and panitumumab (partial review of technology appraisal no. 240) for previously untreated metastatic colorectal cancer: a systematic review and economic evaluation. Health Technol Assess. 2017;21(38):1–294. https://doi.org/10.3310/hta21380.
Acknowledgements
The authors thank Mrs. Sue Whiffin and Ms. Jenny Lowe for the excellent administrative support.
Funding
This project was funded by the National Institute for Health Research (NIHR) Health Technology Assessment (HTA) Programme (14/65/01). The original report submitted by the Peninsula Technology Assessment Group to the National Institute for Health and Care Excellence on 7 August, 2015 was published in full in Health Technology Assessment [48]. Visit the HTA Programme website for further information [18]. This report presents independent research commissioned by the NIHR. The views and opinions expressed by the authors in this publication are those of the authors and do not necessarily reflect those of the National Health Service, the NIHR, Medical Research Council, the NIHR HTA Programme or the Department of Health.
Author information
Authors and Affiliations
Contributions
IAT drafted the final version of the manuscript; NH, TS, LC, JVC, MN and MH revised the manuscript prior to submission. MH is the overall guarantor of the content.
Corresponding author
Ethics declarations
Conflict of interest
Irina A. Tikhonova, Nicola Huxley, Tristan Snowsill, Louise Crathorne, Jo Varley-Campbell, Mark Napier and Martin Hoyle have no conflicts of interest directly relevant to the content of this article.
Electronic supplementary material
Below is the link to the electronic supplementary material.
Rights and permissions
About this article

Cite this article
Tikhonova, I.A., Huxley, N., Snowsill, T. et al. Economic Analysis of First-Line Treatment with Cetuximab or Panitumumab for RAS Wild-Type Metastatic Colorectal Cancer in England. PharmacoEconomics 36, 837–851 (2018). https://doi.org/10.1007/s40273-018-0630-9
Published:
Issue Date:
DOI: https://doi.org/10.1007/s40273-018-0630-9