
Abstract
A thermo-mechanical simulation of the wire + arc additive manufacturing (WAAM) process is presented in this work. The simulation consists in the deposition of 5 successive layers of 316 L stainless steel on a 316 L base plate. The thermo-mechanical analysis is solved in two dimensions under plane stress assumption. Nonetheless, the metal addition is taking into account in this numerical analysis. An increment of material is added at each time step. This numerical approach allows reducing the computational time. The temperature and residual stress fields are computed at each time step. Two patterns of deposition strategy are also investigated. It is shown that the longitudinal stress varies mainly along the vertical axis. A sample with 5 overlaid layers has been scanned with neutron diffraction technique in order to measure the final residual stresses. Both numerical and measured residual stresses are in good agreement. The Aster finite element software is employed for the numerical analysis.
1 Introduction
Wire + arc additive manufacturing (WAAM) process allows making metallic parts by melting a metallic wire given an adequate heat source and stacking up the deposits layer by layer vertically. These additive manufacturing (AM) processes are a promising alternative to traditional subtractive machining processes. Complex geometries and saving of raw metallic material are performed with such AM processes. Wire + arc AM reach higher volume deposition rate (~ 250 cm3/h) than other AM processes using powder metallic material (laser or electron beam has deposition rates ranging from 5 to 25 cm3/h). Furthermore, such equipment is well suited for making large metallic parts (few meters) and is cheaper than powder ones [1] especially if welding generators are used such as gas metal arc welding (GMAW). It has been reported that the WAAM process can result in distortions and high levels of residual stresses in the component [2]. Mechanical properties and life cycle of the built part rely on its induced residual stresses. Distortions and residual stresses are affected by the process parameters such as arc voltage, current, deposition speed and deposition pattern. The influence of these parameters and the deposit strategy are investigated with thermo-mechanical finite element analyses.
The CMT-GMAW process is used to perform the metal deposition. Then the thermo-mechanical simulation of WAAM process is based on welding models. It has been found that temperature, stress and strain fields of the 1st layer are tightly related to the welding operation [2,3,4,5]. Some numerical analyses are carried out using either the Eulerian steady state [6] or Lagrangian transient approach [7]. The deposit is either fully considered at the beginning of the simulation or scaled with material addition techniques. These techniques involve mesh activations [6, 8], simulation of molten metal drop with volume of fluid (VOF) method [9], surface energy minimization [10] or level set approach [11]. In this work, the technique consists in adding an increment of material at each time step, resulting in the length of the deposit being time dependant. The cold metal transfer (CMT) allows welding with low melting energies. The CMT uses a short circuit–controlled transfer thanks to an accurate control of electric waveforms (welding current, arc voltage) and wire feeding (Fig. 1). The cold metal transfer process is interesting for WAAM applications.

CMT electrical waveforms monitored during a deposition procedure (arc voltage is in blue and current is in red)
This work has been facilitated through the collaboration in the NeT (Neutron Techniques Standardization for Structural Integrity) European Network especially for the measurement of residual stresses with neutron diffraction technique at Helmholtz Centre Berlin.
2 Thermo-mechanical modelling
The thermo-mechanical model stated hereafter is based on two strong assumptions: 2D plane stress assumption and real-time scalable deposit. The experimental work consists in the deposition of a vertical wall, made up of five weld runs, along the longitudinal direction as depicted in Fig. 2. Such experimental setup is similar to a 2D plane stress condition as the thickness is smaller than the two other dimensions. The base plate (BP) is clamped on one side and free on the opposite one. The considered material is 316 L stainless steel with an elastoplastic Chaboche model available in Code_ Aster (mixed kinematic-isotropic hardening) [12]. The deposit geometry is scaled according to the simulation time. The material addition is based on a relationship between the following process parameters: welding speed, wire feed, time step and wire diameter. It requires the definition of new deposit geometry as well as a new mesh grid of the updated geometry. The temperature and mechanical (displacements, strains and stresses) fields computed at time tn are used as initial conditions for the updated geometry at time tn + 1 (consequently to a new material addition) as shown in Fig. 3. The 2D plane stress assumption leads to reduce the computational time in comparison with a full 3D thermo-mechanical analysis.

2D geometry used for the numerical study with scalable deposit by adding an increment of material ∆Ω at each time step
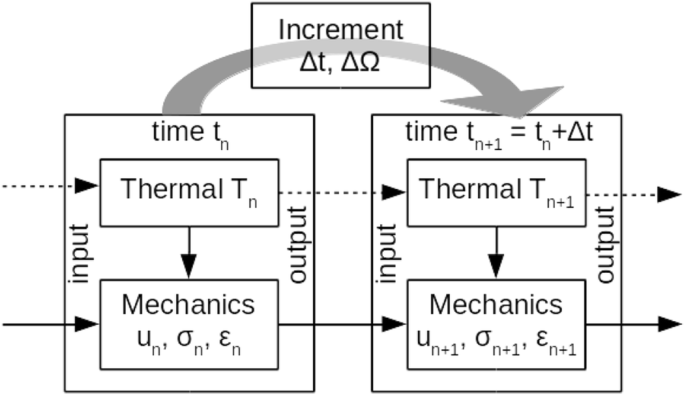
Procedure of the thermo-mechanical simulation. First the thermal problem is solved at time tn and then the thermal loading is applied on the mechanical problem. At time tn + 1, the deposit geometry is updated by an addition of material and the thermal and mechanical problems are initialized with the previous computed data at tn. The two computations are restarted for time tn + 1
2.1 Assumptions
The WAAM process involves many physical phenomena such as electromagnetism, heat and mass transfer, metallurgy and mechanics. In this work, the heat conduction and mechanical phenomena are only considered. No metallurgical transformation is considered as the stainless steel 316 L has a stable austenitic structure in the temperature range 20 to 1450 °C [13]. No fluid flow analysis is performed and neither arc pressure nor Marangoni or Lorentz forces affect the weld pool. This last assumption (Lorentz force) can be justified as the welding current is lower than 200 A [14]. The effect of molten metal flows in the weld pool is taken into account by varying the thermal conductivity of SS 316 L. The problem is solved in a weak coupling approach: first the thermal loading is solved and then the temperature field is used as input data of the mechanical problem. The stated problems are studied in transient state. The heat source generated by the welding source (through the electrical arc) is modelled with a double Gaussian [15] as an inner source in the heat equation. Furthermore, the thermal problem is solved under enthalpy formulation in order to both ease the numerical convergence due to the high temperature gradient generated and take into account the latent heat of fusion. The mechanical analysis is performed under 2D plane stress and small deformation theory. The SS 316 L thermal and mechanical properties (specific heat, thermal conductivity, Young modulus, yield stress, thermal expansion coefficient, etc.) are temperature dependent. SS 316 L material behaviour is supposed to be elastoplastic with a mixed kinematic-isotropic hardening (or Chaboche like model). In addition, a viscous restoration was implemented [10].
2.2 Thermal modelling
The symbol Ω refers to the geometrical domain defined by the base plate, the layer deposited and the material addition. x,y are the space coordinates in R2, t ϵ I is the time variable, T is the temperature state variable (T = T(x,y,t)) and H is the enthalpy state variable. The energy equation is:
where ρ is the mass density, Cp is the specific heat, k is the thermal conductivity, Q = Q(x,y,t) is an inner heat source and Qcv is an averaged convective exchange due to the heat loss with the surrounding environment.
The following equations are associated to (1) in order to get a unique solution. The initial condition (t = 0 s) was defined as:
Two different kinds of boundary conditions are defined on the frontiers of the studied domain Ω. The contact between the clamping system and the base plate is modelled with a Neumann condition:
Robin condition is affected to all other boundaries to take into account the convective exchanges between the surroundings and the system base plate deposit:
where ∂Ω1and ∂Ω2 are the boundaries of the domain Ω = {BP and deposits}.
T0 is the surrounding temperature of the laboratory. h is the convective exchange coefficient due to the motion of air/gas shielding. n is the outer normal vector to the considered boundary ∂Ω.
Moreover, the temperature of the new addition of elementary material is set to Tdroplet [16].
The right term of Eq. (1) Q(x,y,t) represents the absorbed energy from the electric arc. A Gaussian volume expression [17, 18] is used for modelling this heat source term as follows:
where a, b and c are the Gaussian radius; e is the BP thickness; and Q0 = ηUI where η is the process efficiency, U is the welding arc voltage and I is the welding current. Such heat source modelling is well suited for arc welding processes [15].
The expression of last source term due to the heat loss with the surrounding air Qcv(x, y, t) is:
2.3 Mechanical modelling
At each time step, the mechanical problem consists in solving the static equilibrium equations as it is not coupled to the thermal problem. The static equilibrium equation is:
The total incremental strain is calculated from incremental displacements during the nonlinear finite element analysis such as:
Under the small deformation theory, the total incremental strain can be decomposed in elastic term and inelastic terms as follows:
where ∆εel,∆εth,∆εp and ∆εvp are respectively the elastic, thermal, plastic and viscoplastic total incremental strains. The total incremental viscoplastic strain is supposed to be equal to 0. The thermal strain can be expressed as follows in the absence of metallurgical transformations:
where α is the coefficient of thermal expansion and Tref is a reference temperature equal to the laboratory temperature in our case.
The material behaviour of SS 316 L is supposed to be elastoplastic with a Chaboche-like model (mix of kinematic and isotropic hardening) [12, 19,20,21]. Briefly, the equations of the model implemented in Code_Aster are:
The function C(p), γ(p) and R(p) are defined as follows:
The parameters k and γ∞ are set to 1 and w is taken equal to 0. As a consequence, the remaining parameters are R0, R∞, b for the isotropic part and C∞, γ0 for the kinematic part. All the parameters are temperature dependent. The values of these parameters are shown in Table 1.
Then viscous restoration of the hardening is considered. It is assumed that there is no viscous restoration effect under 600 °C. The viscous restoration effect appears at 600 °C to become total and instantaneous above 1000 °C. Depradeux [18] evaluated this effect by carrying out Satoh’s experiments [22] with SS 316 L samples.
The equation of equilibrium is also associated to the following boundary conditions:
-
The left boundary of the base plate (see Fig. 2) is clamped so any displacements is prescribed;
-
The other boundaries ∂Ω of the base plate are free.
Moreover, the initial stress and strain fields are set to 0 at the initial time (t = 0 s) of the mechanical simulation.
A last condition is imposed to the stress value inside the molten zone: σ = 0 MPa when the temperature is over Tfusion = 1450 °C. This condition traduces the fact that the solid to liquid phase change cancels any developed plastic strains before the melting.
2.4 Material increment procedure
As the thermo-mechanical problem is weakly coupled, the temperature field is used as input data for the mechanical problem at each time step. Then a mesh grid is used for the thermal problem while another is employed for the mechanical one. First-order triangular finite elements compose the thermal mesh. The mechanical mesh is made of 2nd-order triangular finite elements in order to get smoother stress evolution into the finite element.
The increment of material is taken into account at each time step in the aim to simulate as close as possible the WAAM process. Figure 4a shows the BP and deposit mesh grid at a given time and Fig. 4b displays the new mesh grid at a later time with a longer deposit.

a Thermal mesh grid at time ti. The zone below the deposit front is refined because of the presence of high-temperature gradients. b Thermal meshgrid at time t>>ti with rescaled deposit after several material increments
Conversely to the mesh activation technique, the mesh is built as long as the simulation in order to reduce the computational time and to avoid any fictitious thermal gradient and strain in deactivated finite elements. The increment of material is rectangular and it is assessed from process parameters: welding speed, wire feed rate and wire diameter. The temperature field computed at the previous time is then projected on the new mesh. A refined area is located below the material increment because of the presence of high-temperature gradient (thus a high stress gradient).
3 Numerical results and discussions
The process parameters used for the simulation are the ones set on the GMAW-CMT welding source and they are summarized in Table 2. The values of the welding voltage and current are the average of the electrical waveforms monitored on the CMT welding source (see Fig. 1). The standoff distance or contact tip to working distance (CTWD) is checked before each deposition operation and set to 15 mm with the help of gauge block.
The Gaussian parameters a, b, c (a = 2.5 mm, b = 9 mm, c = 5 mm) of the heat source Q(x,y,t) and the process efficiency η (η = 0.8) are tuned in sort of the computed liquidus isotherm matched with the heat affected–fused interface observed from the macrography displayed in Fig. 5. The penetration depth is estimated to 0.9 mm for the first deposit according to the macrography displayed in Fig. 5. A high-speed camera is used both to record the deposition operation and to get the weld pool length as presented in Fig. 6. The deposit length is 100 mm and its average height is about 2 mm.

Macrography of the 5 deposits. The dashed line represents the initial shape of the substrate before the deposition of the 1st layer

The weld pool length was evaluated to 15 mm from a snapshot of the deposition process
3.1 Thermal results
As mentioned previously, the molten metal flow is not computed but is taken into account by varying artificially the thermal conductivity of SS316L. The thermal conductivity is multiplied by 5 for temperature greater than the SS 316 L melting temperature [23]. Furthermore, the initial temperature of the material increment is set to Tdroplet. The heat from the electric arc is modelled with a volume heat source as seen in Eq. (4). The cooling time for each layer is 35 s. The temperature fields are presented in Fig. 7a–e at the half of the deposited layer. Layers are deposited alternately such as the starting point of the next layer is the ending point of the previous one.

a–e Temperature fields calculated for the 5 deposits. The white line represents the solid/liquid interface which delimits the weld pool (1450 °C). The schematic positions of sensors TC1 and TC2 are staggered along the vertical axis for easy reading; they are really located respectively at 3 mm and 5 mm underneath the first layer
From the top to the bottom of Fig. 7a–e, the first figure corresponds to the deposition of the first layer and so on until the fifth layer. A white curved line shows the liquidus isotherm that is equal to 1450 °C. A high thermal gradient is observed in front of the material increment as well as at the base plate-layer interface. At the back, the molten metal pool is quite stretched out with a length of 14.7 mm quite close to the experimental one (it has been measured to 15 mm) (see Fig. 6). The calculated penetration is about 0.85 mm for the 1st layer, which is very similar to the experimental one.
According to the temperature fields computed at half layer (when the steady state is reached), the molten pool size increases with the number of layers because the heat sink effect from the BP is less influent on the fifth layer than on the first. The computed weld pool length is 14.7 mm for the first layer, 18.2 mm for the third and 19.5 mm for the fifth.
The last Fig. 7e presents three isotherms: the liquidus isotherm (1450 °C), the complete restoration isotherm (1000 °C) and the starting restoration isotherm (600 °C). During the last deposition of the layer, the plastic strain in the last three deposits is totally restored (isotherm 1000 °C) cancelling any previous thermal cyclic effect. The restoration effect started between 5 to 10 mm below the 1st layer-base plate interface.
Figure 8 depicts the calculated and measured thermal cycles at sensor located at 3 mm and 5 mm underneath the 1st layer as schematically shown in Fig. 7a. As we can see, the 5 thermal cycles are well observed. Moreover, calculated and measured thermal cycles are in good agreement for the two sensors. For the nearest sensor of the deposit zone (TC1), the highest temperature peak is observed during the deposition of the 1st layer with a maximum temperature close to 850 °C. Then the peak of temperature decreases as the number of deposits increases. This temperature decrease is due to the addition of matter. The cooling cycles are quite similar to the one observed during a welding operation [24]. The cooling rate is about 17 °C/s for the 1st deposit, about 10 °C/s for the second and ended up with a value of 7 °C/s in the few seconds following the last peak of temperature. The slowdown in the cooling rate is normal as the BP and deposit have just cooled for 35 s before making a new deposit and did not restart at room temperature. The other sensor (TC2) presents similar evolution with lower peak temperatures due to its location. We can also note that the final cooling period to the room temperature is nearly the same for the two sensors, both numerically and experimentally.

Comparison between calculated and measured temperatures for the two sensors TC1 and TC2 located in the base plate and respectively 3 mm and 5 mm underneath the middle of the 1st deposit (see Fig. 7)
3.2 Mechanical results
The presented thermal cycles have been employed as loading for the mechanical analysis in order to get the distortion, the residual strain and stress fields. The residual longitudinal stress \( {\sigma}_{xx}^R \) field is depicted in Fig. 9 after 5 deposits when the base plate and deposits have reached 20 °C. At x = 0 mm, where the base plate is clamped, it is noticed that the values of \( {\sigma}_{xx}^R \) are not null whereas, at the opposite free boundary x = 124 mm, \( {\sigma}_{xx}^R \) is almost equal to 0 along this vertical boundary because of the boundary condition imposed on this frontier (free boundary). One can remark that the bottom of the base plate and the deposits are experiencing tensile stresses while its middle is under compressive stresses (Fig. 10).

Residual longitudinal stress (\( {\upsigma}_{\mathrm{xx}}^{\mathrm{R}} \)) field after 5 deposits. The white vertical line is used for plotting the longitudinal stress distribution along this line

Distribution of the longitudinal stress (σxx) along a vertical line at the middle of base plate-deposits (see Fig. 9). The deposition strategy is alternative
The distribution of σxx along the vertical line (see Fig. 9) confirms the qualitative statement made about Fig. 9 after cooling of the 5th layer to the room temperature. The bottom part of the BP is under tensile stress until y < 10 mm. This part is slightly heat affected so this plasticized zone is due to the upward bending of the base plate. In this zone, the longitudinal stress starts at 200 MPa and decreases slowly to 150 MPa around y ~ 10 mm before dropping to − 140 MPa at y ~ 15 mm. Inside the middle of the BP, compressive stresses are developed between 10 mm < y < 40 mm with an averaged stress value to − 120 MPa. This zone equilibrates the tensile stresses observed at the bottom of the BP and the other one at the top of the BP (including the deposits) for y > 40 mm. The top of the BP reaches a maximum stress value of 180 MPa at y ~ 46 mm. The tensile stress drops from this maximum to − 20 MPa at the surface of the last deposit. This last observation shows that only the last deposit is under compressive stress while the 4 previous are under tensile stresses. Nevertheless, this zone is mainly under tensile stresses and this is known as being a negative effect on the life cycle of the mechanical part (e.g. low resistance to cracking phenomena). Some approaches [25, 26] propose to apply a mechanical load, with a special rolling tool, after each deposit to generate high compressive stresses in the last layers. Indeed, if the stress in the hot deposits is reduced, it will become compressive after cooling.
Figure 11 presents the computed residual longitudinal stress along the vertical axis after the 5th run has reached the laboratory temperature with the measured longitudinal stress with neutron diffraction technique. The experimental measurements were conducted at the reactor of Helmholtz Centre Berlin. The process parameters used for making the 5 deposits were the one used for the thermo-mechanical simulations (Table 2). The numerical results are in good agreement with the measured longitudinal stress along the vertical axis. The three main zones are observed: the bottom base plate is under tensile stress followed with a compressive zone in the mid-baseplate then the longitudinal stress reached a peak, around 200 MPa at y ~ 0.54 mm so into the 2nd / 3rd deposits before finally decreasing to the surface of the last layer, ending at a value around 100 MPa. All the layers exhibit a tensile longitudinal stress unlike the numerical result.

Comparison between numerical and measured longitudinal residual stresses \( {\upsigma}_{\mathrm{xx}}^{\mathrm{R}} \). The longitudinal stresses were measured with neutron diffraction technique at Helmholtz Centre Berlin.
Figure 12 presents the evolution of the longitudinal stress σxx at a point located in the 1st layer (x = 80 mm and y = 51 mm; see Fig. 9). The evolution of the longitudinal stress is plotted for 2 different deposition strategies: (a) the layers are deposited alternatively that is to say that the deposit origin is the end of the previous one; (b) the layers are deposited in the same direction starting at the same original point. There is a slight difference especially due to the position of the analysis point reached at different time for each strategy deposition. The change in deposition direction (a) or (b) does not modify the longitudinal stress distribution: no effect is noticed because the thermal loading is the same for the two mechanical analyses and, furthermore, this zone is subject to viscous restoration (see Fig. 7e.

Evolution of the longitudinal stress (σxx) for a point in the first layer (x = 80 mm and y = 51 mm as shown in Fig. 9) for two deposition strategies: (a) the layers are deposited alternatively that is to say that the deposit origin is the end of the previous one; (b) the layers are deposited in the same direction from the same origin.
The vertical displacement of the BP and deposits is plotted in Fig. 13. The left side of the base plate did not move as a prescribed displacements condition is applied. The free end side of the base plate moved upward as it is shown in Fig. 13. The maximum vertical displacement is about 1.1 mm for the deposition strategy (a) and about 1.4 mm for the deposition strategy (b). The final shape is a consequence of the residual longitudinal stress field presented in Fig. 9: tensile stresses at the bottom of the base plate. Preliminary experiences show that the maximum displacement of this point is about 0.6 mm for layers deposited alternatively.

Vertical displacement of the BP and deposits once the whole temperature dropped to the room temperature (20 °C)
4 Conclusion
In this work, a thermo-mechanical model has been presented in the aim to predict both distortions and residual stresses into a metallic part elaborated with the wire + arc additive manufacturing technique. The studied geometry is two-dimensional as the base plate used is thinner than the two other dimensions. This geometrical approach made possible to reduce the computational times. Furthermore, the deposit geometry varied along the simulation time. At each time step, an increment of material is added. A special numerical procedure was developed to generate a new geometry as well as a new mesh with automated transfer of all computed data (temperature, strain, stress) to the new geometry. The thermo-mechanical analyses are performed in a weak coupling way. Firstly, the thermal simulation is solved and the thermal field is sent to the mechanical problem. The base plate and metallic wire are made of stainless steel 316 L. This material is supposed to be elasto-plastic with a Chaboche-like model.
The computed longitudinal stress has been compared with the measurement achieved with neutron diffraction technique. The computed longitudinal stress is in good agreement with the measured ones. Three main zones are observed: the bottom base plate is under tensile stress followed with a compressive zone in the mid-baseplate then the longitudinal stress reached a peak before decreasing again. All the layers exhibit a tensile longitudinal stress unlike the numerical result. However, the computed displacement of the free side of the base plate seems to overestimate the experimental observations.
The numerical approach used for the deposit with time dependent length is interesting but rather limited for investigating large parts with complex shapes.
References
Ding D, Pan Z, Cuiuri D, Li H (2015) Wire-feed additive manufacturing of metal components: technologies, developments and future interests. Int J Adv Manuf Technol 81:465–481
Colegrove P, Ikeagu C, Thistlethwaite A, Williams S, Nagy T, Suder W, Steuwer A, Pirling T (2009) Welding process impact on residual stress and distortion. Sci Technol Weld Join 14:717–725
Ding Y, Liu Z, Yan JB, Zong L (2017) Experimental and numerical studies on residual stress in wide butt welds. Adv Mater Sci Eng 3:1–9
Choi J, Mazumder J (2002) Numerical and experimental analysis for solidification and residual stress in the GMAW process for AISI stainless steel. J Mater Sci 37:2143–2158
Hill MR, Nelson DV (1996) Determining residual stress through the thickness of a welded plate, New York, ASME 327:29–36
Ding J, Colegrove P, Mehnen J, Ganguly S, Sequeira Almeida PM, Wang F, Williams S (2011) Thermo-mechanical analysis of wire and arc additive layer manufacturing process on large multi-layer parts. Comput Mater Sci 50:3315–3322
Mukherjee T, Zhang W, Debroy T (2017) An improved prediction of residual stresses and distortion in additive manufacturing. Comput Mater Sci 126:360–372
Anca A, Fachinotti VD, Escobar-Palafox G, Cardona A (2011) Computational modelling of shaped metal deposition. Int J Numer Methods Eng 85:84–106
Hu J, Tsai HL (2007) Heat and mass transfer in gas metal arc welding. Part I: The arc. Int J Heat Mass Transf 50:833–846
Wu CS, Chen J, Zhang YM (2007) Numerical analysis of both front- and back-side deformation of fully-penetrated CYAW weld pool surfaces. Comput Mater Sci 39:635–642
Demaison O, Guillemot G, Bellet M (2013) Numerical modelling of hybrid arc/laser welding: a coupled approach to weld bead formation and residual stresses, international conference on joining materials. Helsingor, Denmark
Chaboche J-L (2008) A review of some plasticity and viscoplasticity constitutive theories. Int J Plast 24:1642–1693
Depradeux L, Jullien JF (2004) 2D and 3D numerical simulations of TIG welding of a 316L steel sheet. Revue Européenne des Éléments Finis 13:269–288
Rokhlin S, Guu A (1993) A study of arc force, pool depression, and weld penetration during gas tungsten arc welding. Weld J 72:391–390
Goldak J, Chakraverti A, Bibby M (1984) A new finite element model for welding heat sources. Metall Trans B 15B:299–305
Monier R (2016) Étude expérimentale du comportement dynamique des phases liquides en soudage par court-circuit contrôlé, Thèse de doctorat de l’université de Montpellier, p 149
Kim IS, Basu A (1998) A mathematical model of heat transfer and fluid flow in the gas metal arc welding process. J Mater Process Technol 77:17–24
Depradeux L (2004) Simulation numérique du soudage Acier 316L Validation sur cas tests de complexité croissante, Thèse de doctorat de l’INSA de Lyon, p 231
Proix JM, CodeAster (2013) Elasto-visco-plastic Chaboche constitutive law, R5.03.04, p 26
Muránsky O, Hamelina CJ, Smith MC, Bendeich J, Edwards L (2012) The effect of plasticity theory on predicted residual stress fields in numerical weld analyses. Comput Mater Sci 54:125–134
Depradeux L, Coquard R (2018) Influence of viscoplasticity, hardening, and annealing effects during the welding of a three-pass slot weld (NET-TG4 round robin). Int J Press Vessel Pip 164:39–54
Satoh K, Matsui S, Machida T (1966) Thermal stresses developed in high strength steels subjected to thermal cycles simulating weld heat-affected zone. Journal of the Japan Welding Society 35:780-789
Mahin K, Winters W, Holden T, Hosbons R (1991) Prediction and measurements of residual elastic strain distributions in gas tungsten arc welds. Weld J 70:245–260
Poorhaydari K, Patchett BM, Ivey DG (2005) Estimation of cooling rate in the welding of plates with intermediate thickness cooling rates estimated by Rosenthal’s thick- and thin-plate solutions can be modified by a weighting factor to account for intermediate values of plate thickness. Weld J 84:149-s–155-s
Martina F, Roy MJ, Szost BA, Terzi S, Colegrove PA, Williams SW, Withers PJ, Meyer J, Hofmann M (2016) Residual stress of as-deposited and rolled wire + arc additive manufacturing Ti–6Al–4V components. Mater Sci Technol 32:1439–1448
Colegrove PA, Coules HE, Fairman J, Martina F, Kashoob T, Mamash H, Cozzolino LD (2013) Microstructure and residual stress improvement in wire and arc additively manufactured parts through high-pressure rolling. J Mater Process Technol 1782:1791
Acknowledgments
The authors are extremely grateful for the contributions of all the participants in Neutron Techniques Standardization for Structural Integrity European Network (NeT) Task Group 9 on additive manufacturing.
Author information
Authors and Affiliations
Corresponding author
Additional information
Publisher’s note
Springer Nature remains neutral with regard to jurisdictional claims in published maps and institutional affiliations.
Recommended for publication by Commission I - Additive Manufacturing, Surfacing, and Thermal Cutting
This article is part of the collection Additive Manufacturing – Processes, Simulation and Inspection
Rights and permissions
About this article

Cite this article
Cambon, C., Rouquette, S., Bendaoud, I. et al. Thermo-mechanical simulation of overlaid layers made with wire + arc additive manufacturing and GMAW-cold metal transfer. Weld World 64, 1427–1435 (2020). https://doi.org/10.1007/s40194-020-00951-x
Received:
Accepted:
Published:
Issue Date:
DOI: https://doi.org/10.1007/s40194-020-00951-x