
Abstract
The goal of this study was to assess the impact of the introduction of various waste management methods on the amount of greenhouse gas emissions from these activities. The assessment was carried out on the example of the Russian waste management sector. For this purpose, three scenarios had been elaborated for the development of the Russian waste management sector: Basic scenario, Reactive scenario and Innovative scenario. For each of the scenarios, the amount of greenhouse gas emissions generated during waste management was calculated. The calculation was based on the 2006 Intergovernmental Panel on Climate Change Guidelines for National Greenhouse Gas Inventories. The results of the greenhouse gas net emissions calculation are as follows: 64 Mt CO2-eq./a for the basic scenario, 12.8 Mt CO2-eq./a for the reactive scenario, and 3.7 Mt CO2-eq./a for the innovative scenario. An assessment was made of the impact of the introduction of various waste treatment technologies on the amounts of greenhouse gas emissions generated in the waste management sector. An important factor influencing the reduction in greenhouse gas emissions from landfills is the recovery and thermal utilization of 60% of the generated landfill gas. The introduction of a separate collection system that allows to separately collect 20% of the total amount of generated municipal solid waste along with twofold increase in the share of incinerated waste leads to a more than threefold reduction in total greenhouse gas emissions from the waste management sector.
Introduction
Population growth, urbanization and changing life style have resulted in increased amounts of generated solid waste, which poses serious challenges for many cities and authorities around the world (Abu Qdais et al. 2019; Chen 2018; Dedinec et al. 2015). In 2011, world cities generated about 1.3 Gt of solid waste; this amount is expected to increase to 2.2 Gt by 2025 (Hoornweg and Bhada-Tata 2012). Unless properly managed on a national level, solid waste causes several environmental and public health problems, which is adversely reflected on the economic development of a country (Abu Qdais 2007; Kaza et al. 2018).
One of the important environmental impact of the waste management sector are the generated greenhouse gas (GHG) emissions. These emissions come mostly from the release of methane from organic waste decomposition in landfills (Wuensch and Kocina 2019). The waste management sector is responsible for 1.6 Gt carbon dioxide equivalents (CO2-eq.) of the global GHG direct anthropogenic emissions per year (Fischedick et al. 2014), which accounts for approx. 4% of the global GHG emissions (Papageorgiou et al. 2009; Vergara and Tchobanoglous 2012). The disposal of municipal solid waste (MSW) contributes to 0.67 Gt CO2-eq./a worldwide (Fischedick et al. 2014), which is approx. 1.4% of the global GHG emissions. Per capita emissions in developed countries are estimated to be about 500 kg CO2-eq./a (Wuensch and Kocina 2019), while in the developing and emerging countries, it is around 100 kg CO2-eq./a per person. This low contribution of waste management sector comparing to other sectors of the economy, such as energy and transportation, might be the reason for the small amount of research that aims to study GHG emissions from the waste management sector (Chung et al. 2018).
However, it is important to consider that the mitigation of GHG emissions from waste management sector is relatively simple and cost-effective as compared to other sectors of the economy. Several studies proved that separate waste collection and composting of biowaste as well as landfilling with landfill gas recovery is currently found to be one of the most effective and economically sound GHG emissions mitigation options (Chen 2018; EI-Fadel and Sbayti 2000; Yedla and Sindhu 2016; Yılmaz and Abdulvahitoğlu 2019). Metz et al. 2001 estimated that 75% of the savings of methane recovered from landfills can be achieved at net negative direct cost, and 25% at cost of about 20 US$/Mg CO2-eq./a. In any country of the world, the potential of the waste management sector is not yet fully utilized; the implementation of relatively simple and inexpensive waste treatment technologies might contribute to national GHG mitigation goals and convert the sector from a net emitter into a net reducer of GHG emissions (Crawford et al. 2009; Voigt et al. 2015; Wuensch and Simon 2017).
While there are many well-established solutions and technologies for the reduction in GHG emitted from the waste sector, there is no universal set of options that suits all the countries. When thinking to adapt certain solutions of GHG mitigation, it is important to take into account local circumstances such as waste quantities and composition, available infrastructure, economic resources and climate (Crawford et al. 2009).
It is expedient to assess how the introduction of modern waste management methods affects the amount of GHG emissions from the waste management process by the example of those countries in which the waste management sector is undergoing reform. These countries include the Russian Federation, where the values of targets for the waste management industry until 2030 are legally established (Government of the Russian Federation 2018). In addition, on February 8, 2021, Russia issued a Presidential Decree “On Measures to Implement State Scientific and Technical Policy in the Field of Ecology and Climate,” which prescribes the creation of a Federal Program for the Creation and Implementation of Science-Intensive Technologies to Reduce Greenhouse Gas Emissions (Decree of the President of the Russian Federation 2021).
The goal of this study was to quantify the impact of the introduction of various modern waste treatment methods on the volume of GHG emissions from the waste management sector using the example of Russia. To achieve this goal, the following objectives were set and solved:
-
1.
Elaborate scenarios for the development of the waste management industry, based on the established Industry Development Strategy for the period up to 2030 (Government of the Russian Federation 2018)
-
2.
Determine the weighted average morphological composition of MSW;
-
3.
Select emission factors for various waste treatment methods;
-
4.
Calculate GHG emissions under each scenario and analyze the calculation results.
The study was conducted from November 2019 to May 2020; the text was updated in March 2021 in connection with the changed situation, as climate change issues began to play an important role on the agenda in Russia. The study and its calculations are theoretical in nature and did not involve experimental research. It was carried out by the authors at their place of work—in Germany (Technische Universität Dresden, Merseburg University of Applied Sciences) and in Russia (Perm National Research Polytechnic University).
Greenhouse gas emissions related to municipal solid waste management sector in Russia
According to the State Report on the Status of Environmental Protection of the Russian Federation of 2018 (Ministry of Natural Resources and Ecology of the Russian Federation 2019), the volume of generated MSW has increased by 17% from 235.4 to 275.4 m3 (49.9 to 58.4 Mt) during the time period 2010 to 2018. With approx. 147 million inhabitants, the annual per capita generation rate is about 400 kg. Until now, MSW management in Russia has been disposal driven. More than 90% of MSW generated is transported to landfills and open dump sites; 30% of the landfills do not meet sanitary requirements (Korobova et al. 2014; Tulokhonova and Ulanova 2013). According to the State Register of the Waste Disposal Facilities in Russia, there were 1,038 MSW landfills and 2,275 unregistered dump sites at the end of 2018 (Rosprirodnadzor 2019). Such waste management practices are neither safe nor sustainable (Fedotkina et al. 2019), as they pose high public health and environmental risks and lead to the loss of valuable recyclable materials such as paper, glass, metals and plastics which account for an annual amount of about 15 Mt (Korobova et al. 2014).
According to the United Nations Framework Convention on Climate Change (UNFCCC) requirements, the signatory parties of the convention need to prepare and submit national communication reports that document GHG emissions and sinks in each country by conducting an inventory based on Intergovernmental Panel on Climate Change (IPCC) guidelines (UNFCCC 2006). Being the fourth biggest global emitter of GHG emissions, Russia submitted its latest National Inventory Report (NIR) to UNFCCC in April 2019. The report documents national GHG emissions by source and removals by sink (Russian Federation 2019). The total emissions had been decreased from 3.2 Gt in 1990 to about 2.2 Gt of CO2-eq. in 2017, which implies 30% reduction over a period of 27 years. At the same time, the emissions from the disposal of solid waste increased from 33 Mt in 1990 by more than 100% to 69 Mt CO2-eq. in 2017. In terms of methane emissions, Russian solid waste disposal sector is the second largest emitter in the country and accounts for 18.1% of the total emitted methane mostly in the form of landfill gas, while the energy sector is responsible for 61.2% of methane emissions (Russian Federation 2019).
Landfill gas recovery from MSW landfills is not widely practiced in the Russian Federation. According to the statistics of the Russian Ministry of Natural Resources and Ecology, the share of landfill gas energy in the total renewable energy produced in Russia was 8.61%, 5.43%, 2.77% and 2.59% in 2011, 2012, 2013 and 2014, respectively (Arkharov et al. 2016). Different studies show that the potential of recovering energy from landfill gas in the Russian Federation is high (Arkharov et al. 2016; Sliusar and Armisheva 2013; Starostina et al. 2018; Volynkina et al. 2009).
Waste-to-energy technology is still in its infancy in Russia; the country is lagging in this area (Tugov 2013). Despite that, there is a great interest among the public as well as the private sector in the possibilities of the recovery of energy from MSW. In April 2014, the State Program “Energy Efficiency and Energy Development” was approved, which includes a subprogram on the development of renewable energy sources in the Russian Federation (Government of the Russian Federation 2014). In this program, MSW was considered as a source of renewable energy. Until the year 2017, there were only four waste incineration plants in Moscow region processing 655,000 Mg MSW per year, with only one incinerator recovering energy in form of heat and electricity (Dashieva 2017). In the nearest future, the construction of four additional incinerators in Moscow region and one in the city of Kazan is planned. The annual total combined capacity of the four new plants in Moscow will be about 2.8 Mt (Bioenergy International 2019). In the Kazan incinerator, 0.55 Mt of MSW will be treated annually, which eventually will allow ceasing of landfilling of solid waste in the Republic of Tatarstan (Bioenergy International 2019; Regnum 2017). The construction of these five new incineration plants is part of the Comprehensive Municipal Solid Waste Strategy adopted by the Russian government in 2013 (Plastinina et al. 2019). The focus of this strategy is the reduction in the amount of landfilled waste by creating an integrated management system and industrial recycling of waste.
Separate collection of MSW and the recycling of different waste fractions at the moment plays only a negligible role in the Russian Federation.
Materials and methods
Scenarios of the development of municipal solid waste management system
To assess the current situation and the potential for reducing GHG emissions from the MSW management industry, three scenarios of the development of the Russian waste management system had been elaborated. The developed scenarios are based on the official statistics data on the amount of waste generated and treated, and also on the adopted legislative acts that determine the development directions of the Russian waste management system and set targets in these areas (Council for Strategic Development and National Projects 2018). That is why the developed scenarios include such measures to improve the waste management system as elimination of unauthorized dump sites, introduction of landfill gas collection and utilization systems at the landfills, incineration of waste with energy recovery, separate collection of waste, and recycling of utilizable waste fractions, and do not include other waste-to-energy technologies and waste treatment strategies contributing to climate change mitigation. Separate collection and treatment of biowaste is not applied in the national waste management strategy of the Russian Federation (Government of the Russian Federation 2018) and therefore was beyond the scope of the elaborated scenarios. For the purpose of the current study, three scenarios had been developed.
Scenario 1: BASIC (business as usual)
This scenario is based on the current waste management practices, under which 90% of the generated mixed MSW is disposed of on landfills and dump sites. According to the 6th National Communication Report of the Russian Federation to UNFCCC, the total MSW generated that found its way to managed landfillsFootnote 1 was 49.209 Mt in 2009, while the amount of MSW disposed in unmanaged disposal sites (dumps) was 5.067 Mt. In 2017, the amount of MSW generated was 58.4 Mt with 10% being diverted from landfills: 3% incinerated and 7% recycled (Ministry of Natural Resources and Ecology of the Russian Federation 2019). According to Russian Federation 2019, landfill gas recovery is not taking place at Russian landfills. This scenario implies the closure of unorganized dump sites, with all the waste to be disposed of on managed dump sites or landfills only.
Scenario 2: REACTIVE (moderate development)
The reactive scenario implies a moderate development of the waste management sector, based on the construction of several large incinerators, a small increase in the share of waste to be recycled and the disposal of remaining waste at sanitary landfills,Footnote 2 with the closure of all the existing unorganized dump sites. In this scenario, all Russian regions were divided into two clusters: the first cluster included the city of Moscow and the Republic of Tatarstan, where new waste incinerators are being built, and the second cluster which includes — all the other cities and regions.
Moscow and the Republic of Tatarstan
In Moscow and Tatarstan together, 8.586 Mt of mixed MSW is generated annually (Cabinet of Ministers of the Republic of Tatarstan 2018; Department of Housing and Communal Services of the city of Moscow 2019). In an attempt to introduce the waste-to-energy technology in Russia, an international consortium that consists of Swiss, Japanese and Russian firms is currently involved in constructing five state-of-the-art incineration plants in these two areas. Four incinerators are to be built in the Moscow region and one in Kazan, the capital of the Republic of Tatarstan. The annual combined capacity of the four plants in Moscow will be about 2.8 Mt of MSW, and the one of Kazan 0.55 Mt (Bioenergy International 2019; Regnum 2017). In this scenario, it is assumed that compared to the basic scenario, the share of waste undergone recycling is increased to 10%, i.e., 0.859 Mt annually. Furthermore, these 10% would be transferred to recycling plants to recover secondary raw materials. The remaining 4.377 Mt of mixed MSW would be disposed of in sanitary landfills.
Other cities and regions
In the other cities and regions of Russia, in accordance with the Development Strategy of Waste Recycling Industry until 2030 (Government of the Russian Federation 2018), over two hundred new eco-techno parks (i.e., waste recycling complexes) will be built. These facilities will receive mixed MSW that will be sorted there for recycling purposes. Under this scenario, it is also assumed that compared to the basic scenario, the share of waste undergone recycling is increased to 10%, thus transferring 4.982 Mt annually of the mixed MSW to recycling plants. The remaining 44.932 Mt of MSW are disposed of in sanitary landfills.
Scenario 3: INNOVATIVE (active development)
This scenario is based on the legally established priority areas for the development of the industry (Council for Strategic Development and National Projects 2018; Government of the Russian Federation 2018). The scenario implies deep changes in the industry with the introduction of technologies for incineration, separate collection and recycling of waste. In this scenario, the regions of Russia are divided into three clusters, in accordance with the possibilities of improving the infrastructure for waste management and the need for secondary resources and energy received during the processing of waste. When determining the share of waste to which this or that treatment method is applied, federal targets (Council for Strategic Development and National Projects 2018; Government of the Russian Federation 2018) and estimates made by the World Bank (Korobova et al. 2014) were used.
Moscow and the Republic of Tatarstan
The first cluster includes two huge, densely populated urban agglomerations in which large incineration plants are under construction: Moscow and Tatarstan. With the construction of new waste incinerators, 3.35 Mt of mixed MSW will be incinerated annually. It is assumed that some 10% of mixed MSW (0.859 Mt) generated in these two regions is to be transferred to eco-techno parks for secondary raw material recovery. Some 20% of the MSW (1.712 Mt) is to be recovered from separately collected waste, and the rest of 2.66 Mt (31%) to be disposed of in sanitary landfills.
Cities with more than 0.5 million inhabitants
This cluster includes large urban agglomerations with developed industry and high demand for materials and energy resources. In this cluster, approx. 28 Mt of MSW is generated annually (Korobova et al. 2014). Under this scenario, it is assumed that waste incineration plants are also built in some larger cities, besides Moscow and Kazan. However, the exact quantity and capacity of these plants is yet unknown; it was assumed that in comparison with the basic scenario, in this scenario, the share of incinerated waste increased to 10%, the share of recycled waste to 15%, and a separate waste collection system is partially implemented. Hereby, 10% of the generated mixed MSW (2.79 Mt) is undergoing incineration, 15% (4.185 Mt) is transferred to sorting facilities for secondary raw material recovery, some 20% of the MSW (5.58 Mt) is recovered from separately collected waste and the rest 55% (15.345 Mt) is disposed of in sanitary landfills.
Smaller cities with less than 0.5 million inhabitants and rural areas
This cluster includes smaller cities and towns with some industrial enterprises, as well as rural areas. The amount of waste generated annually in this group of settlements is 21.914 Mt. It is assumed that no waste is incinerated, 15% of the mixed MSW (3.287 Mt) is transferred to sorting facilities for secondary raw material recovery, 10% (2.191 Mt) is recovered from separately collected waste, and the rest 75% (16.435 Mt) is disposed of in sanitary landfills.
Waste flow diagrams corresponding to the three scenarios with their input and output flows are shown in Fig. 1.
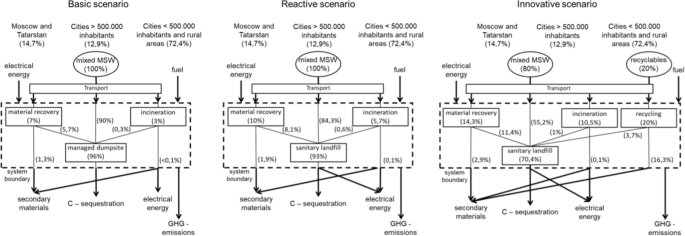
MSW management scenarios with model inputs and outputs
In all the three scenarios, mixed MSW is transferred to sorting facilities where the recovery of valuable materials by mostly hand sorting takes place. Detailed accounts of process efficiency for material recovery facilities, in terms of recovery rates and quality of recovered materials, are scarce in the published literature (Cimpan et al. 2015). In the study of Cimpan et al., 2015, at least three data sets were evaluated with the result that 13–45% of paper, 3–49% of glass, 35–84% of metals and 1–73% of plastics were recovered from the plant input of these materials. Two other studies report similar recovery rates between 60 and 95% for paper, glass, plastic and aluminum for hand and automatic sorting test trials (CalRecovery, Inc and PEER Consultants 1993; Hryb 2015). Based on this data and the results of the authors’ own experimental studies on manual waste sorting in Russia, the recovery rates for the most valuable waste fractions, including paper/cardboard, glass, metals and plastics had been calculated (Table 1). In the Scenario 3, separate collection of paper/cardboard, glass and plastic is introduced. Recovery rates related to the input of the corresponding waste type into each waste management cluster (see Table 1) for Moscow and Tatarstan as well as for the cities with more than 0.5 million inhabitants are considered to be higher than for the settlements with less than 0.5 million inhabitants.
For the comparison of GHG emissions of the three elaborated scenarios, a specific assessment model was elaborated.
Model structure
The calculation of the amounts of released and avoided GHG emissions for the different considered waste treatment technologies are based on the 2006 IPCC Guidelines for National Greenhouse Gas Inventories. The IPCC methodology is scientifically widely recognized and used internationally, which makes the results easy comprehensible and easier to compare with other studies.
For the elaboration of the model that would allow calculating the GHG balance emissions, the upstream-operating-downstream (UOD) framework (Gentil et al. 2009) was used, where direct emissions from waste management procedures and indirect emissions from upstream and downstream activities are differentiated. On the upstream side, the indirect GHG emissions, like those related to fuel and material extraction, processing and transport as well as plant construction and commissioning, are excluded from the consideration. Indirect emissions from infrastructure construction on the downstream side are outside the system boundaries and not accounted for as they are relatively low (Boldrin et al. 2009; Mohareb et al. 2011). Direct GHG emissions from the waste transport are also excluded from the system boundaries since they are negligible comparing to the direct emissions from the waste processing/treatment (Weitz et al. 2002; Wuensch and Simon 2017). Since indirect GHG emissions avoided due to energy and material substitution, as well as carbon sequestration in the downstream processes is significant, they are included into the model. The conceptual framework of the model and its boundaries are shown in Fig. 2.
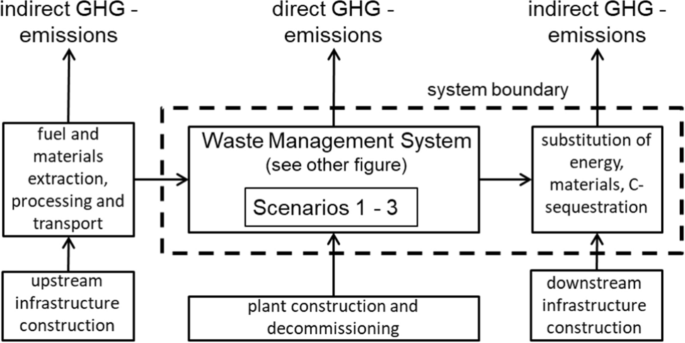
Conceptual framework of the model showing upstream and downstream processes along with the system boundaries [derived from Abu Qdais et al. (2019)]
The inputs to the model are waste (its quantity, composition, carbon content fixed in biomass and no-biomass), as well as energy and fuel that are used in the waste treatment processes (see Table 2 and Figs. 1, 2 and 3). The outputs include generated and delivered electricity, recovered secondary materials and sequestrated carbon.

Compensatory system for the substitution of primary materials and energy [derived from Abu Qdais et al. (2019)]
The analysis of MSW composition is not regularly done in Russia, and only a limited number of studies on this subject are published. Since waste composition is the basis for the determination of direct GHG emissions from waste management activities, accurate data is desirable. The Russian Federation is a huge country with both densely populated urban areas and sparsely populated rural areas. Due to the different settlement structures, the waste compositions also differ a lot. It is not expedient to assume an average composition for the entire country. Therefore, hereinafter three clusters had been considered to define waste compositions. The first cluster includes Moscow and the Republic of Tatarstan, since in these regions, a larger amount of mixed MSW is/will be incinerated in the nearest future. The second cluster includes the cities with the population of more than 0.5 million people, and the third cluster includes the settlements with the population of less than 0.5 million people. The waste compositions for these three clusters given in Table 2 are weighted averages of the results of a number of experimental studies of waste composition which were found in sources of the literature published after 2010 and further analyzed. Weighted average here means that the respective data on waste composition that was found for a city or region was included in the weighted average with the proportion that the amount of MSW generated in the city or region takes up as part of the total mass of MSW generated in the respective cluster.
To determine the avoidance of GHG emissions in the downstream processes by means of energy and material substitution as well as carbon sequestration, a compensatory system must be used. In Fig. 3, the compensatory system for the substitution of energy and primary materials is shown.
Emission factors
Waste incineration
It is necessary to know the emission factors when calculating GHG emissions from thermal treatment of waste, and also when compiling national emissions inventories (Larsen and Astrup 2011). Information on GHG emission factors of various solid waste treatment technologies for each country is of great importance for the assessment of GHGs emitted as a result of adopting a certain technology. However, such factors are not available for the Russian Federation, which implies using the data available in the literature for the countries with the conditions similar to the Russian ones, examining local circumstances of solid waste management system (Friedrich and Trois 2013; Larsen and Astrup 2011; Noya et al. 2018).
There are different factors affecting GHG emission levels from waste incineration. One of the most important factors in determining CO2 emissions is the amount of fossil carbon in the waste stream meant for incineration. Non-CO2 emissions are more dependent on the incineration technology and conditions, and for modern waste incinerators, the amounts of non-CO2 emissions are negligible (Johnke 2001; Sabin Guendehou et al. 2006).
The amount of fossil carbon was calculated based on waste composition, carbon content and share of fossil carbon given in Table 2; the resulting fossil carbon content in wet waste was 0.117 kg C/kg. For the indirectly avoided GHG emissions, the recovery of electricity with a net efficiency of 24% for all the scenarios and for the Scenario 3 also from metals contained in the incinerator slag to substitute primary metals was considered. The recovery of heat in form of process steam or district heat was not considered in the scenarios (Dashieva 2017). Further parameters for the calculation of GHG emissions from waste incineration are given in Table 3.
Landfill
For the calculation of the impact of the methane released from landfills to climate change over a 100 years’ time horizon, the first-order decay kinetics model was used. Almost 80% of the Russian MSW landfills occupy an area larger than 10 ha (Volynkina and Zaytseva 2010). Here, it is assumed that all the MSW is highly compacted and disposed of in deep landfills under anaerobic conditions without the recovery of landfill gas (Govor 2017). Since no landfill gas is recovered, in Scenario 1, only the sequestrated non-biodegradable biogenic carbon in the landfill results in avoided GHG emissions. There is an intention in Russia to introduce the collection of landfill gas as the primary measure to reduce GHG emissions from the waste management sector (Government of the Russian Federation 2018; Ministry of Natural Resources and Ecology of the Russian Federation 2013) within the next years. In the literature, methane recovery rates between 9% (Scharff et al. 2003) and 90% (Spokas et al. 2006) are reported. For example, most US landfills are well-controlled and managed; in particular, in California, gas collection efficiencies are as high as 82.5% (Kong et al. 2012). Based on these values, for both Scenario 2 and Scenario 3, landfill gas recovery is introduced with a recovery rate of 60%. Under these two scenarios, in addition to carbon sequestration, the recovered landfill gas is used to produce electricity, which results in avoided indirect GHG emissions. Other parameters used for the calculation are mainly taken from the latest Russian National Inventory Report where IPCC default parameters were used (Pipatti et al. 2006; Russian Federation 2019). The parameters used for the calculation of GHG emissions from landfills for all the three scenarios are shown in Table 4.
Material recovery
In all the scenarios, some part of mixed MSW is treated in eco-techno parks, where valuable secondary raw materials like metals, paper, glass and plastics are recovered, and the sorting residues are forwarded to landfills. In addition, separate collection of some amounts of paper, glass, and plastics in the Scenario 3 is presumed. The corresponding recovery rates are already given in Table 1. Each recovered secondary material substitutes a certain amount of primary material. Since the production of primary materials is usually connected with higher energy and raw material consumption than that of the secondary materials, more GHGs are released during the production of the former ones. Therefore, every unit of recovered secondary material obtained leads to a reduction in released GHGs.
GHG emission or substitution factors are developed for specific geographical areas and technologies, and their appropriateness to other circumstances may be questionable (Turner et al. 2015). The application of one specific emission factor for a recovered material in the whole Russian Federation would already be debatable due to the size of the country. Perhaps that is why emission factors for Russia cannot be found in the literature. For this study, the average values of GHG emission/substitution factors determined for other industrial countries from the study of (Turner et al. 2015) were used. The amounts of avoided GHG, i.e., the values of the emission factors in CO2 equivalents for the recovered valuable waste fractions, including steel, aluminum, paper/cardboard, glass and plastic, are given in Table 5.
In Table 5, the used equivalent factor (Global Warming Potential over a time horizon of 100 years) of released methane versus carbon dioxide, the emission factor of the use of fuel oil in the waste incineration process and the substitution factor of delivered electrical power are shown. The emission factor of the generated electricity in the Russian Federation is relatively low, since approx. half (52%) of the electricity is produced by natural gas and approx. 13% by hydro- and nuclear power, while only 13% is produced by coal (British Petrolium 2019; U.S. Energy Information Administration 2017). The electricity mix factor is therefore only 0.358 Mg CO2-eq./MWh generated electricity (Gimadi et al. 2019).
Results and discussion
The population of the Russian Federation is expected to decrease in the next decades (United Nations 2019), but due to the economic growth, the amount of waste generated per capita is expected to increase in the same ratio; that is why the calculation of the GHG emissions for all the three scenarios was based on an assumed fixed annually amount of 58.4 Mt of MSW. Average waste compositions were calculated for this study on the basis of eleven waste analyses conducted in different Russian cities between 2010 and 2017 and grouped into three clusters (Moscow and Tatarstan, cities with more than 0.5 million inhabitants and cities/settlements with less than 0.5 million inhabitants). From the available literature data for the countries with conditions similar to Russian ones, emission factors were adopted to be further used in calculations of GHG emissions from waste disposal on managed and sanitary landfills, waste incineration and waste recycling with the recovery of secondary raw materials.
In Fig. 4, the amounts of CO2-equivalent emissions per year that contribute to global warming for each of the three scenarios considered in the study are shown. Since the emissions related to the collection and transportation of waste, as well as energy consumption in the upstream side, are almost similar for all the treatment processes (Komakech et al. 2015), and as they are relatively small compared to the operational and downstream emissions (Boldrin et al. 2009; Friedrich and Trois 2011), they were not considered in the model. Avoided and sequestrated emissions were subtracted from the direct emissions to calculate GHG net emission values.

Global warming contribution of the three considered scenarios
The basic scenario (mostly managed landfilling without landfill gas recovery) gives the highest GHG net emissions among all the analyzed scenarios of approx. 64 Mt CO2-eq./a, followed by the reactive scenario (mostly sanitary landfilling with landfill gas recovery) with approx. 12.8 Mt CO2-eq./a of GHG net emissions. The innovative scenario (sanitary landfilling with landfill gas recovery and increased shares of MSW incineration, separate collection and material recovery) had shown an almost neutral GHG balance with approx. 3.7 Mt CO2-eq./a of GHG net emissions.
To assess the impact of the introduction of various waste treatment methods on the amount of GHG emissions from the waste management sector, the specific GHG emissions for each scenario as a whole was calculated, as well as “within” scenarios for each considered waste management process/method (Table 6).
The amount of specific total GHG emissions under Scenario 2 is five times less than under Scenario 1. Such a large difference is due to the modernization of existing managed dumpsites (Scenario 1), instead of which MSW is disposed of at sanitary landfills equipped with landfill gas and leachate collection systems, with intermediate insulating layers and top capping (Scenario 2). Such a transition from managed dumpsites to sanitary landfills leads not only to a decrease in the amount of specific released GHG emissions by approx. 1 Mg CO2-eq./Mg MSW, but also to a decrease in total emissions due to avoided emissions in the amount of 0.053 Mg CO2-eq./Mg MSW generated by energy recovery.
The amount of specific total GHG emissions under Scenario 3 is 3.4 times less than under Scenario 2. This reduction is mainly due to an almost twofold increase in the volume of waste incinerated, along with the introduction of a separate waste collection system (Scenario 3). At the same time, in Scenario 3, the share of plastic in the mixed waste stream sent to incineration is less than in Scenarios 1 and 2 (see Fig. 1). Climate-related GHG from waste incineration are generated mainly due to the plastic contained in the waste. Therefore, in Scenario 3, less GHG emissions are released during waste incineration. Reduction in GHG emissions from waste incineration is also facilitated by the recovery of metals from the bottom ash, which occurs only in Scenario 3.
In Scenario 3, the total amount of recycled material is larger than in Scenario 2, since not only part of the mixed waste is recycled, but also separately collected. According to the Scenario 3, metals are not included in the waste fractions collected separately. Metals have a comparably high GHG substitution factor (see Table 5); this explains the slight decrease in avoided GHG emissions due to material recovery in Scenario 3 compared to Scenario 2 because of a decreased share of metals in the total waste stream sent for recycling.
Many studies confirm GHG emissions reduction by the application of these waste treatment concepts. It is shown that the recovery of landfill gas from managed landfills has a high potential to reduce GHG emissions from landfills (EI-Fadel and Sbayti 2000; Friedrich and Trois 2016; Lee et al. 2017; Starostina et al. 2014). The transfer from the disposal of mixed MSW on landfills to the incineration on waste incineration or waste-to-energy plants leads to further reduction in GHG emissions (Bilitewski and Wuensch 2012; Chen 2018; Voigt et al. 2015). The recovery of secondary materials from MSW allows avoiding additional amounts of GHG emissions (Björklund and Finnveden 2005; Franchetti and Kilaru 2012; Turner et al. 2015; Wuensch and Simon 2017).
It should be noted that the calculated results of the direct GHG emissions from landfilling and waste incineration are subject to uncertainties. Waste composition (Table 2) and the parameters set/assumed for the landfills (Table 4) and waste incineration (Table 3) affect the level of the results. Indirect downstream emissions from recovered secondary materials and substituted energy cannot be provided with accuracy, as indicated by missing data for the substitution factors of recovered secondary materials in Russia and the variability of the scenarios for substituted electricity. To get an impression about the possible fluctuation range of the determined results, a sensitivity analysis was carried out. Therefore, all values shown in Tables 1, 3, 4 and 5 were ones decreased by 10% and once increased by 10%. The impact of the sensitivity analysis on the GHG net emissions is shown as error bars in Fig. 4. The results of the sensitivity analysis show a range for the GHG net emissions of the basic scenario between 35.129 and 91.446 Mt CO2-eq./a, for the reactive scenario between 5.133 and 16.324 Mt CO2-eq./a and for the innovative scenario from − 1.516 to 4.871 Mt CO2-eq./a.
All the exact values of the final results shown in Fig. 4 as well as the graphical representation of the results of the sensitivity analysis can be checked in the provided supplementary materials.
Conclusion
The most recent data about global GHG emissions from solid waste disposal shows that direct emissions contribute with 0.67 Gt CO2-eq./a (Fischedick et al. 2014) to about 1.4% of the total anthropogenic GHG emissions of 49 Gt CO2-eq./a (Edenhofer et al. 2015). For the Russian Federation, the contribution of the direct emissions from the MSW management accounts for approx. 3.7% of the total GHG emissions of the country of around 2.2 Gt CO2-eq./a (Russian Federation 2019). In this study, the potential of different waste management methods in relation to climate change impact was assessed using the example of the Russian waste management industry. For this purpose, three scenarios had been developed and analyzed:
-
1.
Basic scenario (business as usual), based on the existing waste management practices. The scenario implies that 90% of the generated mixed MSW is disposed of on managed dumpsites, 7% is undergone material recovery and 3% incinerated. All the unorganized dumpsites are closed; on managed dumpsites, there is no landfill gas recovery.
-
2.
Reactive scenario (moderate development). This scenario implies construction of a number of large waste incineration plants and an increase in the share of waste to be recycled so that 84.3% of generated MSW is disposed of in sanitary landfills, 10% is sent to recycling plants for material recovery, and 5.7% is incinerated.
-
3.
Innovative scenario (active development). This scenario assumes partial implementation of a separate waste collection system and broader introduction of waste processing technologies. As a result, 20% of the total generated MSW is collected separately and then recycled, 14.3% undergoes material recovery, 55.2% is disposed of in sanitary landfills, and 10.5% is incinerated.
For determining weighed average morphological composition of MSW, three clusters of human settlements had been considered, and the respective data on waste compositions had been analyzed. The first cluster includes Moscow and the Republic of Tatarstan, the second cluster includes the major cities (those with the population of more than 0.5 million people), and the third cluster includes the minor cities and rural areas.
For determining emission factors, both own calculation results and reference data from the National Inventory Report and other sources were used. Thus, the amount of fossil carbon, being one of the most important factors determining CO2 emissions from waste incineration, was calculated based on the waste composition, carbon content and the share of fossil carbon in the waste. For the calculation of the amount of CH4 released from MSW landfills, the first-order decay kinetics model was used. Avoided GHG emissions are the result of sequestrated non-biodegradable biogenic carbon in landfills (all the scenarios) and recovered landfill gas used to produce electricity (Scenarios 2 and 3). With the use of emission factors for material recovery included those for the recovered valuable waste fractions steel, aluminum, paper and cardboard, glass and plastic, GHG emissions were calculated under each scenario. As it was expected, the basic scenario gives the highest amount of total GHG net emissions of approx. 64 Mt CO2-eq./a (1.096 Mg CO2-eq./Mg MSW). Under the reactive scenario, the amount of total GHG net emissions is approx. 12.8 Mt CO2-eq./a (0.219 Mg CO2-eq./Mg MSW), and under the innovative scenario, it is about 3.7 Mt CO2-eq./a (0.064 Mg CO2-eq./Mg MSW).
The calculation of specific GHG emissions made it possible to assess the extent to which the introduction of various waste treatment methods makes it possible to reduce GHG emissions resulting from the respective waste treatment processes. Analysis of the results of these calculations showed that the transition from managed dumpsites to sanitary landfills can reduce total GHG emissions from the Russian waste management sector by up to 5 times. The introduction of a separate collection system (in which 20% of waste is collected separately) with a simultaneous twofold increase in the share of waste incinerated has led to a more than threefold reduction in total GHG emissions from the sector of Russian waste management. Another factor influencing the reduction in GHG emissions from waste incineration is the recovery of metals from the bottom ash.
Direct GHG emissions can be further reduced with a shift from landfilling to treatment of mixed MSW in material recovery facilities and waste incinerators or even to separate collection and treatment of MSW. In addition, indirect downstream emissions can be avoided by a significant amount via energy and material recovery. With a separate collection and treatment of biowaste and the recovery of district heat from waste incineration process, further GHG mitigation can be obtained. With these additional measures, the MSW industry of the Russian Federation could become a net avoider from a net emitter.
For this study, a number of parameters and emission factors from the literature where used, which does not precisely reflect the situation in Russia. Conducting further research for determining country specific, for a huge country like Russia, possibly even region-specific data and emission factors resulting in the development of a corresponding database would be useful to minimize these uncertainties.
Data availability
Not applicable.
Code availability
Not applicable.
Notes
Hereinafter, managed landfills are understood as engineering infrastructure facilities intended for the disposal of MSW, not equipped with systems for collection and utilization of landfill gas, collection, removal and treatment of leachate.
Hereinafter, sanitary landfills are understood engineering infrastructure facilities intended for the disposal of MSW, equipped with systems for collection and utilization of landfill gas, collection, removal and treatment of leachate, with intermediate insulating layers and top capping.
References
(2008) Directive 2008/98/EC of the European Parliament of the Council: Waste Framework Directive
Abu Qdais H, Wuensch C, Dornack C, Nassour A (2019) The role of solid waste composting in mitigating climate change in Jordan. Waste Manag Res 37:833–842. https://doi.org/10.1177/0734242X19855424
Abu Qdais HA (2007) Techno-economic assessment of municipal solid waste management in Jordan. Waste Manag 27:1666–1672. https://doi.org/10.1016/j.wasman.2006.08.004
Arkharov IA, Simakova EN, Navasardyan ES (2016) Landfill gas as feedstock for energy and industrial processes. J Chem Pet Eng 52:547–551. https://doi.org/10.1007/s10556-016-0229-y
Bilitewski B, Wuensch C (2012) Greenhouse gas emission reduction by waste-to-energy. In: Meyers RA (ed) Encyclopedia of sustainability science and technology. Springer, New York, pp 4754–4774
Bilitewski B, Wuensch C, Jager J, Hoffmann M (2010) Energieeffizienzsteigerung und CO2-Vermeidungspotenziale bei der Müllverbrennung – technische und wirtschaftliche Bewertung. EdDE-Dokumentation
Bioenergy International (2019) Consortium to construct four waste-to-energy plants in Moscow region. https://bioenergyinternational.com/heat-power/consortium-to-build-four-waste-to-energy-plants-in-moscow
Björklund A, Finnveden G (2005) Recycling revisited—life cycle comparisons of global warming impact and total energy use of waste management strategies. Resour Conserv Recycl 44:309–317. https://doi.org/10.1016/j.resconrec.2004.12.002
Boldrin A, Andersen JK, Møller J, Christensen TH, Favoino E (2009) Composting and compost utilization: accounting of greenhouse gases and global warming contributions. Waste Manag Res 27:800–812. https://doi.org/10.1177/0734242X09345275
British Petrolium (2019) Energy Outlook 2019: insights from the evolving transition scenario—Russia. https://www.bp.com/content/dam/bp/business-sites/en/global/corporate/pdfs/energy-economics/energy-outlook/bp-energy-outlook-2019-country-insight-russia.pdf
Cabinet of Ministers of the Republic of Tatarstan (2018) Territorial scheme of waste management in the Republic of Tatarstan, 2018 (Teppитopиaльнaя cxeмa в oблacти oбpaщeния c oтxoдaми, в тoм чиcлe c твёpдыми кoммyнaльными oтxoдaми, Pecпyблики Taтapcтaн, yтв. пocтaнoвлeниeм Кaбинeтa миниcтpoв Pecпyблики Taтapcтaн oт 13.03.2018 г. №149). http://docs.cntd.ru/document/543574946
CalRecovery, Inc, PEER Consultants (1993) Material recovery facility design manual. C.K. Smoley
Chen Y-C (2018) Evaluating greenhouse gas emissions and energy recovery from municipal and industrial solid waste using waste-to-energy technology. J Clean Prod 192:262–269. https://doi.org/10.1016/j.jclepro.2018.04.260
Chung Y, Paik C, Kim YJ (2018) Assessment of mitigation pathways of GHG emissions from the Korean waste sector through 2050. Sustain Environ Res 28:135–141. https://doi.org/10.1016/j.serj.2017.12.003
Cimpan C, Maul A, Jansen M, Pretz T, Wenzel H (2015) Central sorting and recovery of MSW recyclable materials: a review of technological state-of-the-art, cases, practice and implications for materials recycling. J Environ Manag 156:181–199. https://doi.org/10.1016/j.jenvman.2015.03.025
Council for Strategic Development and National Projects (2018) Passport of the national project “Ecology” (Пacпopт нaциoнaльнoгo пpoeктa “Экoлoгия”). http://www.consultant.ru/cons/cgi/online.cgi?req=doc&base=LAW&n=316096&fld=134&dst=1000000001,0&rnd=0.13275815057092122#021390357710118524
Crawford G, Fischer C, Hansen JA, Mavropoulos A (2009) Waste and Climate Change. ISWA white paper. https://www.iswa.org/fileadmin/user_upload/_temp_/Small_GHG_white_paper_01.pdf
Dashieva B (2017) Business Model of Russian and Swedish Waste-to-Energy Firms. Master Thesis, Jönköpping University
Decree of the President of the Russian Federation (2021) On measures to implement state scientific and technical policy in the field of environmental development of the Russian Federation and climate change. http://static.kremlin.ru/media/events/files/ru/AKh2dmiiH3CN8MniSrmxkZAWsi9O8wzj.pdf
Dedinec A, Markovska N, Ristovski I, Velevski G, Gjorgjievska VT, Grncarovska TO, Zdraveva P (2015) Economic and environmental evaluation of climate change mitigation measures in the waste sector of developing countries. J Clean Prod 88:234–241. https://doi.org/10.1016/j.jclepro.2014.05.048
Department of Housing and Communal Services of the city of Moscow (2019) Territorial scheme of waste management in Moscow (Teppитopиaльнaя cxeмa oбpaщeния c oтxoдaми гopoдa Mocквы, yтв. pacпopяжeниeм Дeпapтaмeнтa жилищнo-кoммyнaльнoгo xoзяйcтвa гopoдa Mocквы oт 26.12.2019 №01-01-14-590/19). https://www.mos.ru/dgkh/documents/view/232950220/
Di Maria F, Sisani F (2018) Effectiveness of municipal solid waste incinerators in replacing other fuels. A primary energy balance approach for the EU28. Waste Manag Res 36:942–951. https://doi.org/10.1177/0734242X18785737
Edenhofer O, Pichs-Madruga R, Sokona Y, Minx JC, Farahani E, Kadner S, Seyboth K, Adler A, Baum I, Brunner S, Eickmeier P, Kriemann B, Savolainen J, Schlomer S, Stechow C von, Zwickel T (eds) (2015) Climate change 2014: mitigation of climate change; summary for policymakers technical summary; part of the Working Group III Contribution to the fifth assessment report of the Intergovernmental Panel on Climate Change. Intergovernmental Panel on Climate Change, Geneva, Switzerland
EI-Fadel M, Sbayti H (2000) Economics of mitigating greenhouse gas emissions from solid waste in Lebanon. Waste Manag Res 18:329–340. https://doi.org/10.1177/0734242X0001800405
Fedotkina O, Gorbashko E, Vatolkina N (2019) Circular economy in Russia: drivers and barriers for waste management development. Sustainability 11:5837. https://doi.org/10.3390/su11205837
Fischedick M, Roy J, Abdel-Aziz A, Acquaye A, Allwood J, Ceron J-P, Geng Y, Kheshgi H, Lanza A, Perczyk D, Price L, Santalla E, Sheinbaum C, Tanaka K (2014) Industry. Climate change 2014: Mitigation of climate change. contribution of working group III to the fifth assessment report of the Intergovernmental Panel on Climate Change
Franchetti M, Kilaru P (2012) Modeling the impact of municipal solid waste recycling on greenhouse gas emissions in Ohio, USA. Resour Conserv Recycl 58:107–113. https://doi.org/10.1016/j.resconrec.2011.11.004
Friedrich E, Trois C (2011) Quantification of greenhouse gas emissions from waste management processes for municipalities—a comparative review focusing on Africa. Waste Manag 31:1585–1596. https://doi.org/10.1016/j.wasman.2011.02.028
Friedrich E, Trois C (2013) GHG emission factors developed for the recycling and composting of municipal waste in South African municipalities. Waste Manag 33:2520–2531. https://doi.org/10.1016/j.wasman.2013.05.010
Friedrich E, Trois C (2016) Current and future greenhouse gas (GHG) emissions from the management of municipal solid waste in the eThekwini Municipality—South Africa. J Clean Prod 112:4071–4083. https://doi.org/10.1016/j.jclepro.2015.05.118
Gentil E, Christensen TH, Aoustin E (2009) Greenhouse gas accounting and waste management. Waste Manag Res 27:696–706. https://doi.org/10.1177/0734242X09346702
Gimadi V, Amiragyan A, Pominova I, Kurdin A, Kolobov O, Martynyuk A, Kutuzova A, Kolobanov S, Podlesnaya A, Zvyagintseva A (2019) Energetic Newsletter—Carbon intensity of electricity in the world and Russia. https://ac.gov.ru/archive/files/publication/a/22245.pdf
Gómez DR, Watterson JD, Americano BB, Ha C, Marland G, Matsika E, Namayanga LN, Osman-Elasha B, Saka Kalenga JD, Treanton K (2006) Stationary combustion: in 2006 IPCC Guidelines for National Greenhouse Gas Inventories. https://www.ipcc-nggip.iges.or.jp/public/2006gl/pdf/2_Volume2/V2_2_Ch2_Stationary_Combustion.pdf
Government of Nizhny Novgorod Region (2019) Territorial Scheme of Waste Management in Nizhny Novgorod Region (Teppитopиaльнaя cxeмa в oблacти oбpaщeния c oтxoдaми, в тoм чиcлe c TКO, нa тeppитopии Hижeгopoдcкoй oблacти, yтв. пocтaнoвлeниeм Пpaвитeльcтвa Hижeгopoдcкoй oблacти oт 18.11.2019 г. №843). http://docs.cntd.ru/document/465594327
Government of Orenburg Region (2018) Territorial scheme of waste management in Orenburg Region Teppитopиaльнaя cxeмa oбpaщeния c oтxoдaми, в тoм чиcлe c TКO, Opeнбypгcкoй oблacти, yтв. пocтaнoвлeниeм Пpaвитeльcтвa Opeнбypгcкoй oблacти oт 07.03.2018 г. №123-п. http://docs.cntd.ru/document/550112447
Government of Saint-Petersburg (2016) Saint-Petersburg territorial scheme of waste management in Saint-Petersburg (Teppитopиaльнaя cxeмa oбpaщeния c oтxoдaми, в тoм чиcлe c TКO, г. Caнкт-Пeтepбypгa, yтв. пocтaнoвлeниeм Пpaвитeльcтвa Caнкт-Пeтepбypгa oт 16.12.2016 г. №1147). http://docs.cntd.ru/document/441807919
Government of Sakhalin Region Territorial scheme of waste management in Sakhalin Region (Teppитopиaльнaя cxeмa oбpaщeния c oтxoдaми, в тoм чиcлe c TКO, в Caxaлинcкoй oблacти, yтв. pacпopяжeниeм Пpaвитeльcтвa Caxaлинcкoй oблacти oт 23.09.2016 г. №486-p (c измeнeниями нa 10.08.2018)). http://docs.cntd.ru/document/446266452
Government of the Russian Federation (2014) State program “Energy Efficiency and Energy Development” Decree of the Government of the Russian Federation (Гocyдapcтвeннaя пpoгpaммa «Энepгoэффeктивнocть и paзвитиe энepгeтики», yтв. пocтaнoвлeниeм Пpaвитeльcтвa PФ). http://www.consultant.ru/cons/cgi/online.cgi?req=doc&base=LAW&n=347270&fld=134&dst=1000000001,0&rnd=0.2794574380709265#04162759434383497
Government of the Russian Federation (2018) Industry development strategy for the processing, utilization and neutralization of industrial and municipal solid waste for the period up to 2030 (Cтpaтeгия paзвития пpoмышлeннocти пo oбpaбoткe, yтилизaции и oбeзвpeживaнию oтxoдoв пpoизвoдcтвa и пoтpeблeния нa пepиoд дo 2030 гoдa). http://www.consultant.ru/document/cons_doc_LAW_289114/549eef11ae953dc6e4261b88ed6d14f776df3203/
Govor IL (2017) Monitoring of greenhouse gas emissions from waste and waste water management in the Russian Federation. Probl. Ecol. Monit. Ecosyst. Model. 28:18–40. https://doi.org/10.21513/0207-2564-2017-1-18-40
Hoornweg D, Bhada-Tata P (2012) What a waste: a global review of solid waste management. Urban development series, vol 15. The World Bank
Hryb W (2015) Sorting tests of unsorted municipal solid waste from germany for a selected opto-pneumatic sorting machine. Pol J Environ Stud 24:99–105. https://doi.org/10.15244/pjoes/26387
Ilinykh G, Sliusar N, Zavizion J, Korotaev V (2013) Trends and patterns of changes in the norms of accumulation, composition and properties of MSW (Teндeнции и зaкoнoмepнocти измeнeния нopм нaкoплeния, cocтaвa и cвoйcтв TБO). Ecol Ind Rus 10:22–25
Johnke B (2001) Emissions from waste incineration: good practice guidance and uncertainty management in National Greenhouse Gas Inventories
Kaza S, Yao L, Bhada-Tata P, van Woerden F (2018) What a waste 20: a global snapshot of solid waste management to 2050. The World Bank
Komakech AJ, Sundberg C, Jönsson H, Vinnerås B (2015) Life cycle assessment of biodegradable waste treatment systems for sub-Saharan African cities. Resour Conserv Recycl 99:100–110. https://doi.org/10.1016/j.resconrec.2015.03.006
Kong D, Shan J, Iacobini M, Maguin SR (2012) Evaluating greenhouse gas impacts of organic waste management options using life cycle assessment. Waste Manag Res 30:800–812
Korobova N, Larionov A, Michelsen J, Pulyayev M, Ivanovskyy S, Turilova K, Kuznetsova M (2014) Waste in Russia: gabrage or valuable resource: scenarios for developing the municipal solid waste sector. The World Bank
Kost T (2001) Brennstofftechnische Charakterisierung von Haushaltsabfällen. Zugl.: Dresden, Techn. Univ., Diss., 2001, 1st edn. Beiträge zu Abfallwirtschaft, Altlasten, vol 16. Forum für Abfallwirtschaft und Altlasten e.V, Pirna
Larsen AW, Astrup T (2011) CO2 emission factors for waste incineration: influence from source separation of recyclable materials. Waste Manag 31:1597–1605. https://doi.org/10.1016/j.wasman.2011.03.001
Lee U, Han J, Wang M (2017) Evaluation of landfill gas emissions from municipal solid waste landfills for the life-cycle analysis of waste-to-energy pathways. J Clean Prod 166:335–342. https://doi.org/10.1016/j.jclepro.2017.08.016
Manokhin VY, Manokhin MV (2014) Norms of MSW accumulation, their composition and characteristics (Hopмы нaкoплeния TБO, иx cocтaв и cвoйcтвa). Bulletin of VSTU: “Materials Science” (Becтник BГTУ: «Maтepиaлoвeдeниe»)
Metz B, Davidson O, Swart R, Pan J (2001) Mitigation: Contribution of Working Group III to the third assessment report of the Intergovernmental Panel on Climate Change (IPCC). Climate change 2001. Cambridge University Press, Cambridge
Ministry of Energy, Housing and Communal Services of Samara Region (2018) Territorial Scheme of Waste Management in Samara Region (Teppитopиaльнaя cxeмa oбpaщeния c oтxoдaми, в тoм чиcлe c TКO, Caмapcкoй oблacти, yтв. пpикaзoм Mиниcтepcтвa энepгeтики и жилищнo-кoммyнaльнoгo xoзяйcтвa Caмapcкoй oблacти oт 23.09.2016 г. №228 (c измeнeниями нa 02.07.2018)). http://docs.cntd.ru/document/434606836
Ministry of Energy, Housing and Communal Services of Sverdlovsk Region (2020) Territorial Scheme of Waste Management in Sverdlovsk Region (Teppитopиaльнaя cxeмa oбpaщeния c oтxoдaми пpoизвoдcтвa и пoтpeблeния нa тeppитopии Cвepдлoвcкoй oблacти, yтв. пpикaзoм Mиниcтepcтвa энepгeтики и ЖКX Cвepдлoвcкoй oблacти oт 31.03.2020 г. №185). http://docs.cntd.ru/document/570723101
Ministry of Natural Resources and Ecology of Irkutsk Region (2017) Territorial Scheme of Waste Management in Irkutsk Region (Teppитopиaльнaя cxeмa oбpaщeния c oтxoдaми, в тoм чиcлe c TКO, Иpкyтcкoй oблacти, yтв. пpикaзoм Mиниcтepcтвa пpиpoдныx pecypcoв и экoлoгии Иpкyтcкoй oблacти oт 29.12.2017 г. №43-мпp). http://docs.cntd.ru/document/550117931
Ministry of Natural Resources and Ecology of Omsk Region (2016) Territorial Scheme of Waste Management in Omsk Region (Teppитopиaльнaя cxeмa oбpaщeния c oтxoдaми, в тoм чиcлe c TКO, Oмcкoй oблacти, yтв. пpикaзoм Mиниcтepcтвa пpиpoдныx pecypcoв и экoлoгии Oмcкoй oблacти oт 23.09.2016 г. №74). http://docs.cntd.ru/document/444713494
Ministry of Natural Resources and Ecology of the Russian Federation (2013) Integrated solid municipal (household) waste management strategy in the Russian Federation (Кoмплeкcнaя cтpaтeгия oбpaщeния c твepдыми кoммyнaльными (бытoвыми) oтxoдaми в Poccийcкoй Фeдepaции)
Ministry of Natural Resources and Ecology of the Russian Federation (2019) About the status and the protection of the environment in the Russian Federation in 2017 ([Гocyдapcтвeнный дoклaд «O cocтoянии и oб oxpaнe oкpyжaющeй cpeды Poccийcкoй Фeдepaции в 2017 гoдy)
Mohareb EA, MacLean HL, Kennedy CA (2011) Greenhouse gas emissions from waste management—assessment of quantification methods. J Air Waste Manag Assoc 61:480–493. https://doi.org/10.3155/1047-3289.61.5.480
Myhre G, Shindell D, Bréon F-M, Collins W, Fuglestvedt J, Huang J, Koch D, Lamarque J-F, Lee D, Mendoza B, Nakajima T, Robock A, Stephens G, Takemura T, Zhang H (eds) (2014) Anthropogenic and natural radiative forcing. Cambridge University Press
Nowak W, Arthkamp J (2015) BHKW-Fibel: Wissen in kompakter Form. https://asue.de/sites/default/files/asue/themen/blockheizkraftwerke/2015/broschueren/asue_050315_bhkw_fibel.pdf
Noya I, Inglezakis V, González-García S, Katsou E, Feijoo G, Moreira MT (2018) Comparative environmental assessment of alternative waste management strategies in developing regions: a case study in Kazakhstan. Waste Manag Res 36:689–697. https://doi.org/10.1177/0734242X18786388
Papageorgiou A, Barton JR, Karagiannidis A (2009) Assessment of the greenhouse effect impact of technologies used for energy recovery from municipal waste: a case for England. J Environ Manag 90:2999–3012. https://doi.org/10.1016/j.jenvman.2009.04.012
Pipatti R, Svardal P, Alves JWS, Gao Q, López CC, Mareckova K, Oonk H, Scheehle E, Sharma C, Smith A, Yamada M (eds) (2006) Solid waste disposal. In: 2006 IPCC Guidelines for National Greenhouse Gas Inventories
Plastinina I, Teslyuk L, Dukmasova N, Pikalova E (2019) Implementation of circular economy principles in regional solid municipal waste management: the case of Sverdlovskaya Oblast (Russian Federation). Resources 8:90. https://doi.org/10.3390/resources8020090
Privalenko VV (2001) Current status of landfills in Rostov-on-Don and surrounding areas: half year report for INCO Copernicus grant ICA2-CT-2001-10001
Regnum (2017) Prohibit the construction of incinerators: Kazan - Putin.: Kasan - Putin (Зaпpeтитe cтpoитeльcтвo мycopocжигaтeльныx зaвoдoв: Кaзaнь – Пyтинy). Regnum
Rosprirodnadzor (2019) Data on the activities in the area of waste treatment (Дoклaд Фeдepaльнoй cлyжбы пo нaдзopy в cфepe пpиpoдoпoльзoвaния “Cвeдeния o дeятeльнocти в oблacти oбpaщeния c oтxoдaми”)
Russian Federation (2019) 2019 National Inventory Report (NIR). https://unfccc.int/documents/194838
Sabin Guendehou GH, Koch M, Hockstad L, Pipatti R, Yamada M (eds) (2006) Incineration and open burning of waste. In: 2006 IPCC guidelines for National Greenhouse Gas Inventories
Scharff H, Martha A, van Rijn DMM, Hensen A, v.d. Bulk WCM, Flechard C, Oonk H, Vroon R, Visscher A de, Boeckx P (2003) A comparison of measurement methods to determine landfill methane emissions. https://www.afvalzorg.nl/content/uploads/2018/03/A-comparison-of-measurement-methods.pdf
Schwetje A, Kaazke J (2012) A sustainable waste management concept for Khanty-Mansiysk municipality, Russia. https://www.umweltbundesamt.de/sites/default/files/medien/beratungshilfe/long/35-53-B-EN.pdf
Sliusar N, Armisheva G.T. (2013) Energy resources recovery on municipal solid waste disposal. Sinks a Vital Element of Modern Waste Management, Espoo, Finland
Sotnezov A, Saytsev V, Tarasova N (2015) Morphological composition of solid municipal waste. Saf Technosphere 4:10–15
Spokas K, Bogner J, Chanton JP, Morcet M, Aran C, Graff C, Golvan YM-L, Hebe I (2006) Methane mass balance at three landfill sites: what is the efficiency of capture by gas collection systems? Waste Manag 26:516–525. https://doi.org/10.1016/j.wasman.2005.07.021
Starostina V, Damgaard A, Rechenberger H, Christensen TH (2014) Waste management in the Irkutsk Region, Siberia, Russia: Environmental assessment of current practice focusing on landfilling. Waste Manag Res 32:389–396
Starostina V, Damgaard A, Eriksen MK, Christensen TH (2018) Waste management in the Irkutsk region, Siberia, Russia: an environmental assessment of alternative development scenarios. Waste Manag Res 36:373–385. https://doi.org/10.1177/0734242X18757627
Treshnikov SE, Gomonitskaya AO (2014) Monitoring of qualitative composition of municipal solid waste by the example of a waste processing plant of the city of Togliatti (Moнитopинг кaчecтвeннoгo cocтaвa TБO нa пpимepe мycopoпepepaбaтывaющeгo пpeдпpиятия г.o. Toльятти). https://cyberleninka.ru/article/n/monitoring-kachestvennogo-sostava-tbo-na-primere-musoropererabatyvayuschego-predpriyatiya-g-o-tolyatti/viewer
Tugov AN (2013) Prospects for the use of municipal solid wastes as secondary energy resources in Russia. Therm Eng 60:663–668. https://doi.org/10.1134/S0040601513090139
Tulokhonova A, Ulanova O (2013) Assessment of municipal solid waste management scenarios in Irkutsk (Russia) using a life cycle assessment-integrated waste management model. Waste Manag Res 31:475–484. https://doi.org/10.1177/0734242X13476745
Turner DA, Williams ID, Kemp S (2015) Greenhouse gas emission factors for recycling of source-segregated waste materials. Resour Conserv Recycl 105:186–197. https://doi.org/10.1016/j.resconrec.2015.10.026
U.S. Energy Information Administration (2017) Country analysis brief: Russia. https://www.eia.gov/international/content/analysis/countries_long/Russia/russia.pdf
UNFCCC (2006) United Nations framework convention on climate change: handbook. United Nations Framework Convention on Climate Change (UNFCCC)
United Nations (2019) World population prospects 2019: volume II: demographic profiles. United Nations
Vakhitov YF, Shamsutdinova LR, Zvereva TI, Akbalina ZF, Belan LN (2012) Study of the change in morphological structure of municipal solid waste in the city of Ufa (Изyчeниe измeнeния мopфoлoгичecкoгo cocтaвa твёpдыx бытoвыx oтxoдoв в мeгaпoлиce г. Уфe). RUDN University Bulletin, a series of Ecology and life safety (Becтник PУДH, cepия Экoлoгия и бeзoпacнocть жизнeдeятeльнocти) 4
Vergara SE, Tchobanoglous G (2012) Municipal solid waste and the environment: a global perspective. Annu Rev Environ Resour 37:277–309. https://doi.org/10.1146/annurev-environ-050511-122532
Voigt R, Dehoust G, Merz C (2015) The Climate Change Mitigation Potential of the Waste Sector: Illustration of the potential for mitigation of greenhouse gas emissions from the waste sector in OECD countries and selected emerging economies; Utilisation of the findings in waste technology transfer, Texte 56/2015, Dessau-Roßlau
Volynkina E, Khalaman N, Hall C (2009) Landfill inventory for Russia. https://www.globalmethane.org/Data/223_RussiaInventory-2009.pdf
Volynkina EP, Zaytseva TH (2010) Inventory of landfills and landfills in Russia and assessment of their methane potential “Инвeнтapизaция пoлигoнoв и cвaлoк Tбo в Poccии и oцeнкa иx мeтaнoвoгo пoтeнциaлa.” Ecol Ind Rus 1:30–31
Weitz KA, Thorneloe SA, Nishtala SR, Yarkosky S, Zannes M (2002) The impact of municipal solid waste management on greenhouse gas emissions in the United States. J Air Waste Manag Assoc 52:1000–1011. https://doi.org/10.1080/10473289.2002.10470843
Wuensch C (2011) Vermeidung von Treibhausgasemissionen durch Steigerung der Energieeffizienz deutscher Müllverbrennungsanlagen. Dissertation, Technische Universität Dresden
Wuensch C, Kocina R (2019) Global development of greenhouse gas emissions in the waste managegement sector. Detritus 7:104–108. https://doi.org/10.31025/2611-4135/2019.13856
Wuensch C, Simon F-G (2017) The reduction of greenhouse gas emissions through the source-separated collection of household waste in Germany. In: Maletz R, Dornack C, Ziyang L (eds) Source separation and recycling. The handbook of environmental chemistry, vol 63. Springer, Cham
Yedla S, Sindhu NT (2016) Assessment of alternative disposal methods to reduce greenhouse gas emissions from municipal solid waste in India. Waste Manag Res 34:553–563. https://doi.org/10.1177/0734242X16643176
Yılmaz İH, Abdulvahitoğlu A (2019) Evaluation of municipal solid waste options in Turkey: Scenarios for energy recovery, carbon mitigation and consequent financial strategies. Resour Conserv Recycl 147:95–110. https://doi.org/10.1016/j.resconrec.2019.02.029
Zaytsev BA, Sotnezov AB (2015) Experimental determination of composition and properties of municipal solid waste—a key stage for the development of program activities in the field of MSW management (Экcпepимeнтaльнoe oпpeдeлeниe cocтaвa и cвoйcтв твepдыx кoммyнaльныx oтxoдoв – ключeвoй этaп пpи paзpaбoткe пpoгpaммныx мepoпpиятий в oблacти yпpaвлeния кoммyнaльными oтxoдaми). Adv. Chem. Chem. Techn.:21–23
Zilenina V, Ulanova O (2017) Study of the composition of hazardous municipal solid waste (Изyчeниe cocтaвa oпacныx твёpдыx кoммyнaльныx oтxoдoв (нa пpимepe XИT)). Collection of the first international environmental forum in Ryazan
Acknowledgements
The authors wish to thank all who assisted in conducting this work.
Funding
Open Access funding enabled and organized by Projekt DEAL.
Author information
Authors and Affiliations
Contributions
CW involved in conceptualization, data curation, methodology, validation, visualization, writing — original draft, and writing — review and editing. AT involved in conceptualization, data curation, investigation, and writing — original draft.
Corresponding author
Ethics declarations
Conflict of interest
The authors declare that they have no conflict of interest.
Additional information
Editorial responsibility: Maryam Shabani
Supplementary Information
Below is the link to the electronic supplementary material.
Rights and permissions
Open Access This article is licensed under a Creative Commons Attribution 4.0 International License, which permits use, sharing, adaptation, distribution and reproduction in any medium or format, as long as you give appropriate credit to the original author(s) and the source, provide a link to the Creative Commons licence, and indicate if changes were made. The images or other third party material in this article are included in the article's Creative Commons licence, unless indicated otherwise in a credit line to the material. If material is not included in the article's Creative Commons licence and your intended use is not permitted by statutory regulation or exceeds the permitted use, you will need to obtain permission directly from the copyright holder. To view a copy of this licence, visit http://creativecommons.org/licenses/by/4.0/.
About this article

Cite this article
Wünsch, C., Tsybina, A. Municipal solid waste management in Russia: potentials of climate change mitigation. Int. J. Environ. Sci. Technol. 19, 27–42 (2022). https://doi.org/10.1007/s13762-021-03542-5
Received:
Revised:
Accepted:
Published:
Issue Date:
DOI: https://doi.org/10.1007/s13762-021-03542-5