
Abstract
Increasing waste generation has become a significant challenge in developing countries due to unprecedented population growth and urbanization. From the literature, many issues have been investigated that signify direct connection with the increase in waste material generation and related difficulties to handle it in a smart city. These issues are the resultants of an improper collection and disposal mechanism used for waste material, the increase in moving trends of peoples toward big cities and lack of intelligent technology used to support the municipal solid waste management system. Consequently, the management of waste material has become a challenge due to a large amount of waste littered everywhere. Furthermore, various problems also occur due to the existing systems that are not only inadequate and inefficient but also their non-scientific procedures involved in the solid waste management. In this paper, an IoT-based smart waste bin monitoring and municipal solid waste management system is proposed. This system helps to solve the problems associated with management of waste material and the IoT-based waste collection for the smart city as discussed above. The proposed system is capable in the collection of waste effectively, detection of fire in waste material and forecasting of the future waste generation. The IoT-based device performs the controlling and monitoring of the electric bins. These devices are wirelessly connected with the central hub to transmit the information about the bins filling level with the existing location. The significant advantage of the system is to collect waste material on time in order to avoid the overflow of bins that would help in saving the environment from pollution.
1 Introduction
The waste generation in big cities is increasing rapidly from the last two decades. As per the studies conducted globally, it is expected that the annual solid waste generation will reach around 3.40 billion tones by 2050 that would lead to an approximately cost of $635.5 billion in the management of municipal waste management [1]. For the management of waste in smart cities, there are many factors that play a significant role to make the waste management more challenging, for an example, rapid growth of population, shifting of population from small cities to big cities, economic development, growing rate of consumptions of goods, geographical location, system administration, improper way of collection and disposal of waste, inefficient way of waste generation predictions and lack of smart technologies used to support the municipal solid waste management (MSWM) [2]. Improper management of waste in cities results in a huge loss to any smart city, for an example, the economy and precious human life losses have been reported due to sudden fire catching in an open waste dumping yards situated in the congested areas of city. It is further noted that any type of waste like solid, liquid or containerized gas that may easily catch fire can cause injury, diseases, economic loss and environmental damages [2, 3]. There are two most critical factors that contribute to the generation of waste material at large scale are as (1) growing population in cities and (2) the average mean living standards [4, 5]. While we need to control these two factors, it is also important to come up with an efficient system, techniques and methods to support MSWM and other incidences such as early fire detection in a smart city. It can only be possible with the usage of advancements in the technology, and Internet of Things (IoT) is one of such technologies available that can play a vital role in handling these kinds of issues. IoT is not a single device or system rather it is an umbrella that covers multiple physical and electrical appliances, modern vehicles, buildings and each equipment that we use in daily life [6, 7]. All these devices and appliances are inter-connected to each other through internet such that they can interchange the data between themselves and falls under IoT [8, 9]. IoT facilitates us to regulate working of these devices remotely through a previously deployed network infrastructure, hence assisting in a special direct implementation of wirelessly controlled systems into the physical world.
This paper describes how an integrated physical system designed with the combination of different engineering disciplines and taking the benefit of wireless access networks can lead to improving the management of smart cities. The proposed system lays over the foundation of global positioning system (GPS) based location identification of waste bins. It consists of an IoT-based prototype liaised with sensors measuring the level of waste in bins, temperature and humidity, fire detection, with the capability of transmitting collected information to the control center through a wireless network. The collected data are further used for the prediction of bins fill level and the future forecast of total volume of waste collection on a monthly and yearly basis.
The designed system is simulated based on the realistic scenario in Najran city of the Kingdom of Saudi Arabia (KSA). It is the capital of Najran Province. Najran is one of the fastest-growing cities in the kingdom; its population had risen from 47,500 in 1974 and 90,983 in 1992 to 246,880 in 2004 and 500,000 in 2017 [10]. In this work, freely available geolocation open data of the municipality of Najran city is used [11]. The simulations were performed for the one-month period of waste collection from the bins. The experiment is performed on both IoT-based bins and non-IoT-based bins to check the efficiency of designed system under feasible economic conditions.
The expected outcomes of this work are an integrated system model for the useful collection of waste with the help of IoT-based bins and to reduce the operational cost of the existing municipal system. The designed system is equipped with flame sensors to detect the fire inside and outside the bins. The fire detection capability is introduced to save significant losses of economy and life. Furthermore, future waste collection is predicted to support the waste management industry with the application of a smart city. The system will reduce the effort of man power involved in municipal management by providing effective usage of waste bins; respective personal can only go to collect waste when bins send alerts. Following are the significant contribution of this paper:
-
i.
The proposed model will provide efficient, real-time and IoT-based garbage collection solutions to municipal solid waste management.
-
ii.
It will improve environmental quality leading to reduce health issues by delivering scheduled emergency alerts.
-
iii.
It will reduce the cost and provide an efficient way to use resources.
-
iv.
It will help in reducing the traffic congestion as well as noise due to the municipal transportation.
-
v.
It will reduce the man power effort of municipal management by providing effective usage of garbage bins.
The rest of the paper is organized as follows: Sect. 2 describes comprehensive related work. The designed system and the details of its function are discussed in Sect. 3. Section 4 elaborates on the result and analysis of the system and bins distribution model. The future waste prediction is in Sect. 5. Finally, Sect. 6 summarizes this study as a conclusion.
2 Related Work
Many IoT-based smart systems have been proposed to deal with different kinds of challenges existing with current waste management systems in smart cities. From the literature, it is observed that the most critical issue is solid waste management for the smart city. The researchers have adopted various methods and techniques to resolve these issues, specifically, the solid waste management [12]. In [13,14,15], the capacity, weight, temperature, humidity and chemical sensors are used for solid waste monitoring and collection.
In [15], author (s) have presented a municipal solid waste management platform for recycling collection information with the help of IT technology. In this study, a model was developed for waste collection, transportation, recycling and processing. The results presented in this work demonstrate that the developed system help municipal authorities to use the information produced at every stage of waste monitoring and collection. Finally, the system achieved the goal of providing an intelligent way of waste recycling of collection material.
An efficient control method to measure the waste material filling level of bins is introduced in [16]. This system uses a microcontroller, transmitter, receiver, RF (radio frequency) module and IR (Infrared) sensor to collect the information of waste from the bins on time. In this system, sensors sense the level of waste in the bins and send alerts to the controller. Microcontroller encodes these alerts and forwards to the main central processing unit.
Another innovative way to collect waste information from the bins is presented in [17]. In this work, proposed system was integrated with ultrasonic sensors and GSM (global system for mobile) module. The ultrasonic sensor detects the level of waste and compares its current level of waste with the defined threshold level. If the current level of waste reaches the threshold limit, the sensor notifies the update to the Arduino that is responsible for the overall communication of the system. The Arduino further sends this signal to the GSM module that is wirelessly linked with the smartphones to share this information with concern authorities.
In [18], the Raspberry Pi is used along with the ultrasonic sensor to measure the exact ratio of waste material. This system enables communication between sensors and humans through internet in order to receive the status waste material filling in the bins. Further a scheme for obtaining information from bins with regards to solid as well as liquid waste material is proposed in [19]. This scheme consists of wireless sensor networks (WSN) and IoT. In particular, different sensors are attached to smart bins and communication between bins and sever was carried out through WSN. Here, waste collector agent (WCA) is playing a vital role as it receives all the alerts that are generated by the sensors. In the Asansol (a city of India), geographical information system (GIS) is proposed that particularizes the plans for the collection, storage and transportation of waste material in a smart way [20]. A real-time smart dumpster is proposed in [21] that is based on the GSM module which efficiently collects the waste material from the targeted areas of the city. The existing systems for waste management are compared based on several principle characteristics and are detailed in Table 1.
3 System Description
The design of an IoT-based smart waste collection and monitoring system is accomplished with the help of required hardware, software/programming tools and other IoT devices. This system aims to provide support in solid waste management for the municipality of Najran city of Saudi Arabia in order to handle the collection of waste generating at rapid growth. In addition, this system is enabled to detect the fire (flaming) inside the bins that would help in saving human life and economic losses.
The proposed system is developed based on the waste level data from the smart bins in a city. Three fill-up levels have been defined in the system to check the status of waste in the bins. These three levels are identified as follows:
-
Empty Level: the empty level of bins is an initial stage and the system triggers this level when the bins are empty or being empty by the waste-truck driver in the given time frame.
-
Half Level: This filling level is defined to check the new status of bins and helps the system to predict the fill-up time of these bins. These bins were also collected by the truck driver in the same visit when collecting the waste from the full bins. The half level of bins is helpful to reduce the traveling cost of waste-truck in terms of fuel and time.
-
Full Level: This level of bins received by the system when the system alerts “full” trigger by the sensors and system notify the municipal authority and waste-truck drivers.
The bins were installed at the different locations of the city by using a distance placement model as described in Sect. 3.3 and Fig. 4. The data collected with the help of sensors are forwarded over the internet to store information on server and cloud for further processing and analysis. The existing/stored data are then utilized for the future monitoring and prediction of the waste generation types and areas. The key feature of the system is to learn from previous experiences and share updates not only for the daily status of the bin’s fill level but also for the future state forecast of waste generation. The proposed system is also helpful to control traffic congestions and providing cost-effective approach while it helps in other factors that cannot be predicted by the human being. Figure 1 presents an overview of the proposed system.

System overview
The proposed system comprises various technological modules and sensors which are integrated. All these components and modules in combination make this proposed system to achieve desired objectives. Additional components are used in the IoT-based smart waste collection system that is integrated to form the complete system. Three types of components are used in the system such as (1) software-based components, (2) hardware-based components and (3) additional components like connection wires and bread board for communication between hardware and software.
3.1 System Functions
The designed system functions based on three modules are shown in Fig. 1 as well as elaborated below:
3.1.1 Sensing Module
The sensing module of the proposed system consists of four components that altogether act as a system. These four components are microcontroller, sensors, network interface and power which are further explained in next following sections.
-
Microcontroller: In this study, an Arduino Uno microcontroller is used to provide the connectivity control over other devices which are equipped with ATmega328p. It operates on 16 MHz clock speed and moves up to 1.5 Mips per MHz. It has a built-in 2 Kbytes RAM and 32 Kbytes flash memory. It can run on voltage 2.5 V to 5.5 V with its capacity to consume (40–50 mA) very less power. The choice of microcontroller depends on the requirement of memory, processing, minimum power consumption and low cost. The Arduino Uno controller used in this research is good enough to receive data from the sensors and forward it to the server via a network interface card and internet services while being more cost-effective.
-
Sensors: Four types of sensors are used in the proposed prototype, e.g., ultrasonic sensor, flame sensor, temperature and humidity sensor and weight sensor for their respective usages. Ultrasonic sensors (HC-SR04) are used to measure the waste level based on the distance inside the bins. Based on the distance from top to bottom of the bin, status of waste inside the bins is defined into three fill-up levels as mentioned earlier. Flame sensors (SK-026) are used to detect the fire inside the bins. We configured it on 760 nm to 1100 nm wavelength and detection distance 100 cm to 200 cm. Temperature and humidity sensors (HW-505) are used to detect the level of temperature and humidity of the bins that helps in predicting an upcoming fire or non-favorable events. Weight sensors (SEN-10245SEN-10245) are used to get the actual weight of collected waste from each bin to predict the future generation of waste from the specific area.
-
Network Interface: Sensing module initially collects the data through various sensors, and these data need to be sent on the server remotely through a wireless link. In this study, Wi-Fi was used as a network interface in the designed prototype. For this, SIM900A V4.0 Kit Wireless Extension Module GSM GPRS with the onboard antenna was used. This Kit provides the best coupling with “ATmega328p” microcontroller while it is economically cost-effective. The designed prototype was completed at the cost of around 50$ only.
-
Battery and Solar: The battery is an essential part of the prototype to increase the life span of the system. Two batteries of 12 V were used in the prototype and enabled with solar-based charging as shown in Fig. 2. The wireless technology, sensing data and forwarding rates are directly influenced by energy consumption.
Fig. 2 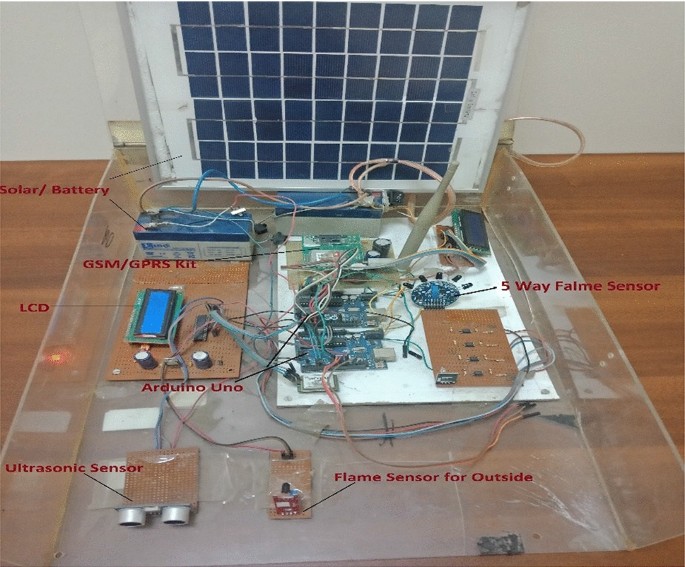
The prototype used in the experiment

3.1.2 Storage Module
The storage module of the proposed system consists of three components that altogether act as a one module. These three components are database, distance calculation model and prediction algorithm which are further explained in the next following sections.
-
Database: In the storage module, all the data collected from various sensors need to be stored and for this purpose MySQL database was used in this study. This database stores all information in structured way so that it can be retrieved for various purposes. The stored data (sensor, location, etc.) are used for the prediction of bins level and forecasting of total waste collection monthly and yearly.
-
Distance Calculation Model: In this study, distance calculation model is applied to calculate the distance between bins to be placed at different locations in a selected area. This model helps to choose the best place for the installment of bins in the street with respect to living crowed in that area and waste generation ratios.
-
Prediction Algorithm: The predictive analytic algorithm is used to forecast the future waste generation on a monthly and yearly basis to make the best decision and planning to handle future waste generation for the smart city. The predictive model is applied to collected data from 100 bins to forecast the next waste generation in a defined period. The predictive model works on historical data and predicts what will happen in the future.
3.1.3 User Module
The user module of the proposed system consists of two components that altogether act as a one module. These two components are waste data collection and display which are further explained in the next following sections.
-
Waste Data Collection: The waste data are collected by the waste-truck as per the defined schedule. The waste-truck visited sites when it receives an alert from the bins or as per the prescribed schedule. Additional data that waste-truck needs to keep in the record are GPS coordinates of bins and a history of visited routes to collect the data.
-
Display: The updated status of bins is displayed on LCD and shared on multiple devices like mobile, tablet, navigation system with data access and other connected display devices. The waste-truck driver can visualize the updated status of the bins and act accordingly.
3.2 System Flowchart
Figure 3 presents the overall system flow to detect the level of waste and fire (flaming) inside the bins. The connected components get initialized by the power supply. All connected sensors periodically check the status of bins. If there is any input from the connected sensors, the GPRS module gets the coordinates of the current location of bins. Further, location coordinates are sent to the municipal solid waste management control room and other relevant connected waste-truck to take possible and prompt actions. The system will wait for the defined amount of time and re-check the waste filling status of bins if they are empty/clear from waste or not followed by sending an update to the municipal management. In case the status of bins is not set to clear/empty in the given time, the system will send messages directly to the higher authorities for further actions. Table 2 illustrates the average reading value of two IoT bins for the waste collection and other assign parameters for 10 number of rounds (Table 3).

Workflow of the proposed system for waste collection and monitoring
3.3 Bins Distribution and Prediction Model
The distance between bins that need to be installed in specific areas and capacity of accessibility issues can occur during the installation of bins. In this work, a statistical bin distribution model is applied that helps to decide the distance between bins in the defined area. Equation 1 explains how the range and size of bins are selected with the connection of waste generation ratios in specific areas.
Here, \(x_{0} > 0\) is the scale of defined area where bins are installed and \(\beta > 0\) is a parameter for the design of bins. This model of distribution is a better fit for the random deployment of bins for several places.
Equation 2 is designed to predict the waste filling level of bins at a specific time of intervals daily or weekly from bins. This can be extended for a more significant number of bins as required.
where
-
ɩ = {1,2,3,4…100}
-
C0=is the initial time of bins
-
C =Prediction completion time
-
h = Time difference of bins for a specific period
-
fo = weight capacity of bins.
Equation 3 shows the future prediction of waste collected from the bins in a specific area to define the number of days. The basic equation is taken from [30].
where
\(y = {\text{indicates}}\,{\text{the}}\,{\text{future}}\,{\text{amount}}\,{\text{of}}\,{\text{waste}}\)
\(x = {\text{The}}\,{\text{days}}\,{\text{or}}\,{\text{month}}\,{\text{for}}\,{\text{which}}\,{\text{prediction}}\,{\text{is}}\,{\text{made}}\)
\(A = \bar{x}\,{\text{dataset means}}\)
\(B = \bar{y}\,{\text{dataset means}}.\)
4 Results and Discussion
The simulation was done in MATLAB (Mathworks Inc., USA). Four weeks’ time was considered for the simulation to collect the results, and it is assumed that the system is already stabilized. The area of 100 km2 is considered for simulation, and 100 bins were placed on different locations with different weight capacities of waste. The size and distance between bins are measured using the installation model discussed in Sect. 3.3. The waste from bins were collected twice a day. The filling rates will remain the same for all bins; however, the capacity of bins can vary as per generation of waste ratio and pre-calculated for the simulation time before running the experiments. The 100 bins were distributed in 5 regions (street) and each region contains 20 bins. Four (4) routes are defined to collect the waste by the truck and one waste-truck is assigned for each region consisting 20 bins. The waste-truck capacity is defined equal to the sum of 20 bin’s capacity. The case study is presented in Fig. 4. The waste-truck visited the site to collect the waste only when it receives multiple alerts from different IoT bins in the same area in a defined amount of time and as per defined schedule timeframe for non-IoT bins. Four (4) waste disposal points are taken into the simulation. Each waste-truck can dispose its waste to the nearest disposal point to save the truck fuel and time. Rest of the configurations are based on WSN and other relevant agents/protocols that are needed to check the performance of the designed system. Waste material collection ratio between IoT vs. non-IoT bins, cost comparison for the visit of waste-truck to collect the waste from the bins and delay in collection of waste are the basic parameters that are considered to evaluate the performance of the system. Two types of experiments were conducted as follows:

Bin distribution case model
Waste Collection Methods: two collection methods are compared during the experiments.
-
10.
Non-IoT Based: 20 waste bins are allocated to each waste-truck. The area for these non-IoT-based bin placement is also given in 5 regions based on their geographical location and each region size corresponds to almost equal to others. Collection of waste is arranged on a specific time in a day.
-
11.
IoT Based: In the IoT-based waste collection method, bins were selected to make them empty based on the filling alerts generates by the system (half and full). The truck driver visiting the same number of waste bins in a day is a constraint to compare the result of both collection strategies based on the distance covered by the truck driver. The waste collection cost is calculated as per Eq. 4, where Xi is expenses for the visited route by the waste-truck, Ckm is the cost of driving per kilometer, Di is traveling distance, Si is the average speed of waste-truck per route. The average speed (50 km/h with weight and 90 km/h without weight) of truck is considered due to the constraint of traffic rules and appliance capacity, and i is the number of created routes to collect the waste.
Table 4 presents the efficiency results for two methods used to collect the waste from the bins. It is expressed as the average per collected bin. The results indicate that the non-IoT waste collection method required a long driving distance as compared to IoT bins. When using IoT-based bins, the efficiency was improved in terms of average waste collection delay to 18 min only as compared to 55 min delay for non-IoT-based bin while total percentage in successfully hitting the bins which are fully filled is increased to 89% when using IoT-based bin as compared to 72% when using non-IoT-based bin. The efficiency has also been reflected as the percentage of total waste pollution generated by IoT-based bin was 0.02% as compared to 0.30 generated by non-IoT-based bins. The proposed system also suggests that the efficiency can further be improved by increasing the number of bins to be collected per day.
4.1 Pollutions Impact Calculation
Every type of waste has a different pollution impact on the environment as shown in Table 5. The summary of emission characteristics of different waste materials is taken from [31]. We have used the average of all types of waste material impacts and created the link with the weight of waste collection in a kilogram. We assumed that the collected waste from the bins is mixed and 1 kg of waste can produce around 35.75% emission impact on the environment. The pollution environment ratio is calculated as per Eq. 5, where Ki is the total pollution impact from the single bin. Ef is the average relative emission impact and Wbj is the total collected weight from bins by the sensors. The collected weight of 100 bins is considered for the waste pollution ratio as a case study. The environmental pollution ratio between IoT and non-IoT bins is shown in Fig. 6. The summary of emissions to the air by the different treatments of different kinds of waste is shown in Table 6.
The data of Tables 5 and 6 were used to measure the pollution ratios toward environment from the collected waste per KG. Figure 5 shows the waste material collection ratio against the IoT and non-IoT-based bins. The IoT bins were collected through the message alerts and non-IoT as per the manual routine of MSWM of Najran. Although the total collected waste-weight by the non-IoT bins is a little higher than the IoT bins, it is not accurate because it is measured based on the specific capacity of bins. On the other hand, the IoT bins show the actual collected weight of waste material as shown in Table 3. The results show that the rate of the waste material collection under the IoT-based bins is higher than the non-IoT-based bins due to efficient collection material. The higher ratio of the waste material collected in IoT bins shows that the waste will be collected on time that reduces the pollution ratio in the environment in order to save people from many diseases.

Waste collection ratios between IoT vs. Non-IoT bins
Figure 6 illustrates the possible pollution impact on the environment due to the late collection of waste. The results show that the collection of waste by the IoT bins is more effective as compared to non-IoT bins. Therefore, the timely collection of waste guarantees clean and less pollution impact on the environment as shown in Table 3. It is observed in the simulation that as the bins are increasing, the effect of pollution by non-IoT bins is slightly higher than the IoT bins.

Environment pollution ration between IoT vs. non-IoT bins
In Fig. 7, collection delay decreases in IoT-based bins in comparisons with the non-IoT-based bins where the delay is higher. The higher delay in non-IoT-based waste collection results in waste being scattered around the bins that create the smell and pollute the surrounding environment.

Waste collection delay between IoT vs. Non-IoT bins
Figures 5, 6 and 7 show that the IoT–based bins perform better as compared to non-IoT-based bins when the number of collection bins increases for the truck driver’s to collect the waste from these bins. The slight variations in the results are only due to the time-shifting difference of day and night.
4.2 Future Waste Collection Prediction
Based on the previously collected data from the selected bins, the predictive analytic algorithm namely decision tree and neutral network is applied to predict the future waste collection and this algorithm is taken from [33]. The predictive algorithm is used for the static and dynamic scenarios. The accuracy of the future forecast is calculated as per Eq. 6.
4.2.1 Static Mode
The non-IoT bins can contain maximum of 40 KG waste. The statics model is applied on the capacity of non-IoT bins to predict the future generation of waste monthly. Here, it is essential to mention that we have taken 100 bins for the future waste prediction as a case study. The bins were collected twice a day. The weight is calculated as per Eq. 7, where m = 30, n = 100 and t = 2
\(W_{d1} = {\text{weight of bin }}1\)
\(W_{d2} = {\text{weight of bin }}2\)
\(W_{dn} = {\text{weight of bin }}n\)
m = total number of days in a month
t = attempts to collect waste per day.
In Fig. 8, the blue line of the graph shows the real collected waste from January 2019 to September 2019. The orange line of the graph shows predicted weight of waste from November 2019 to December 2021. The graph presents the trend of waste generation and collection, and it is observed that waste collection will increase or decrease as the number of bins and attempts to make them empty will increase. It is found that the forecasted accuracy in the static model is about 99% due to fix collected weight from each bin. It is the problem of static model that shows accuracy very high because the bins have specific capacity of weight to hold the waste material. The calculation of actual weight of collected waste from each non-IoT bins is not possible without weight sensors.

Future waste generation prediction by the non-IoT bins
4.2.2 Dynamic Model
The dynamic model is applied to IoT-based bins in which the weight sensors receive the real sensed weight from the bins and sent it to the controller for further processing. The prediction for the future waste collection is made on the collected data from the sensors. We have taken 100 bins for the prediction of data as a case study. Figure 9 depicts the future waste generation prediction based on real sense data from IoT bins. In Fig. 9, blue bar of the graph shows the real weight of collected waste provided by the sensor from January 2019 to October 2019. The orange bar of the chart shows the monthly predicted weight of waste from November 2019 to December 2021. It has been observed that variation in waste collection weight is based on the real pressure sensed by the weight sensor as shown in Fig. 9. The forecasted accuracy of the dynamic model is about 98% based on real collected data from the IoT bins. Equation 3 presents the calculation of the collected waste from IoT-based bins monthly. The dataset for the future waste prediction processed through Eq. 8, where n = 100 and m = 30.

Future waste generation prediction based on real sense data from IoT bins
\(x_{i} {\text{ = received weight from the bins}}\)
m = total number of days in a month
n = total number of bins.
5 Literature-Based Comparison
The designed system has been compared with other latest well known IoT-based waste management and monitoring systems. The comparison is made based on major hardware used and performance parameters like data storage, data prediction accuracy, fire detection and cost of the prototype. The data storage is compared based on the storage either on the local server or cloud server. Our proposed system store’s data on both places, but only meaningful data are stored on the cloud. Rest of the data are stored on the local server. In another design system, some system stores complete data on a local server and others are storing data on the cloud server. The future data prediction is compared based on the accuracy that the design systems claimed in the published work. Some design systems used fire detection, and it has been observed (Table 2) that the average fire detection accuracy in the proposed system is much higher as compared to other fire detection methods. Table 7 shows a comparison of proposed and existing designed systems.
6 Conclusion
This study presents a smart way to collect wastage in a smart city. The system is designed based on an IoT sensing prototype that measures the waste level of bins and sends the information to the server via internet services. The data stored on the server as well as over the cloud is used for further processing and analysis. Based on this data, the collection area is divided into five regions and four routes are further created which were then assigned to waste-truck to hit the filled bins successfully in the simulation. The paper is mainly focused on the efficiency and operational cost of the system. The designed prototype of system is also enabled for fire detection (for fire detection accuracy, please see Table 2) to save economic and human life losses. The system is designed to support MSWM of Najran city of KSA.
It has been observed in the results that waste collected through IoT-based system is more effective as compared to traditional methods. The real-time filling status monitoring improves the efficiency of average waste collection due to same-day collection of bins as it becomes full and by reducing the effect of pollution ratio into the environment. In terms of cost efficiency, the cost of the IoT-based systems is slightly higher at an early stage due to the deployment and maintenance, but the operation cost is considerably lower than the non-IoT methods. The results obtained in this study show that the system predicts the future waste generation with acceptable accuracy and efficiency.
The future directions of this work are to analyze the numerical results in terms of waste-truck route optimization and cost reduction of the system including development and maintenance cost. Furthermore, the possible future steps involve using available GIS data that can help in improving the efficiency of the IoT base system without using any assumptions.
References
Kaza, S.; Yao, L.C.; Bhada-Tata, P.; Van Woerden, F.: What a Waste 2.0: A Global Snapshot of Solid Waste Management to 2050. Urban Development; Washington, DC: World Bank. © World Bank. https://openknowledge.worldbank.org/handle/10986/30317. Accessed 24 Apr 2020
Kansara, K.; Zaveri, V.; Shah, S.; Delwadkar, S.; Jani, K.: Sensor based automated irrigation system with IOT: a technical review. Int. J. Comput. Sci. Inf. Technol. 6(6), 5331–5333 (2015)
Tapashetti, A., Vegiraju, D., & Ogunfunmi, T. IoT-enabled air quality monitoring device: a low cost smart health solution. In: 2016 IEEE Global Humanitarian Technology Conference (GHTC), pp. 682–685. IEEE (2016)
Kelly, S.D.T.; Suryadevara, N.K.; Mukhopadhyay, S.C.: Towards the implementation of IoT for environmental condition monitoring in homes. IEEE Sens. J. 13(10), 3846–3853 (2013)
https://en.wikipedia.org/wiki/Najran access date 22 November 2019, Time 1:30 pm
Kim, K.J.: Interacting socially with the Internet of Things (IoT): effects of source attribution and specialization in human–IoT interaction. J. Computer-Mediat Commun 21(6), 420–435 (2016)
Schaffers, H.; Komninos, N.; Pallot, M.; Trousse, B.; Nilsson, M.; Oliveira, A.: Smart cities and the future internet towards cooperation frameworks for open innovation. In: Domingue, J., et al. (eds.) The Future Internet FIA 2011 Lecture Notes in Computer Science, vol. 6656. Springer, Berlin (2011)
Pavithra, D., Balakrishnan, R.: IoT based monitoring and control system for home automation. In: 2015 global conference on communication technologies (GCCT), pp. 169–173. IEEE.
Mitton, N.; Papavassiliou, S.; Puliafito, A.; Trivedi, K.S.: Combining Cloud and sensors in a smart city environment. EURASIP J. Wirel. Commun. Netw. 2012, 247 (2012)
https://en.wikipedia.org/wiki/Najran. Accessed date 18th April 2020. Time: 11:15am.
Hannan, M.A.; Abdulla Al Mamun, M.; Hussain, A.; Basri, H.; Begum, R.A.: A review on technologies and their usage in solid waste monitoring and management systems: issues and challenges. Waste Manag 43, 509–523 (2015)
Hu, L.; Ni, Q.: IoT-driven automated object detection algorithm for urban surveillance systems in smart cities. IEEE Internet of Things J. 5(2), 747–754 (2017)
Tao, C.; Xiang, L.: Municipal solid waste recycle management information platform based on internet of things technology. In: Proceedings of IEEE International Conference on Multimedia Information Network Security, pp. 729–732 (2010)
Anghinolfi, D.; Paolucci, M.; Robba, M.; Taramasso, A.C.: A dynamic optimization model for solid waste recycling. Waste Manag 33(2), 287–296 (2013)
Hannan, M.A.; Arebey, M.; Begum, R.A.; Basri, H.: Radio Frequency Identification (RFID) and communication technologies for solid waste bin truck monitoring system. Waste Manag 31(12), 2406–2413 (2011)
Mamun, M.A.; Hannan, M.A.; Hussain, A.; Basri, H.: Wireless sensor network prototype for solid waste bin monitoring with energy efficient sensing algorithm. In: Proceedings of IEEE International Conference Comput. Science and Engineering, pp. 382–387 (2013)
Khedikar, A; Khobragade, M.; Sawarkar, N.: Waste management of smart city using IOT. Int. J. Res. Sci. Eng 3(2) (2017)
Anjomshoaa, A.; Duarte, F.; Rennings, D.; Matarazzo, J.; deSouza, T.; Ratti, C.: City scanner: building and scheduling a mobile sensing platform for smart city services. IEEE Internet Things J. 5(6), 4567–4579 (2018)
Kasliwal Manasi, H.; Suryawanshi Smitkumar, B.: A novel approach to garbage management using Internet of Things for smart cities. Int. J. Curr. Trends Eng. Res. (IJCTER) 2(5), 348–353 (2016)
Yadav, V.; Subhankar Karmakar, A.K.; Dikshit, S.V.: A feasibility study for the locations of waste transfer stations in urban centers: a case study on the city of Nashik India. J. Cleaner Prod. 126, 191–205 (2016)
Hong, I.; Park, S.; Lee, B.; Lee, J.; Jeong, D.; Park, S.: IoT based smart garbage system for efficient food waste management. e Sci. World J. 2014, 13, Article ID 646953 (2014)
Lundin, A.; Ozkil, A.; Schuldt-Jensen, J: Smart cities: a case study in waste monitoring and management. In: Proceedings of the 50th Hawaii International Conference on System Sciences, Waikoloa, HI, USA (2017)
Cerchecci, M.; Luti, F.; Mecocci, A.; Parrino, S.; Peruzzi, G.; Pozzebon, A.: A low power IoT sensor node architecture for waste management within smart cities context. Sensors 18(4), 1282 (2018)
Khoa, T. A.; Phuc, C. H.; Lam, P. D.; Nhu, L. M. B.; Trong, N. M.; Phuong, N. T. H.; Van Dung, N.; Tan-Y, N.; Nguyen, H. M.; Duc, D. N. M.: Lam Waste management system using IoT-based machine learning in university. Wirel. Commun. Mob. Comput. 2020, 13, Article ID 6138637 (2020). https://doi.org/10.1155/2020/6138637
Bueno-Delgado, M.-V.; Romero-Gazquez, J.-L.; Jim ´ enez ´, P.; Pavon-Mariño, P.: Optimal path planning for selective waste collection in smart cities. Sensors 19(9), 19 (2019)
Alvaro, L.; Caridad, J.; De Paz, J.; Gonz ´ alez, G.V.; Bajo, J.: Smart waste collection system with low consumption LoRaWAN nodes and route optimization. Sensors 18(5), 1804–1282 (2018)
Hannan, M.; Akhtar, M.; Begum, R.A.; Basri, H.; Hussain, A.; Scavino, E.: Capacitated vehicle-routing problem model for scheduled solid waste collection and route optimization using PSO algorithm. Waste Manag 71, 31–41 (2018)
Jim, A.A.J.; Kadir, R.; Mamun, M.A.A.; Nahid, A.-A.; Ali, M.Y.: A noble proposal for Internet of garbage bins (IoGB). Smart Cities 2(2), 214–229 (2019)
Popa, C.; Carutasu, G.; Cotet, C.; Carutasu, N.; Dobrescu, T.: Smart city platform development for an automated waste collection system. Sustainability 9(11), 2064 (2017)
Mahajan, S.A.; Kokane, A.; Shewale, A.; Shinde, M.; Ingale, S.: Smart waste management system using IoT. Int. J. Adv. Eng. Res. Sci. (IJAERS) 4(4), 93–95 (2017)
Subramaniyaswamy, V.; Manogaran, G.; Logesh, R.; Vijayakumar, V.; Chilamkurti, N.; Malathi, D.; Senthilselvan, N.: An ontology-driven personalized food recommendation in IoT-based healthcare system. J. Supercomput. 75(6), 3184–3216 (2019)
Park, Y.K.; Kim, W.; Jo, Y.M.: Release of harmful air pollutants from open burning of domestic municipal solid wastes in a metropolitan area of Korea. Aerosol Air Qual. Res. 13, 1365–1372 (2013)
Kannangara, M.; Dua, R.; Ahmadi, L.; Bensebaa, F.: Modeling and prediction of regional municipal solid waste generation and diversion in Canada using machine learning approaches. Waste Manag. 74, 3–15 (2018)
Surapaneni, P.; Maguluri, L.; Syamala, P.M.: Solid waste management in smart cities using IoT. Int. J. Pure Appl Math. 118(7), 635–640 (2018)
Bharadwaj, B., Kumudha, M.; Gowri Chandra, N.; Chaithra, G.: Automation of Smart waste management using IoT to support “Swachh Bharat Abhiyan”—a practical approach. In: 2017 2nd International Conference on Computing and Communications Technologies (ICCCT), Chennai, pp. 318–320 (2017)
Gutierrez, J.M.; Jensen, M.; Henius, M.; Riaz, T.: Smart waste collection system based on location intelligence. Proc. Comput. Sci. 61, 120–127 (2015)
Bharadwaj, A.S.; Rego, R.; Chowdhury, A.: IoT based solid waste management system: a conceptual approach with an architectural solution as a smart city application. IEEE Ann. India Conf. (INDICON)Bangalore 2016, 1–6 (2016)
Chaudhari, S.S.; Bhole, V.Y.: Solid waste collection as a service using IoT-solution for smart cities. In: 2018 International Conference on Smart City and Emerging Technology (ICSCET), Mumbai, pp. 1–5 (2018)
Acknowledgments
The authors acknowledge the support from the Research and Development Office, Ministry of Education, Saudi Arabia in cooperation with Najran University Saudi Arabia in the form of post-doctoral fellowship.
Funding
This research work was funded by the Ministry of Education, Research and Development Office, Saudi Arabia. The APC was funded by the Ministry of Education Saudi Arabia in cooperation with Najran University Saudi Arabia in the form of a post-doctoral fellowship.
Author information
Authors and Affiliations
Contributions
The research conceptualization and methodology are done by Dr. Tariq Ali and Dr. Muhammad Irfan. The technical and theoretical framework is prepared by Dr. Tariq Ali and Dr. Muhammad Irfan. The technical review and improvement have been performed by Dr. Adam Glowacz. The overall technical support, guidance and project administration are done by Prof. Dr. Abdullah Saeed Alwadie.
Corresponding authors
Ethics declarations
Conflicts of interest
There is no conflict of interest.
Rights and permissions
About this article

Cite this article
Ali, T., Irfan, M., Alwadie, A.S. et al. IoT-Based Smart Waste Bin Monitoring and Municipal Solid Waste Management System for Smart Cities. Arab J Sci Eng 45, 10185–10198 (2020). https://doi.org/10.1007/s13369-020-04637-w
Received:
Accepted:
Published:
Issue Date:
DOI: https://doi.org/10.1007/s13369-020-04637-w