
Abstract
Detailed characterization study is the pioneer step for any mineral beneficiation scheme. A series of mineralogical and peterographic studies coupled with (Brunauer–Emmett–Teller) surface area, (atomic force microscopy), (laser diffraction particle size analyser), FTIR (Fourier transform infrared spectroscopy), contact angle measurement, zeta potential were carried out, and the findings about the mineralogical and physico-chemical nature of the sample have been described. This paper provides a guide on the proper selection of beneficiation route for iron ore with complex mineral assemblage (Hematite–Goethite–Laterite–Quartz–Kaolinite–Gibbsite). The beneficiation method, especially froth flotation process, potential after a thorough characterization is suggested analysed and the successful upgradation by froth flotation route is envisaged. Flotation results indicated that it is possible to achieve high grade iron concentrate along with lower silica, and alumina content providing a specific reagent regime/system for specific mineral assemblages.
1 Introduction
Mining engineers produce ore through various mining methods, but consumers are linked only through mineral engineers, and products of marketable quality in commercial quantity are the outcome of the mineral processing efforts. Due to the exponential metal demand, changed socio-economic conditions, rigorous environmental regulations on mining industry and devastation of high grade resources has necessitated the utilization of low grade dumps and fines in iron and steel industries. Mineral characterization is important due to stringent specification requirements for raw materials and mineral products for the iron and steel industry to be competitive in the domestic and global markets. Systematic characterization can maximize the profit by ensuring scientific optimization of mineral processing operations; hence, in order to exploit any mineral deposit, it is recommended to obtain comprehensive valuable data on all gangue and value minerals present and their respective proportions in the ore. Mineralogical investigation has to be carried out not only for economically valuable mineral, but also for the penalty elements, whose presence and association with valuable minerals may negatively impact on the processing performance and merchandising of final products [1].
Grain size of the minerals and their textural relationship with other associated minerals help in deciding the appropriate liberation size, which ultimately help in developing beneficiation flow schemes. If the proper processing technology for the fines generated and for reduction in gangue is not found, the mining operations and productivity need to be slowed down, due to lack of space for dumping the waste slimes and to offset the cost issues.
Iron ore tailings have become a serious concern over the years from the environmental and economic compliance [2,3,4,5,6]. No commercial plant has been set up so far to recover the iron values from such ores/fines for any industrial applications [3,4,5,6,7]. A thorough and in-depth analysis of the mineralogical association of an ore is essential to develop and choose a proper beneficiation process. The current work assesses what are the gangue minerals present along with the iron minerals and the most relevant choice of beneficiation method(s) depending upon on the nature of association of value and gangue minerals. Previous works generally focus on the physical characterization of the sample and on the basis of findings, beneficiation methods have been chosen. But this work emphasizes on the both physical, mineralogical and physico-chemical nature of the sample, and on the basis of the thorough characterization studies, beneficiation schemes has also been suggested. The effects of characteristics of material on beneficiation route have been discussed in detail, and suitable beneficiation route to successfully upgrade the given material system up to metallurgical grade has been analysed.
2 Materials and Methods
2.1 Sample Collection
Low grade dumped tailing fines of approximately 150 kg were collected from a tailing pond associated with the iron ore processing plant, Barsua iron ore mine and subjected to sampling for further characterization analysis. The ore body of Barsua iron mine, Sundergarh, Odisha, is extended through Barsua-Taldih-Katla and is situated in the classic iron-bearing formations of Odisha. The stepwise procedure for material preparation for different characterization studies and different beneficiation studies has been mentioned in Fig. 1.

Flowsheet of material preparation for characterization and beneficiation studies
2.2 Characterization
The sample was subjected to size and size-wise chemical analysis, specific gravity, liberation studies, microscopic studies and peterographic image analysis, qualitative XRD analysis, FE-SEM–EDX studies, TG–DTA analysis, material volume and surface area analysis by particle size analyser, Fourier transform infrared spectroscopy (FTIR) analysis, zeta potential measurement, contact angle measurement for the wettability of sample, textural characterization and porosity measurement by BET analyser and AFM image analysis to know the surface roughness and heterogeneity.
2.2.1 Physical Characterization
After sampling, size distribution was carried out by using screens and sieves. Wet chemical analysis was done for determining the percentage of iron, alumina and silica present in different size ranges. The entire stock solution (~ 250 ml) was passed through a wattman 42 filter paper, and the retained residue upon the filter paper was put in a platinum crucible and kept in furnace at 1000 °C for 1 h. The silica percentage was calculated from the difference between final residue remaining in the platinum crucible (after heating for 1 h) and initial weight of the platinum crucible divided by the weight of ore taken for preparation of stock solution. Similarly, for LOI analysis, 1 gm of sample was taken in a crucible and heated in a high temperature furnace for 1 h at 1000 °C. The weight loss difference was calculated, and it was divided by the total sample taken and then the weight loss by ignition (LOI) was evaluated. The specific gravity of − 75 µm was calculated using pyknometer with water as the medium. Wet-sieving of the sample of different sizes was carried out for slimes coating removal, and then, samples were used for liberation study and grain counting using Leica Zoom Stereo Microscope. Representative sample was taken on a glass slide, on which square grids of equal sizes have been drawn. Grain counting of different minerals present in each square grid was done, which was observed in the microscope. Similarly from this data, the percent minerals present in the sample were calculated.
2.2.2 Mineralogical Characterization
To identify the mineralogical composition, mineral phases, textural patterns, etc., X-ray diffraction (XRD) technique was carried out using model D8 discover, Bruker AXS Gmbh Germany. Polished sections of different size ranges were prepared by mounting epoxy resin and the micro-morphological characteristics were investigated using a reflected light optical microscope (Leitz). Morphology and chemistry of Fe-, silica- and alumina-bearing minerals were investigated by SEM–EDS on moisture-free dried sample using FEI 430 Nova NanoSEM 430 field emission. MALVERN mastersizer, Hydro 2000 MU, which uses a forward laser light scattering technique was used to know the volume of particles present below 75 µm. The mass loss of the sample and the phase transformations were identified through thermogravimetric analysis using Netzsch Thermogravimetric Analysis (TGA) instrument, model STA 449. A total 1 gm sample was taken, and the sample was subjected through thermal cycle up to 1000 °C with a closed heating environment in its crucible.
2.2.3 Physico-Chemical Surface Characterization
Infrared vibrational spectrum (FTIR) of iron ore pellet (iron powdered samples mixed with KBr) was recorded on Fourier Transform using Perkin Elmer Spectrum Version 10.5.3 in the range of 4000–400 cm−1, and different functional groups were recorded. Zeta potential measurements for − 75 µm particles were performed as a function of pH using Zeta Meter 3.0+. The pH of the suspension was adjusted by adding NaOH and HCl, and the potential was noted. The nitrogen adsorption–desorption isotherm of the sample was quantified with a Quanta-chrome Nova-3200e at liquid nitrogen temperature. Pre-treatment of the sample was carried out at 230 °C for 5 h under high vacuum, and the surface area was determined by Brunauer–Emmett–Teller (BET) equation. Adsorption isotherm curves were plotted and pore size distributions and porosity were determined. The acetone cleaned sample was oven-dried and then cooled to the atmospheric temperature before each contact angle measurement. A dangling droplet of 2 µml of distilled water at the end of I-shaped needle was carefully deposited on pellet and measurement was carried out by Kruss Tensiometer, model-K 100. The powdered sample was pressed to make a pellet of flattened surface and used for AFM study.
3 Results and Discussion
The analysis of various characterization tests with their impact on beneficiation process has been discussed in the following.
3.1 Size Distribution and Size-Wise Chemical Analysis
Feed size distribution indicates the degree of liberation at various size ranges, thus playing an important role in any operation in determining the optimum size for the separation process.
3.1.1 Size Distribution Curve
It can be visualized from Fig. 2 that this ore sample contains higher proportion of fines in comparison to the coarser fractions. From the size distribution curve, it has been found that the average particle size (i.e. d50) of the ore is 160 µm and 80% passing size of the material (by weight) is below 4000 µm. This implies that the sample may be subjected to fines beneficiation such as flotation [2] and flocculation (surface-based processes) and enhanced gravity separation, which will be further dictated by liberation study and microscopic study.

Size analysis curve
3.1.2 Chemical Analysis
Wet chemical analysis has been done to know (a) the proportion of specific elements in the materials, (b) characteristics of these elements (i.e. atomic number and atomic weight, (c) concentration of the elements in bulk and size ranges so as to decide the processing steps to be followed.
Iron, silica, alumina and loss of ignition of various size ranges have been determined using wet chemical analysis titration method, and the results are given in Table 1.
Table 1 acknowledges that the distribution of iron is maximum in the size range − 150 + 45 µm along with maximum iron percentage below 150 µm.
3.2 Macroscopic Observation Study and Specific Gravity
From the first hand observation, it seems that though the ore is reddish brown (likely to be hematite), it has considerable amount of yellow patches which may be goethite and limonite (goethite or altered goethite) component and the sample has adequate amount of earthy, massive, dusty dull grains. The complex nature of ore texture of the Barsua mine is due to the presence of some micro-structural and textural features like micro-folds, brecciated zones, micro-faults and micro-bands. This complex structure may be due to deformation, alteration and supergene processes, secondary process of leaching and enrichment of iron-bearing rocks due to structural and meteorological controls [8]. Hematite in this ore can be called of secondary origin and is a product of oxidation of original magnetite called as martite and the process is known as martitization. Some amount of unreplaced or poorly replaced parent rocks are found in ore body, bearing evidence of replacement/enrichment origin of the iron ore body [8]. On the basis of physical characteristics and mineralogical observations, the iron ore sample is found to be goethitic-lateritic ore. Less amount of iron ore samples are of hard massive type, while the majority of the sample is porous and powdery in nature. More amounts of fines can be generated during crushing and grinding which will be rich in Al2O3, due to presence of highly friable goethite, hematite and lateritic ore.
The average specific gravity is calculated as 4.3 g/cm−3. It denotes that the sample has adequate amount of goethitic and gangue content with respect to hematite, which will be ascertained by mineralogical analysis.
3.3 Liberation Study
The extent of liberation plays an important role in determining concentrate grades and recoveries obtainable from a process. The size-wise results of liberation of minerals are given in Table 2, Fig. 3 and Table 3.

Graphical representation of liberation study
Nearly 80% of liberation occurs at − 200 µm size range and as the size decreases towards finer fractions, the percentage of liberation also increases. In the size range − 100 + 75 µm, the percentage of interlocked particles present is higher, i.e. 15.32%, but in − 75 + 56 µm and − 56 µm, the percentage of interlocked particles are 7.02% and 4.43%, respectively. At − 75 µm size range, more than 90% liberation of particles are being observed along with maximum liberation of hematite particles. Hence, a beneficiation method with − 75 µm feed size can be opted for the upgradation of iron values and fines beneficiation process especially physico-chemical surface-based process is the most preferred beneficiation method. Hence, froth flotation process, a well known and established process, can be preferred for successful upgradation.
Fine intercalation and interlocking of iron-bearing minerals with clay and silicate minerals are prominently observed during grain counting and microscopic analysis. The sample will require fine grinding for liberation of valuable minerals, and hence, flotation is an effective, dynamic and most suggested method for upgradation of the iron fines under investigation.
3.4 XRD Analysis
It gives information about the phases present in any material from the interplanar distance (i.e. d spacing value) by the diffracted x-rays of the parallel layers of atoms within the crystal. The interplanar distance of XRD pattern of Barsua iron ore sample is mainly composed of oxy-hydroxide phases of iron with varying amounts of hydrated aluminium hydroxide and silicate/clay minerals like kaolinite and quartz (Fig. 4).

XRD analysis of sample
The major iron-bearing opaque minerals are hematite followed by goethite. Gibbsite is the aluminium-bearing hydroxide mineral, whereas the silicate minerals found are kaolinite and quartz. Goethite, limonite and gibbsite possess water within their structure. The cations in these molecules are trivalent in nature and have common chelation characteristics. Besides this, the bond distance between Fe–Fe and Al–Al is very small, i.e. 2.85 and 2.852 Å, respectively, [9,10,11]. Therefore, gibbsite and iron oxides show related complexation characteristics along with similar surface charge. Due to these reasons, the separation of gibbsite and iron oxide minerals by any surface active agents is quite challenging. So, surfactants, particularly developed for gibbsite, are the need of the hour for successful implementation of flotation in Indian iron ore industries [12].
3.5 Microscopic Image Analysis
On the basis of microscopic study (Fig. 5a–f), the particles have been categorized into (a) free hematite, (b) free vitreous goethite, (c) free earthy/ocherous goethite, (d) interlocked hematite-goethite, (e) free clay minerals (f) free Martite (g) locked hematite-clay (h) free gibbsite (i) interlocked gibbsite and iron minerals.

a–f Micro-photographs of sample
From the mineralogy, it is noticeable that the sample has two distinct types of valuable minerals, i.e. (1) predominantly crystalline hematite grains (fine to medium grained) carrying disseminated goethite inclusions and (2) micro-crystalline hematite particles intermixed with goethite, gibbsite and ferruginous clay. Goethite somehow replaces hematite and fills up the voids and fractures during weathering.
The occurrence of kaolinite is shown intimately in association with goethite, and liberated free quartz grains are also observed, which confirms presence of silica in the form of kaolinite and quartz. Colloform texture of the weathered goethite is observed in Fig. 5a. Predominant alumina contributing mineral is kaolinite and gibbsite, found intermixed with iron oxides (Fig. 5b). In Fig. 5c, patches of kaolinite and goethite in hematite grains and micro-platy hematite intercalated with clay minerals are prominently observed. Gibbsite and clay minerals are present as micro-crystalline to cryptocrystalline aggregates and are intermixed with other associated minerals. Majority of the kaolinite grains are embedded with iron oxide/hydroxide minerals as shown in Fig. 5d.
Figure 5d also shows martitization which denotes the conversion (oxidation) of magnetite to hematite and hematite appears to be martitized. The kaolinite also occurs as patches in hematite and goethite granules which may have resulted due to the leaching out of pre-existing minerals. Kaolinite is observed in very finer size ranges (15–25 µm) and occurs in association with goethitic intercalations along the bands.
In Fig. 5e, f, clay and quartz inclusion in goethite and hematite grains is being observed, which will pose difficulties during liberation and also in resultant beneficiation process.
Most of the quartz grains also carry very fine inclusions of hematite. Hence, the production of a high grade concentrate with a high recovery is a difficult proposition.
High aluminium content is observed in goethite, mainly in earthy goethite and also in goethite, alumina-bearing minerals being more friable than the other minerals in the sample; will contribute more to the production of fines. Furthermore, goethite exhibits secondary colloform texture in cavities along the weaker bedding planes and its removal inside the micro-pores of the martitic hematite will pose problems during processing. These particles increase the specific surface area of the concentrates, and hence, difficulties in successful upgradation are ascertained.
As the microscopic study indicates the fine grinding of the sample for proper liberation, fines beneficiation method is necessitated, with flotation as the best choice.
3.6 FE-SEM with EDX Analysis
FE-SEM study will give rise to surface appearance, surface morphology, thickness, shape of different particles, whereas EDS analysis can show the elemental composition with respect to the selected points.
FE-SEM analysis shows that it is a goethite-rich surface and along with goethite, hematite and martite are present as iron-bearing minerals. From the mineralogy, two distinct types of valuable minerals are evident, i.e. (1) predominantly crystalline hematite grains having euhydral and subhydral structure (fine to medium grained) with disseminated inclusions of quartz and kaolinite (Fig. 6a) and (2) association of micro-crystalline hematite particles with micro-crystalline goethite and gibbsite (Fig. 6b). SEM observation of the present sample indicates that goethite is formed as a weathering product under oxidizing conditions, which is in agreement with the previous literature [12].

a–d FE-SEM images showing different composition and morphologies
Distinguished cracks, coarse grained and fine grained Fe-bearing minerals are found (Fig. 6c, d) along with inclusion of ferruginous clay on their active surface. Iron-bearing minerals present are fully or partially weathered, resulting in substitution of clay in iron mineral grains. The aluminous clay particles are intricately associated with iron minerals, and the clay exhibits a bookish structure which is clearly visible in Fig. 6c, which possesses difficulty in separation. The presence of porous surface (Fig. 6b, d), denotes substitution of goethite due to weathering. Kaolinite, gibbsite and quartz are the major gangue bearing minerals.
The respective sample, predominantly consisting of fines, will be economically challenging to beneficiate, due to complex interlocking pattern. Most of the weathered grains are flaky, friable and spongy in nature due to removal of interstitial silica while the hard and tough grains are because they could have escaped the intense chemical weathering that has leached out the matrix material (mainly the gangue minerals). The “book structure” of clay particles covering the surface of hematite will make hematite less selective for the collector and flotation response will be comparatively less in this case.
3.6.1 EDX Analysis
Along with the presence of iron oxide minerals in spacious amount, silicon oxide and aluminium oxides are present in moderate amount, whereas calcium, potassium and titanium are present in traces. Irregular patches, thin films of minute crystals of kaolinite and silicate grains are present as inclusions within hematite.
The texture and morphology study confirms fine intergrowth of botryoidal, micro-porous and earthy varieties of goethite in martitic hematite. EDX reveals that the earth-like goethite has low iron content along with Al2O3 (2–11%) and SiO2 (2–10%) contents, as can be seen from the microanalysis tables associated with the photomicrographs (Fig. 7a, b). The term earth-like goethite has been defined considering the morphology (earth-like appearance) and can be classified as intergranular and intragranular goethite, according to its textural mode of occurrence and chemical composition.

a, b Represents EDX elemental analysis
3.7 Particle Size Distribution of − 75 µm
Figure 8 denotes that most of the particles lie in the range between 1 and 100 µm. The sample has adequate amount of slimes and ultrafines, which will hinder the flotation process by slime coating and entrainment of fine particles and hence need specific attention.

Particle size distribution curve
The surface property of iron ore powders is mainly governed by two aspects: surface morphology and wettability. Surface morphology is attributed by roughness and the shape of the particle, which can be obtained by comparing the specific surface area measured with the laser diffraction method and the surface area measured with liquid nitrogen absorption method [13], whereas wettability can be obtained by contact angle measurement.
The surface area measured by laser diffracted particle size analyser is 0.576 m2/g, uniformity of sample is 0.721, surface weighted mean is 10.412 µm, volume weighted mean is 25.563 µm, and d(50) of the sample calculated is 20.648 µm. Other calculations and comparison related to surface area have been discussed in later part of this paper.
3.8 TGA-DTA Analysis
TGA analysis determines the humidity, thermal stability of material and helps in examining the gasification process, corrosion studies and kinetic process occurring during the elevation of temperature. The TGA analysis highlights weight changes at different temperature ranges, which correlate with the removal of physically adsorbed and structurally bonded water in the sample. It further emphasizes the occurrence of phase transformations. The − 75 µm sample (bulk sample ground to − 75 µm) has been taken for the analysis, and the sample is subjected through thermal cycle up to 1000 °C (Fig. 9).

TG-DT analysis curve
An endothermic effect is observed below 800 °C which depends directly on the weight loss of the sample due to the removal of physically adsorbed and structurally bonded water.
The ore shows a slight weight gain of 1%, mainly above 850 °C, caused by oxidation of magnetite (martitized) present in the ore. The ore lose approximately 7% weight over the temperature range 50–500 °C, with a rapid weight loss occurring between 250 and 500 °C due to the decomposition of hydrates and dehydroxylation of goethite. The weight loss below 200 °C of the TG plot (Fig. 9) indicates loss of surfacial water and the adsorbed water while the weight loss around 400 °C is due to the dehydration (loss of structural water) of goethite, the weight loss between 400 and 850 °C is due to the dehydration of kaolinite and weight loss above 850 °C is due to that of hematite transformation. The weight loss observed from TG analysis correlates well with that of the chemical analysis results of LOI.
The DTA curve for the sample shows endotherm peaks at 580 °C and 890 °C possibly associated with the quartz and silicates and extrapolated onsets. An exotherm at 910 °C indicates the weight gain as a result of oxidation. Differential thermal analysis (Fig. 9) shows two exothermic reactions which are caused by oxidation of ferrous iron. The first reaction is caused by the oxidation of Fe2+ on the surface of the particles resulting in the formation of a protective film of Fe2O3 around the particles. The second reaction is caused by the oxidation of the remaining magnetite hematite/martite, which may be due to diffusion of oxygen into the magnetite structure after the conversion of protective film of Fe2O3 into a porous one, by recrystallisation of the Fe2O3 at higher temperatures. However, the most important factor governing the second oxidation reaction is that, the process of diffusion of oxygen into the lattice is promoted when transition from ferromagnetism to para-magnetism takes place.
3.9 FTIR Analysis
Barsua iron ore fines contain the OH stretching (νOH) and HOH bending (δOH) vibrational bands at 3417–3695 cm−1 and 1631–1635 cm−1 (Fig. 10). These bands are reported for surface hydroxyl groups in pure iron oxides [14, 15]. The FTIR absorption profile of the sample shows peaks at 469, 538 cm−1, corresponding to quartz. The hematite peaks appear near 912 cm−1. The spectrum shows that the bands above 3400 cm−1 is due to the presence of absorbed water and is due to OH group coupling with the minerals. Kaolinite is also present in this sample, which is identified by the presence of bands at 1032 cm−1 (Si–O–Si) and 800 cm−1 (Al–O–H). The OH bending bands at 997 cm−1, vibrating in and out, respectively, are an important diagnostic band and also are a characteristic of crystallinity as well as the extent of Al substitution in the goethite structure [16, 17]. This FTIR analysis is in good compatibility of observance with the XRD analysis (Sect. 3.4).

FTIR spectrum of Barsua fines
The metal hydroxide groups are supposed to be polarizing protons with the hydroxyl groups of polymer, and these hydroxyl sites are expected to play vital roles in forming complexes with polymer hydroxyl groups, as metal ion sites act as scavengers, neutralizing the protons.
3.10 Zeta Potential Analysis
Mineral floatability is completely affected by mineral structure and its surface composition; hence, pH of formation of metal hydroxyl group plays a great role in the flotation process. The complexity of flotation process is due to the effect of impurities (trace elements) present on the mineral surfaces. The interdependence of flotation behaviour of minerals and the electrochemistry has been widely studied during the last decades [18].
Reagent adsorption and the subsequent flotation efficiency of an ore are greatly influenced by the mineralogical association of that ore. Iso-electric point of the present sample is at pH 5.9 (Fig. 11).

Zeta potential curve
The pH region where maximum surface hydroxylation is observed, zeta potentials are shifted to negative potentials (–OH/2H2O). By virtue of this, reverse flotation of hematite can be carried out at pH > 9, hematite surface turns to more hydrophilic at higher pH. In this regard, the role of polysaccharide is considered significant.
The explanation for these results is mineral heterogeneity, i.e. the presence of fine gangue particles along with hematite exert its influence on the surface properties of the feed sample. Most of those impurities present in micro-porous sites, exhibiting negative charges, are unreachable by large collector molecules and also goethite possessing maximum negative surface charge will be difficult to be properly hydrophobicized.
3.11 Atomic Force Microscopy Analysis
Processes such as adsorption of surfactants and macromolecules can alter the interfacial behaviour of the solids markedly. By atomic force microscopy (AFM), a proper knowledge about surface topography with three-dimensional images at a lateral resolution of a few nanometres and a vertical resolution on the sub-nanometre scale can be gained. Thus, particle physical properties can be extracted and volume, specific surface area as well as specific edge surface area of each particle can be calculated [19].
The three-dimensional micro-topography of sample, in Fig. 12 and Table 4 reveals that the surface is non-uniform with mean height of roughness profile as 137 nm. There are deep cracks and edges observed on the surface, which denotes that the reagents can get adsorbed on these micro-pores. The average peak height observed is 64.3 nm, and average maximum depth observed is − 48.7 nm; thus, the iron ore surface, especially smooth and plain surfaces will be partially covered with monolayer, and the voids and cracks upon the surface will be covered with a bi-layer along with the formation of a second layer on a previously reagent covered surface. Upon the peaks, pillars and crest regions, there is very less collector adsorption while in the troughs and depths regions, excessive collector dosages will form more than one layer on the previously formed layer, thus minimizing the depths.

a 2-D image of surface and b 3-D image of surface
3.12 BET Surface Area and Porosity Measurement
According to some scientific studies [20, 21], chemical composition and surface properties of mineral are perquisite for the formation of monolayer to acquire required hydrophobicity and to improvise flotation process to a substantial level. The hysteresis of adsorption and desorption isotherm is evaluated by quantifying the volume of adsorbed gas in meso- and micro-pores and analysing the isotherms at low partial pressure.
Figure 13 signifies that the sample shows typical type II adsorption isotherm which attributes the micro-porous materials of non-uniform texture. This is in good agreement with the existing literature, as these types of isotherms are specific for iron and alumina-bearing minerals. The specific surface area measured for − 75 µm sample is 99.621 m2/g, total pore volume is 1.248e−01 cc/g and pore radius Dv(r) calculated is 19.067 Å (Figs. 13, 14) which indicates that the sample is porous in nature.

Pore size distribution of sample

Surface area measurement of sample
Surfactant adsorption on hematite surface may occur in two stages either apparently or on a sequential basis. Isolated hydroxyl groups initially get adsorbed upon the surface (up to a surface coverage of approximately 30%). Likewise collector adsorption arises in pore sites (after achieving 30% surface coverage by the collector and thereafter adsorption in pores). The second mechanism may not fully work as the sample is not very highly porous. From, the adsorption and desorption graphs, it is obvious about multilayer adsorption of collector, and therefore, optimum dosages should be chosen accordingly.
3.12.1 Comparison of Specific Surface Area of BET, AFM and Laser Diffraction PSA
It is presumed in the surface area calculation by laser diffraction method is that all the particles are fully dense smooth spheres; however, real ore particles are of irregular shapes and are never smooth spheres. The specific surface area measured by BET method is comparatively larger than that measured by laser diffraction technique. Thus, the ratio of SBET to SLS can characterize the surface roughness of iron particles because of the fact that the roughness of the particle influences the specific surface area apparently, ultimately affecting the surfactant adsorption process.
Surface roughness is due to fluctuations around a solid surface, which plays a vital role in subsequent processes. Grinding in the mills causes main changes in surface roughness of particles, which influence their response to flotation. Surface roughness and the shape of the iron ore are qualitatively analysed by SEM and microscopic photographs and quantitatively analysed by ratio of SBET/SLS. Further, the wettability of the sample is characterized by contact angle measurement, which has been discussed in the later part of the paper.
AFM surface area measurement is in well coordination with gas adsorption results for this sample. BET SSA value is lower than AFM specific surface area because of the observed discrepancies between BET and AFM methodology, mainly the outgassing temperature of BET.
We have analysed that the external BET surface area of 99.621 m2/g (excluding the micro-pores) is appropriate for comparison with specific surface area by AFM and laser diffraction technique. Thus, BET SSA value is significantly lower than the surface area obtained by AFM, but higher than that of PSA. The fine particles having imperfect crystallization, increased cracks dislocation and edges as observed from SEM, can lead to problem during flotation by more adsorption of reagents, increased hydration, rapid surface reaction, increased solubility, slime coating of ultrafine gangue particles on the valuable particles and rigidity of the froth.
3.13 Contact Angle Measurement
In this study, wettability of ores is measured by the contact angle between iron ore and water while the surface roughness and shape of iron ore have been characterized by the ratio of SBET to SLS and FE-SEM analysis (already discussed).
It has been already described that hematite turns to be more hydrophilic at basic pH due to hydroxylation of the surface [22] and even at natural pH also, slow hydroxylation of the iron oxide surface takes place, with the contact angle being reduced. Goethite, representative of the fully hydroxylated state of hematite, has low contact angles at all pH values. Hence, the hydrophobic/hydrophilic balance requires mineral phase identification and the major species contributing to surface layers [23].
The difference between the advancing (largest contact angle of the system) contact angle (Θa) and receding (smallest contact angle of the system) contact angle (Θb), known as the contact angle hysteresis, is measured for the receding liquid font [24].
The contact angle hysteresis is a good parameter to describe the quality of surfaces examined such as surface roughness, chemical heterogeneities, surface deformation, liquid adsorption and retention, molecular rearrangement on wetting and inter diffusion [23].
The advancing and receding contact angles have been noted using the sessile-drop technique for a drop volume of 2 µml at different time intervals. Low contact angles result unstable drop shape due to fast penetration, and air trapping results in fast liquid spreading.
A much higher hysteresis is being noticed in case of porous and rough compact surfaces due to apparent contact angle. The apparent contact angle of a real surface falls in the range between the advancing (largest) and receding (smallest) contact angle (Fig. 15(a, b)).

a Advancing and b receding contact angle
The low contact angle of the sample (Fig. 16) is due to presence of aluminous and siliceous impurities, which will hinder the flotation process, else proper reagent regimes is chosen.

Contact angle hysteresis of Barsua iron fines
4 Summary: Implications on Beneficiation
-
In-depth mineralogical and peterographic investigations are important before ore processing due to variation in mineralogy and mode of occurrence and association of value and gangue minerals. Presence of gangue minerals and their interrelationship with iron oxides need special attention. The present work highlights the importance of comprehensive characterization of the ore for essential process selection.
-
For selection of an appropriate processing strategy, knowledge and understanding of the mineralogical and geochemical nature of ore is very much essential. Thus, a detailed characterization of the ore and beneficiation process strategy needs the eye of a mineralogist and mind of a mineral processing engineer.
-
Flotation, being the preferred fines processing option, has to be chosen for the upgradation of low grade Barsua iron fines. Hence, adsorption potential of a reagent on the mineral surface is critically important. Reagent adsorption in aqueous media is controlled by the charge of active ion of surfactant, molecular weight, properties of solvent, solution conditions (pH, ionic strength) and porosity of the substrate. A relatively high covered fraction of surface area is required to obtain good iron oxide flotation.
-
BET is the most predictable method for specific surface area measurement; however, time required to measure is impractically long; however, LD-PSA provides an efficient measurement of particle size distribution within 30 min. By comparing these two methods, the conclusion can be drawn that BET surface area is 3 times larger, which suggests that 1 nm liquid nitrogen molecules can reach the places on the particle surface, which are unreachable by the laser light of wavelength 450. LD is unable to measure particle size smaller than 0.4 micron; thus, surface of such smaller sized particles is not taken into account in the LD surface area. The samples have been analysed to compare the fineness measured by laser diffraction PSA and BET surface area analyser. The BET provides the most practical surface area measurement and also no limitation and assumption about the particles’ surface texture and size ranges. Real ore fines are not spherical, which must be kept in mind while interpreting the specific surface area measurements.
-
Quartz, as silicate mineral, will cause less hindrance during the flotation of iron ore, whereas the clay minerals will inhibit and hinder the flotation response of iron ore. The scanning electron microscopic (SEM) studies indicate that due to maximum coverage of hematite surface by clay particles, collector will be less selective for interaction. Washing and desliming prior to flotation are advantageous.
-
Since the sample contains the gibbsitic alumina in finer size range, its direct flotation will be quite challenging. It can be predicted that due to the fineness of the ore coupled with complex mineralogy and intricate association, it will be very tough to obtain an acceptable concentrate through the direct flotation of hematite, if the reagents are not chosen intelligently.
4.1 Suggested Beneficiation Schemes
-
Based on the characteristics of the sample under study, the valuable flow schemes for its beneficiation envisaged are presented in the following:
Case 1

Jigs and heavy media cyclones can be used at the cost of poor yield because of complex mineralogical distribution.
Case 2
The sample is composed of magnetite/hematite with coarse grained gangue minerals (alumina and silica mineralization is not too fine).

Similar ore types were studied and beneficiated but even after magnetic separation also, the ore could not yield satisfactory grade and recovery, and hence, flotation route was opted and better results were achieved [25, 26].
So, both direct and reverse flotation route can be tried with proper selective reagents and comparison of results will define which process will work better for the sample having similar nature.

From the characterization studies, it has been analysed that the value and gangue minerals are intricately associated due to extreme fineness of the sample. Enrichment of the coarser fraction with valuable iron content and removal of ultrafine gangue materials to reduce the interference of gangue particles are expected by classification. Reverse flotation of deslimed product can upgrade the Fe value up to 65% which can be directly used for downstream process. According to the management strategy and economical compliance, beneficiation by selective flotation process can be the main value upgradation step in iron ore beneficiation process.
In case of this lateritic iron ore, the iron occurs mainly in oxy-hydroxy form interlocked with gangue minerals. The ore must be upgraded after attainment of proper liberation. Therefore, simple gravity and magnetic separation will not be much effective.
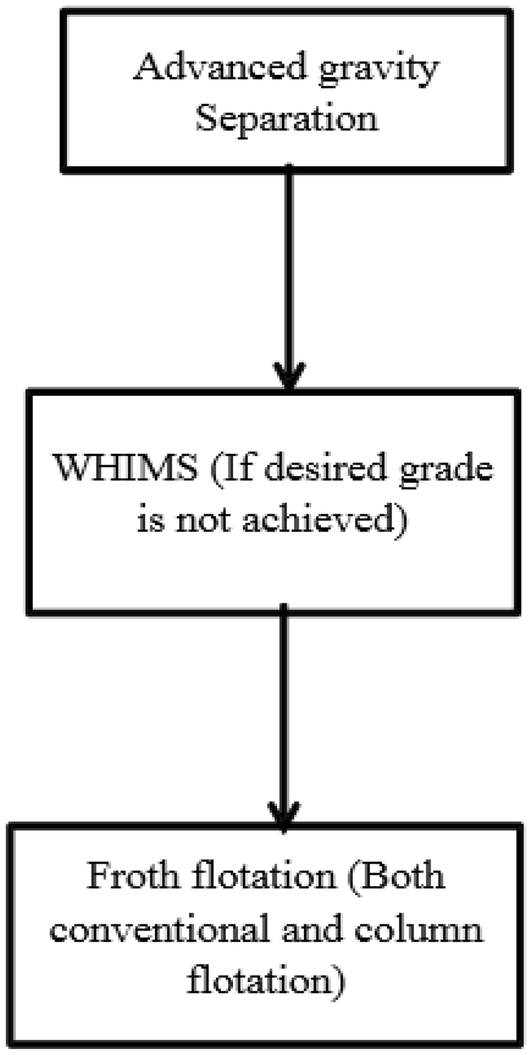

Silica is present as quartz and alumina is mostly contributed by kaolinite, which is also a silicate mineral; hence, flotation in general and column flotation in particular seems to be more effective. As these are present as very fine inclusions, chances for successful implementation of reverse flotation are more.
4.2 Validation of the Flow Schemes
-
1.
Preliminary experiments using Reverse Flotation Route
Hexadecyl trimethyl ammonium bromide (CH3(CH2)15N(Br)(CH3)3) was used as collector, whereas potato starch was used to depress the iron-bearing minerals and sodium meta-silicate (Na2.SiO3) and MIBC (methyl isobutyl carbinol) were used as dispersant and frother, respectively. NaOH was used to maintain the required basicity of the pulp. The reagent dosage ranges are given in Table 5. The subsequent portion of this part has been published as a peer reviewed paper [29].
Fe value has been upgraded to 64% by reverse flotation route which can be directly used as feed material for blast furnace (Table 6).
- 2.
Preliminary experiments using Direct Flotation Route
Oleic acid (C18H34O2) was used as collector, sodium meta-silicate (Na2.SiO3) and MIBC (methyl isobutyl carbinol) were used as dispersant and frother. NaOH and HCl were used as pH regulators. The reagent range variables are given in Table 7.
The concentrates were collected at different time intervals. So, best concentrate grade at 45 s of all experiments have been reproduced in Table 8.
Beneficiation by selective flotation process has added a lot of value in successful implementation of flotation by overcoming all the complicacy in distribution of mineralogy.
5 Conclusion
From the characterization studies, high complexity of mineralogical association and poor liberation with intimate association of value and gangue minerals are observed. The goal of the suggested beneficiation flow schemes is to recover iron values having blast furnace metallurgical grade, i.e. low alumina and silica with high Fe%, i.e. more than 63%. Desliming is indispensable before flotation to remove ultra-fine gangue particles and to enhance iron values. Flotation results indicate that it is possible to achieve high grade iron concentrate along with lower silica and alumina content meeting the requirement of blast furnace burden material.
References
Patra S, Pattanaik A, Venkatesh A S, and Rayasam V, J Geol Soc India93 (2019) 443.
Quoicoe I, Nosrati A, Skinner W, and Mensah A J, Chem Eng Sci98 (2013) 40.
Das B, Mishra B K, and Prakash S, Int J Miner Metall Mater17 (2010) 675.
Dash D, Pradhan S S, and Jena M S, J Soc Geosci Allied Technol (SGAT Bull) 13 (2012) 114.
Indian Mineral Year Book, Indian Bureau of Mines, Nagpur (2017).
Vidyadhar A, Singh A K, Srivastava A, Nayak B, Rao K V, and Das A, in Proceedings of the XI international seminar on mineral processing technology, Jamshedpur (2010), p 583.
Jena M S, Sahu P, and Pradhan S S, Ann Tech J Inst Eng (India) Odisha State Centre56 (2015) 246.
Nayak N P, Int J Eng Innov Technol (IJEIT)3 (2103) 109.
Rath S S, Sahoo H, Das B, and Mishra B K, Miner Eng69 (2014) 57.
Sahoo H, Rath S S, and Das B, Sep Purif Technol136 (2014) 66.
Pattanaik A, and Rayasam V, Colloid Interf Sci Commun25 (2018) 41.
Klein C, and Hurlbut Jr C S, Manual of Mineralogy, 20th ed., Wiley, New York (1985).
Lv X, Huang X, Yin J, and Bai C, ISIJ Int51 (2011) 1432.
Hair M L, J Non-Cryst Solids19 (1975) 299.
Verdonck L, Hoste S, Roelandt F F, and Van der Kelen G P, J Mol Struct79 (1982) 273.
Gadsden J A, Infrared Spectra of Minerals and Related Inorganic Compounds. Butterworths, London (1975).
Cornell R, and Schwertmann U, The Iron Oxides: Structure, Properties, Reactions, Occurrences and Uses (2003).
Subramanyan T V, and Natarajan K A, Trans Indian Inst Met41 (1988) 255.
Bickmore B R, Nagy K L, Sandlin P E, and Crater T S, Am Miner87 (2002) 780.
Montes S, and Montes-Atenas G, Miner Eng18 (2005) 1032.
Cases J M, and Villieras F, Langmuir8 (1992) 1251.
Iveson S, Holt S, and Biggs S, Int J Miner Process74 (2004) 281.
Smart R S C, Amarantidis J, Skinner W M, Prestidge C A, La Vanier, Grano S R, Top Appl Phys85 (2003) 3.
Joanny J F, and De Gennes P G, J Chem Phys81 (1984) 552.
Mishra B K, Reddy P S R, Das B, Biswal S K, Prakash S, and Das S K, November issue, Steel World (2007), p 34.
Patra S, Pattanaik A, Rayasam V, Can Metall Q58 (2019) 28.
Thella J S, Mukherjee A S, and Srikakulapu N G, Powder Technol217 (2012) 18.
Dowling E C, Hebbard J, Eisele T C, and Kawatra S K, Proceedings of the XX1 International Mineral Processing Congress, Massaci ed., Elsevier (2000), p 163.
Pattanaik A, and Venugopal R, Adv Powder Technol29 (2018) 3404.
Acknowledgements
The authors are thankful to Dr. M.K. Mohanta, principal scientist, NML-Jamshedpur for his help and support during mineralogical studies and the Central Research Facility of IIT(ISM), Dhanbad, for their support and coordination for the work.
Author information
Authors and Affiliations
Corresponding author
Ethics declarations
Conflict of interest
The authors declare that they have no conflict of interests.
Additional information
Publisher's Note
Springer Nature remains neutral with regard to jurisdictional claims in published maps and institutional affiliations.
Rights and permissions
About this article

Cite this article
Pattanaik, A., Patra, S. & Rayasam, V. Selection of a Viable Upgradation Strategy Through Physico-chemical and Mineralogical Approach: A Case Study of Low Grade Barsua Iron Ore Fines. Trans Indian Inst Met 73, 47–63 (2020). https://doi.org/10.1007/s12666-019-01802-0
Received:
Accepted:
Published:
Issue Date:
DOI: https://doi.org/10.1007/s12666-019-01802-0