
Abstract
Introduction
Amidst a changing treatment landscape, real-world evidence on the burden of chronic lymphocytic leukemia (CLL) is limited. The purpose of this study was to describe treatment patterns, adverse events (AEs), and economic burden among treated patients with CLL.
Methods
A retrospective cohort study was conducted with IQVIA PharMetrics® Plus. Patients at least 18 years old with CLL treatment between November 1, 2013 and May 31, 2018 were identified; index date was first observed CLL treatment. Patients had at least one CLL diagnosis pre-index and a second diagnosis anytime during the study period, at least 1-year pre- and at least 30-day post-index continuous enrollment and no pre-index CLL treatment. Analyses focused on patients receiving one of the four most common regimens observed. Outcomes included treatment patterns, frequency of incident AEs, and healthcare resource use and costs. Multivariable logistic regression and generalized linear modelling were used to evaluate risk of hospitalization and all-cause costs per patient per month (PPPM).
Results
A total of 1706 patients were included in the study (median [interquartile range] age 58 [55–62] years, 66% male, median Charlson Comorbidity Index 2 [2–3], median follow-up 16 [8–28] months). Common regimens, irrespective of treatment line, were bendamustine–rituximab (B-R, 27%), ibrutinib monotherapy (I, 27%), rituximab monotherapy (R, 19%), and fludarabine combined with cyclophosphamide and rituximab (FCR, 16%); 59% had at least one incident AE (B-R, 62%; I, 60%; R, 25%; FCR, 79%). Mean total all-cause healthcare cost over follow-up was $13,858 ± 14,626 PPPM. Increased number of AEs was associated with increased odds of hospitalization (odds ratio = 2.9; 95% confidence interval [CI] 2.5–3.4) and increased mean cost PPPM (cost ratio = 1.2; 95% CI 1.1–1.2).
Conclusion
This study highlights the treatment toxicity and associated economic burden among patients with CLL in the USA. As novel therapies are increasingly used, further research examining outcomes will inform the risks, benefits, and value of novel agents to prescribers and patients.
Why carry out this study? |
There are approximately 21,000 new cases of chronic lymphocytic leukemia (CLL) in the USA each year. |
While there is no cure for CLL, the CLL treatment landscape has evolved over the last decade with the development of promising targeted drugs. These novel therapies are increasing available and used, but evidence of treatment toxicity, associated healthcare resource use, and costs among patients with CLL receiving these treatments is limited. Further real-world evidence on the burden of novel and conventional therapies for CLL is crucial to patients and healthcare providers as they decide on an appropriate treatment plan. |
The purpose of this retrospective observational study was to describe real-world treatment patterns in a large cohort of commercially insured, younger patients with CLL in the USA. The study also described treatment-related toxicity, healthcare resource use (HRU), and costs. |
What was learned from the study? |
This study highlighted the current, commonly used CLL treatments among younger patients with CLL in the USA, as well as the associated clinical and economic burden. |
In this study, the most common regimens observed among treated patients with CLL were bendamustine–rituximab (27%), ibrutinib monotherapy (27%), rituximab monotherapy (19%), and fludarabine combined with cyclophosphamide and rituximab (16%); more than half of treated patients (59%) had evidence of at least one incident adverse event (AE). |
The economic burden among patients with CLL was substantial and driven by treatment costs. Patients with AE(s) had additional clinical and economic burden from treatment-related toxicities. |
HRU and costs consistently increased as the number of AEs increased, suggesting a potential association between greater treatment toxicity and higher HRU; results persisted in adjusted analyses. |
Introduction
Chronic lymphocytic leukemia (CLL), a disorder of malignant B cells, is characterized by a heterogeneous clinical course and has recently been reclassified as a type of lymphoma. An estimated 21,000 new cases of CLL are diagnosed in the USA each year [1]. CLL is primarily diagnosed in older individuals, with an average age of 68 years at diagnosis [2]. The prognosis has improved in recent years, with the 5-year overall survival increasing from 60% in 2000–2004 to 84% based on data from 2008–2014, due to newer therapeutic approaches such as chemoimmunotherapy combinations [3,4,5].
The CLL treatment landscape has evolved significantly over the last few decades, first with the introduction of immunomodulating agents and CD20 (e.g., rituximab, obinutuzumab, and ofatumumab) and CD52 (e.g., alemtuzumab) monoclonal antibodies, which led to expanded therapeutic options with chemoimmunotherapy regimens, and more recently, with the development of small molecule inhibitors targeting several critical signaling pathways such as ibrutinib, a selective Bruton tyrosine kinase (BTK) inhibitor, and venetoclax, a selective B cell lymphoma/leukemia 2 (BCL2) inhibitor [6, 7]. Ibrutinib was first approved by the USA Food and Drug Administration (FDA) in 2014 for the treatment of patients with CLL who have received at least one prior treatment; approval was expanded that same year to those who have chromosomal 17p deletion or del(17p) [8]. Two years later, approval was expanded to the first-line setting, regardless of chromosome 17p deletion status [8]. Venetoclax was first approved by the FDA in 2016 for the treatment of CLL with del(17p); approval was expanded in 2018 to patients with CLL and at least one prior therapy, regardless of chromosome 17p deletion status, for use in combination with rituximab [9].
The National Comprehensive Cancer Network Clinical Practice Guidelines in Oncology (NCCN guidelines®) for CLL from 2014 to 2018 (time period relevant for the present study) [6, 7] provide treatment options based on patient’s age, comorbidities, and performance status, as well as the presence or absence of del(17p) (or TP53 mutations, as first mentioned in the 2017 version). If del(17p) or TP53 mutation is present, a clinical trial is recommended for all patients, and the preferred treatment among agents with a label in CLL is ibrutinib for both untreated patients and relapsed/refractory patients. If both del(17p) and TP53 mutation are absent, obinutuzumab with chlorambucil is recommended as a preferred first-line treatment for older or frail patients and fludarabine-based chemoimmunotherapy (e.g., fludarabine combined with cyclophosphamide and rituximab [FCR]) for younger, healthier patients. For relapsed/refractory patients without del(17p)/TP53, ibrutinib with or without rituximab is the preferred treatment; other options include idelalisib, venetoclax, or chemoimmunotherapy.
Given that more intensive therapies and novel agents are used to treat CLL today, treatment-related toxicity profiles should be considered when developing a treatment plan. The decision to undergo intensive treatment should balance the trade-offs between efficacy and tolerability. Recently approved BTK inhibitors have unique adverse event (AE) profiles, with a real-world study of patients with CLL who discontinued ibrutinib or idelalisib reporting that toxicity was the most common reason for discontinuation (reported in more than half of patients) [10]. Of particular concern is the risk of cardiac events, such as atrial fibrillation (AF), observed in 10% of patients with CLL newly treated with ibrutinib in a real-world study [11], 5% of patients with previously treated relapsed or refractory CLL in the RESONATE trial [12], and 17% of older patients with untreated CLL in the Alliance trial [13]. The rates reported here are for AF of any grade for all three studies. Most clinical trials investigating ibrutinib regimens have excluded patients with CLL under 65 years old (i.e., excluded in RESONATE-2 [14] and Alliance [13]); therefore, the data on ibrutinib-treated patients with CLL younger than 65 years of age is limited (e.g., included in one study, ECOG-E1912 [15]). Further research is needed to assess treatment toxicity, as well as associated healthcare resource use (HRU) and costs in the real-world setting, particularly among patients younger than 65 years of age who have not been included in most clinical trials to date.
Research on the association of treatment toxicity, HRU, and costs among patients treated for CLL is limited. To that end, real-world evidence on the burden of novel and conventional therapies for CLL is important to help guide treatment planning. The primary focus of this retrospective observational study was to describe treatment patterns in a real-world setting. This study also described treatment-related toxicity, HRU, and costs in a large cohort of treated patients with CLL.
Methods
This retrospective cohort study utilized patient data from IQVIA PharMetrics® Plus database from November 1, 2012 through June 30, 2018. This database is comprised of fully adjudicated medical and pharmacy claims for more than 150 million unique commercially insured enrollees across the USA, with data from 90% of US hospitals and 80% of all US doctors. Owing to the broad reach of these data, records in the database are representative of the commercially insured US national population for patients under 65 years of age. All data are Health Insurance Portability and Accountability Act (HIPAA) compliant to protect patient privacy and, therefore, institutional review board approval was not required for this study.
Adult patients (at least 18 years old) who had at least one claim for a CLL treatment (defined on the basis of the NCCN guidelines [16] and expert opinion reported in Supplemental Table 1) between November 1, 2013 and May 31, 2018 were identified. The first date of treatment was defined as the index date. Patients were required to have at least one diagnosis of CLL (International Classification of Diseases, Ninth Revision, Clinical Modification [ICD-9-CM] code 204.1x or ICD-10-CM code C91.1x, C83.0x) before index and at least one diagnosis anytime during the study period, at least 12 months of continuous enrollment prior to the index date (variable baseline period), and at least 30 days of continuous enrollment after the index date (variable follow-up period) to be included in the study. Patients with evidence of CLL-related treatment(s) any time before the index date (using all available look-back) were excluded. All inclusion and exclusion criteria are specified in Fig. 1.
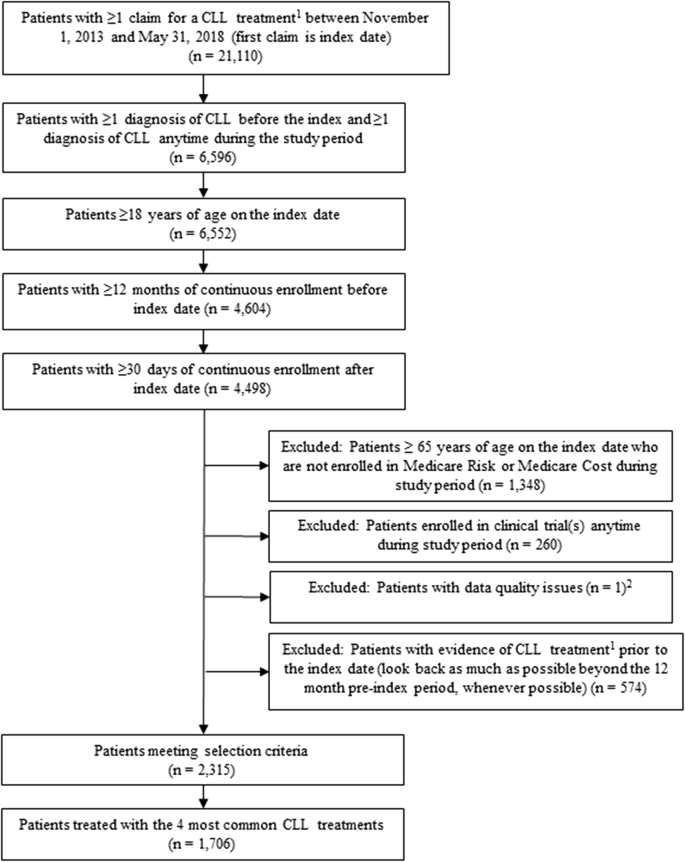
Patient attrition flowchart
After all treated patients with CLL were selected into the study, we categorized patients into treatment regimens. In an effort to focus the analysis on understanding treatment-related toxicity and associated HRU and costs for commonly used treatment regimens, we described only the four most common regimens observed. Patients who received one or more of these regimens at any point during follow-up (representing more than 75% of all treated patients with CLL in the study) were identified and included in the analysis.
The start of a treatment episode was defined as the first date of a CLL-related systemic treatment. The combination of all agents used in the first 35 days of the beginning of a treatment episode comprised a treatment regimen; product-specific drug and infusion administration codes (National Drug Codes [NDC] and Healthcare Common Procedure Coding System codes [HCPCS]) were used to identify treatments. Each treatment episode continued until a switch to a new regimen, modification of the starting regimen (addition and removal of rituximab was allowed, as this was expected in real-world clinical practice), discontinuation of the regimen, end of study follow-up, or end of continuous enrollment, whichever occurred first. When switching or modification of treatment occurred, the end date of the treatment episode was defined as 1 day before the start date of the next treatment episode. Discontinuation was defined as a gap of at least 60 days in treatment to be consistent with prior studies [17,18,19,20]. When discontinuation occurred, the end date was defined as 90 days after the last prescription was filled (for oral medications) or 30 days after the last infusion was administered (for non-oral medications). These definitions were implemented after review of the fill and administration data and validated with expert opinion. When systemic and oral treatments were used concomitantly, the end of the treatment episode was defined on the basis of the oral medication supply. Furthermore, patients receiving rituximab maintenance therapy were excluded since these patients may be in remission after using a prior rituximab-containing chemotherapy and are therefore not comparable to the other treatment groups. Rituximab maintenance therapy was defined as monotherapy with rituximab (with or without corticosteroids) starting at most 210 days (7 months) after the end of a rituximab-containing combination therapy and lasting fewer than 68 days, or when the count of unique infusion days of rituximab divided by length of monotherapy with rituximab in days was at most 0.017 [21,22,23,24]. First, second, and third observed treatment episodes were identified and categorized as first-, second-, and third-line therapies.
Baseline demographic and clinical characteristics were measured during the 12-month pre-index period. Clinical characteristics included Charlson Comorbidity Index (CCI; based on 15 conditions using Dartmouth-Manitoba version, without malignancy or metastatic solid tumor [25]), AF risk status (based on risk factors present in the baseline period, calculated using Chyou et al.’s method [26]), daily pill burden (defined as the total quantity of pills [all-cause prescription medications] during the 30 days pre-index, divided by 30 days, among patients with at least one oral prescription for CLL-related treatments), and comorbidities (identified by at least one claim of pre-defined ICD-9-CM, ICD-10-CM, and/or HCPCS codes for each condition in the 12-month pre-index period). In addition, evidence of genetic testing, including testing of karyotype and fluorescence in situ hybridization (FISH) on the index date or within 90 days before the index date, was measured using current procedural terminology (CPT) codes; test results were not available in the data. All baseline measures were reported for all patients.
Outcomes were collected during the variable follow-up period (minimum 30 days). Our primary focus was treatment patterns including number and frequency of patients treated with the four most common treatment regimens by line of therapy. The frequency of incident AEs of interest during treated follow-up, time from treatment initiation to incident AF and hemorrhage/bleeding over the first treatment episode by regimen, and all-cause and CLL-related monthly HRU and costs per patient were also described. Patients were considered to have an incident AE (identified by ICD-9-CM, ICD-10-CM, and HCPCS codes) if they had at least one claim associated with an AE during a treatment episode with no evidence of that AE prior to the treatment initiation date. AEs of interest were selected on the basis of those that commonly occur among patients with CLL and those previously observed in clinical trials, package inserts, and expert clinical opinion [8, 13, 14]. For non-chronic symptoms and acute conditions that patients with CLL may experience before and after treatment initiation, such as infection and anemia, we additionally explored and reported the number and proportion of patients who had evidence of these conditions after treatment initiation, regardless of history of the same AE prior to treatment initiation. AF and hemorrhage/bleeding were of interest in this study given their associations with BTK inhibitors in controlled trials [10, 27] and the expected increase in use of ibrutinib over time [28,29,30]. CLL-related HRU and costs were defined as the subset of all medical claims with a diagnosis code for CLL in any position, or (pharmacy and medical) claims for CLL-related treatments. HRU and costs during follow-up were reported separately for patients by the number of unique AEs (0, 1–2, 3–5, and at least 6) and were categorized into hospitalizations, emergency department (ED) visits, outpatient visits, pharmacy, and other outpatient services (laboratory, ancillary [supplemental or auxiliary services to support the diagnosis and treatment of conditions such as diagnostic services, occupational therapy, and physical therapy], etc.). Healthcare costs were measured during the variable follow-up period using allowed amounts (negotiated rates between the plan and providers), reported as cost per patient per month (PPPM), and inflated to 2018 values using the Consumer Price Index.
All study measures were reported using frequencies and percentages for categorical variables and measures of central tendency (mean, median) and variability (standard deviation [SD], interquartile range [IQR]) for continuous variables. Kaplan–Meier survival analysis was used to compare the rate of occurrence of incident AF or hemorrhage/bleeding during the first treatment episode by regimen, and survival functions were compared using log-rank tests. Patients were censored at the end of the treatment episode, end of continuous enrollment, or end of study period, whichever occurred earliest. Hazard ratios (HRs) for the risks of AF and hemorrhage/bleeding were calculated using Cox proportional hazards models. A generalized linear model with a log link and a gamma family distribution of the dependent variable was used to evaluate all-cause healthcare cost PPPM, and multivariable logistic regression models were used to evaluate the predictors of hospitalization, and of AF and hemorrhage/bleeding in the first-line setting. Model covariates were baseline demographic and clinical characteristics: All of the models included age at index (continuous), geographical region, insurance plan type, CCI score (continuous), baseline AF risk status, baseline comorbidities and acute conditions (evidence of AF, hemorrhage/bleeding, infection, hypertension, arthralgia/myalgia, neutropenia, and anemia for the monthly cost and hospitalization models; evidence of infection, hypertension, anemia, fatigue/asthenia, and thrombocytopenia for the AF and hemorrhage/bleeding models), and treatment regimen; in the monthly cost and hospitalization models, number of incident AEs was additionally included. P values less than 0.05 were considered statistically significant. Analyses were conducted using SAS version 9.2 (SAS Institute, Inc, Cary, NC).
Results
Study Population Characteristics
Of the 2315 patients with CLL meeting the inclusion and exclusion criteria, 2182 patients had a drug-specific code and were able to be classified into a treatment regimen. The most common observed treatment regimens across all lines of therapy were B-R, ibrutinib monotherapy, rituximab monotherapy, and FCR. Of the 2182 patients, 1706 (78.2%) received at least one of these four CLL treatment regimens during follow-up and were included in the study (Fig. 1).
The mean ± SD age was 58.2 ± 7.4 years; 66.3% of patients were male (Table 1). The geographic distribution of patients was diverse with the most common region being the south (32.7%), followed by the midwest (28.7%) and the northeast (24.4%). Most patients were commercially insured (58.7%) or self-insured (31.2%). During the baseline period, the mean CCI score was 3.0 ± 1.6 (median 2.0 [2.0–3.0]); mean CCI score excluding cancer was 0.9 ± 1.3 (median 0.0 [0.0–1.0]); 21.6% of patients were classified as high risk of AF, and the mean number of pills taken daily was 3.6 ± 4.1 (median 2.4 [0.8–5.0]). The three most common comorbid conditions were hypertension (42.1%), fatigue or asthenia (27.4%), and thrombocytopenia (21.6%). Infection and anemia during the baseline period were also common, at 51.3% and 31.9%, respectively. During the 12 months before CLL treatment initiation, patients incurred a mean all-cause healthcare costs of $2709 ± 4458 PPPM. During the 90-day period before index (inclusive of the index date), 28.1% and 31.5% of patients had evidence of a karyotype test for CLL and a FISH test, respectively (Table 1).
Treatment Patterns
The overall mean length of follow-up after initiation of one of the four most common treatments was 19.3 ± 13.8 months (BR, 19.9 ± 14.3 months; ibrutinib, 17.2 ± 12.9 months; rituximab monotherapy, 18.6 ± 13.6 months; FCR, 20.4 ± 14.2 months). As previously noted, of the 2182 patients meeting the selection criteria, 78.2% (n = 1706) had at least one of the four most common CLL treatment regimens across all observed lines of therapy: B-R (n = 590), ibrutinib monotherapy (n = 578), rituximab monotherapy (n = 490), and FCR (n = 343). The treatments received by the remaining patients with CLL (21.8%) varied and included predominantly chemotherapy-based treatments (e.g., chlorambucil).
In the first-line setting (n = 2182), B-R was the most common regimen (24.0%), followed by ibrutinib monotherapy (19.7%), FCR (14.6%), and rituximab monotherapy (14.1%) (Fig. 2). There were 678 patients (31.1% of the 2182 patients) who had subsequent lines of therapy observed during the follow-up. In the second- and third-line settings (n = 678 and n = 232, respectively), ibrutinib was most common (21.4% and 26.3%), followed by rituximab monotherapy (16.2% and 11.6%); fewer patients received B-R (9.4% and 4.7%) and FCR (3.4% and 1.3%) (Fig. 2).

Proportion of patients treated with B-R, ibrutinib, rituximab monotherapy, or FCR (the four most common treatments) out of all patients classified into a treatment regimen by line of therapy
Treatment Toxicity
Overall, 58.7% of the patients receiving the four most common regimens regardless of observed line of therapy had at least one AE of interest during a treatment episode. The mean number of AEs per patient was 1.0 ± 1.2 (median 1.0; IQR 0.0–2.0). The most common incident AE, regardless of treatment regimen or line of therapy, was neutropenia (31.8%), followed by infection (10.6%), anemia (8.7%), and thrombocytopenia (8.2%). More patients had evidence of infection and anemia (34.8% and 28.3%, respectively) when not considering evidence of these conditions before treatment initiation. The frequency of AEs varied by regimen, with the highest rate among FCR-treated patients (76.7% had at least one AE during a FCR regimen), followed by B-R (58.6%), ibrutinib (56.1%), and rituximab monotherapy (24.4%) (data not shown). AF and bleeding were most frequently observed in patients receiving ibrutinib (AF, 7.4% vs. 0.7–1.2% in other three regimens; bleeding, 9.2% vs. 1.4–3.2%). Table 2 reports the number of AEs and the proportion of patients who experienced each of the AEs of interest during the first observed therapy (not adjusted for age or CCI), by treatment regimen.
In the first-line setting (n = 1579), the rates of incident AF and bleeding were compared. Patients receiving ibrutinib (n = 429) had significantly higher hazard of experiencing AF than patients treated with B-R (HR 4.3; 95% confidence interval [CI] 1.4, 12.7) and FCR (HR 5.5; 95% CI 1.3, 23.8), respectively (Fig. 3). The risk of AF in patients treated with ibrutinib compared to those with rituximab monotherapy was similar (HR 1.8; 95% CI 0.6, 5.5) (Fig. 3). Patients receiving ibrutinib had a higher risk of bleeding than those with B-R (HR 2.3; 95% CI 1.0, 5.3) (Fig. 4). The risk of bleeding in patients treated with ibrutinib was similar to those with rituximab monotherapy (HR 0.7; 95% CI 0.3, 1.5) and FCR (HR 1.2; 95% CI 0.6, 2.4).

Kaplan-Meier Analysis for Time from Treatment Initiation to Incidence of Atrial Fibrillation by Regimen, over the First Treatment Episode

Kaplan-Meier Analysis for Time from Treatment Initiation to Incidence of Hemorrhage/Bleeding by Regimen, over the First Treatment Episode
A logistic regression model, controlling for baseline demographic and clinical characteristics and regimen, confirmed the increased odds of AF among patients treated with ibrutinib compared to the other three regimens. When compared to B-R and FCR, the findings from unadjusted analyses persisted in adjusted analyses. The risk of AF for ibrutinib patients during the first-line setting was 10.4 times higher than B-R (odds ratio [OR] B-R vs. ibrutinib = 0.1; 95% CI 0.03–0.28) and 11.2 times higher than FCR (OR = 0.1; 95% CI 0.02–0.38) (Supplemental Table 2). In adjusted analysis comparing patients receiving ibrutinib and rituximab monotherapy, the difference in the risk of AF became significant (5.7 times higher for ibrutinib patients; OR = 0.2; 95% CI 0.06–0.52). As in the unadjusted analyses, the risk of bleeding for patients receiving ibrutinib was higher than those receiving B-R in adjusted analyses (6.5 times higher for ibrutinib; OR = 0.2; 95% CI 0.07–0.33). The risk of bleeding for patients receiving ibrutinib compared to rituximab monotherapy and FCR became significantly higher in adjusted analyses (3.2 times higher than rituximab monotherapy [OR = 0.3; 95% CI 0.15–0.65]; 2.6 times higher than FCR [OR = 0.4; 95% CI 0.19–0.78]) (Supplemental Table 3).
HRU
Among patients treated with the four most common regimens during follow-up, 30.7% had at least one hospitalization, with a mean length of stay of 6.4 ± 5.1 days, during the variable follow-up period (Table 3). The proportion of patients requiring hospitalization increased as the number of unique incident AEs during a specific treatment regimen increased (i.e., from 8.2% among 428 patients with no AEs to 89.1% among 64 patients with at least six AEs) (Table 3; Fig. 5). Furthermore, 41.4% of all patients had at least one ED visit, and the proportion of patients with at least one ED visit also increased as the number AEs increased, from 19.4% among patients with no AEs to 82.8% among patients with at least six AEs (Table 3; Fig. 5). Almost all patients had at least one office visit (99.6%) and other outpatient services such as laboratory or ancillary services (99.8%). Mean all cause-pharmacy use was 6.8 ± 5.6 prescriptions/injection administrations PPPM. Similar to hospitalizations and ED visits, increased number of office visits, pharmacy, and other outpatient services was observed as the number of AEs increased (Table 3). Trends for CLL-related HRU were generally similar to all-cause findings described and are shown in Table 3.

Proportion of Patients with All-Cause Inpatient Admission and ED Visit by Number of Incident Adverse Events
A multivariable logistic regression model, controlling for demographic and clinical characteristics and regimen, confirmed the increased odds of hospitalization as the number of incident AEs increased during the first observed treatment episode (OR = 2.9; 95% CI 2.5–3.4; Table 4). The risk of inpatient admission was 1.6 and 2.0 times higher for patients receiving ibrutinib compared to patients receiving B-R (OR = 0.6; 95% CI 0.4–0.9) and FCR (OR = 0.5; 95% CI 0.3–0.8), respectively. The risk of inpatient admission was similar for patients receiving ibrutinib and patients receiving rituximab monotherapy (OR = 0.7; 95% CI 0.4–1.1).
Healthcare Costs
The mean total all-cause healthcare cost over the entire follow-up period (mean 19.3 months) was $13,858 ± 14,626 PPPM. Total CLL-related costs (mean $11,791 ± 13,291 PPPM) accounted for 85.1% of the total costs (Table 3). The largest contributor to total all-cause and total CLL-related costs was medication costs (mean $9938 ± 9235 for all-cause, and $8982 ± 8918 for CLL-related). Other outpatient services cost and inpatient cost were the second largest contributors for all-cause and CLL-related costs, respectively (Table 3). Total all-cause cost PPPM generally increased as the number of AEs increased, from $13,287 for patients with no AEs to $20,807 for patients with at least six AEs, with the exception of higher total all-cause costs among patients with 1–2 AEs (mean $13,809 PPPM) compared to patients with 2–3 AEs (mean $13,453 PPPM). The trend for total CLL-specific costs was similar to total all-cause cost. Mean all-cause and CLL-related costs PPPM for all resource categories except for pharmacy and office visits increased as the number of AEs increased (Table 3).
A generalized linear model, controlling for demographic and clinical characteristics and regimen, showed a trend toward higher total all-cause cost PPPM as the number of incident AEs increased (cost ratio [CR] = 1.2, 95% CI 1.1–1.2; Supplemental Table 4). The total all-cause cost PPPM was 1.2 times higher for patients receiving ibrutinib as the first observed therapy compared to both patients receiving rituximab monotherapy (CR = 0.9; 95% CI 0.8–0.97) or FCR (CR = 0.8; 95% CI 0.8–0.94; Supplemental Table 4) as the first observed therapy.
Discussion
This study describes the four most common CLL treatments and associated toxicities, HRU, and costs in a recent commercially insured population of treated patients with CLL. Patients in our study were about 10 years younger than the general CLL population in the USA (median age 59 years in our study vs. 68 years in the general CLL population [3]), a reflection of the largely commercially insured population in the study database. The burden of comorbidities prior to initiating CLL treatment in our study was moderate (median CCI score 2) and consistent with a multicenter patient registry study of newly treated patients with CLL [31]. The proportion of patients at high risk of AF (22%) was lower than that in a claims-based observational study of newly diagnosed patients with CLL, with a higher median age of 66 (47%) [21]; this difference may be explained by the younger population in our study. About one-third of patients had evidence of prognostic biomarker testing on the index date or within 90 days before the index date (i.e., FISH) which appears to be in line with the multicenter CLL registry study reporting a FISH testing rate of 31% among treated patients with CLL [31] primarily treated in the community setting, but lower than a large electronic health records (EHR)-based study of treated patients with CLL (60% had evidence of FISH testing) [32].
Our study included patients treated for CLL in recent years and provides data on the rates of the four most common CLL treatment regimens and associated toxicities of these regimens. The four most common treatments observed in the first-line setting were B-R (24%), ibrutinib monotherapy (20%), FCR (15%), and rituximab monotherapy (14%). This is consistent with a recent EHR-based analysis that evaluated front-line therapies from 2008 to 2017 (B-R, 23%; ibrutinib monotherapy, 18%; FCR, 7%; and rituximab monotherapy, 12%), and the higher rate of FCR in our study is likely reflective of our younger population [32]. It is important to note that our study leveraged administrative claims data only to determine treatment regimens. The relatively frequent use of rituximab monotherapy in the first-line setting (more than 10%) was observed in our study and also reported in the EHR-based study [32]. While rituximab monotherapy was not one of the front-line treatments recommended by the NCCN guidelines [6], it is important to note that frequent use is observed in studies leveraging real-world data [32]. We also observed that B-R was the most common regimen in the first-line setting and that ibrutinib monotherapy was the most common in the second- and third-line settings, consistent with previous real-world research [21].
This study highlights the clinical and economic burden among treated patients with CLL. The majority of patients in the study population had evidence of at least one incident AE during their treatment (59%). In this claims-based study, it is possible that AEs are underreported since they are captured by diagnostic coding only and those AEs that did not lead to a healthcare visit may have been missing. Among the four most common CLL treatment regimens, the frequency of incident AEs was highest among patients treated with FCR (77%), followed by B-R (59%), ibrutinib (56%), and rituximab monotherapy (24%). The most commonly observed incident AE in our study was neutropenia (32%, irrespective of treatment regimen or line of therapy), followed by infection (11%), anemia (9%), and thrombocytopenia (8%); these findings are generally consistent with previous real-world studies and clinical trials [21, 33]. As for the incident AEs observed for ibrutinib, regardless of observed line of therapy, we found that infection (15%) was the most common AE; the occurrence of AF (7%), bleeding (9%), and arthralgias (4%) among ibrutinib-treated patients appeared higher than those treated with B-R, FCR, or rituximab monotherapy, similar to a prior claims analysis of older patients with CLL [21]. The majority (75%) of ibrutinib-treated patients received ibrutinib in the first-line setting, and in the adjusted analyses focusing on the first-line setting, we confirmed the higher risks of AF and bleeding for ibrutinib-treated patients in this setting. These findings are comparable to previous real-world and clinical studies [14, 21, 34], and small discrepancies such as proportion of patients with AEs not requiring treatment or office visits (i.e., anemia, diarrhea, etc.) are expected as our study leverages claims data of younger patients with CLL, which may underreport these AEs.
In our study, 31% of patients were hospitalized during the follow-up period. Although our follow-up was longer (median 16 months) than prior studies and was not focused on treated follow-up for HRU, this is comparable to previous retrospective claims studies of patients with CLL (majority newly treated with B-R, rituximab monotherapy, ibrutinib, or FCR in one study and B-R, rituximab monotherapy, or FCR in another study), which reported a hospitalization rate of 24–25% during the first line of therapy [18, 35]. Our study also found that nearly all patients (99.6%) had an office visit and less than half (41%) had an ED visit, similar to previous real-world studies (96% for office visit; 31–33% for ED visit during the first line of therapy) [18, 35].
Overall, we found that the proportion of patients utilizing each healthcare resource category increased as the number of incident AEs increased. For example, the hospitalization rate among patients experiencing 1–2 AEs (24%) was less than half of those of patients experiencing 3–5 AEs (60%). Adjusted analyses further confirmed the trend towards higher risk of hospitalization as the number of incident AEs increased. This suggests that, if similar or better efficacy can be achieved when mitigating adverse events, decreasing toxicity may reduce HRU burden among patients with CLL. No prior study reported these results for patients with CLL; however, our results are aligned with a claims-based study of patients with mantle cell lymphoma reporting that increased AEs resulted in increased HRU, including hospitalization and ED visits [36].
Our study also quantified the current healthcare burden among treated patients with CLL. The total healthcare cost from start of CLL treatment through end of follow-up (mean [SD] $13,858 [$14,550] PPPM) was five times higher than it was in the 12 months before treatment initiation (mean [SD] $2709 PPPM [$4458]). The cost after starting treatment was comparable to the mean total costs reported in previous real-world studies ($7943 [$15,757]–$17,442 [$15,715] PPPM) [21, 35], highlighting that the healthcare burden among patients with CLL continues to be substantial. Given the limitations of this claims-based approach in capturing AEs and associated HRU, our estimated healthcare costs may be underestimated from true costs incurred. Furthermore, there may be residual confounding of these unadjusted results, such as disease progression, which may impact timing and receipt of treatment. Moreover, pharmacy costs for oral and infused agents accounted for 72% of total cost, with all-cause inpatient and other outpatient services such as laboratory or ancillary services being the next largest contributors to cost. The large portion of total cost attributed to pharmacy cost is reflective of increased treatment costs and high HRU after treatment initiation reported in the literature [18, 37, 38]. Not only are the costs of a newer agent (ibrutinib, in our study) higher, but HRU and costs associated with treatment-related AEs are substantial; this has been documented for other cancers previously [39], but not in any prior studies among patients with CLL. The unadjusted costs rose as the number of AEs increased, and this finding was internally validated in the adjusted cost model, and consistent with a previous claims-based study which also reported the increase in unadjusted monthly costs per patient when the number of AEs increased [21].
This study is subject to limitations common to retrospective database analyses, including possible billing and coding errors, and that the data were not collected for research purposes. Our study leveraged administrative claims data which lacks comprehensive clinical information (e.g., AEs not requiring medical attention, prognostic factors such as lactate dehydrogenase and white blood cell count). To that end, our findings on AEs and associated HRU and costs are likely underestimated. We were also unable to assess tumor burden and other factors which could have influenced treatment choice. Clinical information to assess severity, grade, and additional details for the observed AEs were not available. In order to explore the burden of AEs associated with treatments, we measured and compared HRU and costs among patients experiencing 0, 1–2, 3–5, and at least 6 incident AEs identified using diagnosis codes. A causal relationship between AEs, HRU, and cost cannot be established without additional clinical information and confirmation that the HRU and costs were directly related to the AEs. Patients with more lines of therapy and longer follow-up have a greater opportunity to incur AEs and costs, and this study did not adjust for follow-up time. The minimum follow-up required was at least 30 days, to be inclusive. The implications of this are that some patients were not in the database for very long to incur AEs and high costs and second- and third-line therapy. Therefore, longer follow-up in a larger sample of patients would likely provide a more comprehensive picture into differences among treatment regimens over time. Despite these limitations, the volume and comprehensiveness of IQVIA PharMetrics® Plus provides the ability to observe treatments, events, HRU, and costs in all settings of care longitudinally.
Conclusion
This study highlights the clinical and economic burden associated with current and commonly used CLL treatments. In this study of younger patients treated in the real-world setting, the most common regimens observed among patients with CLL were B-R, ibrutinib monotherapy, rituximab monotherapy, and FCR. More than half of newly treated patients had evidence of at least one incident AE. HRU and costs consistently increased as the number of AEs increased, suggesting a potential association between greater treatment toxicity and higher HRU. Adjusted models confirmed the trend of the healthcare costs and odds of hospitalization increasing as the burden of treatment toxicity increased. As more novel therapies become incorporated into clinical practice, further research examining clinical and economic outcomes, in particular treatment toxicities and associated HRU and costs in a real-world setting, may help prescribers and patients evaluate the risks, benefits, and value of novel agents.
Change history
13 June 2020
In the original article, it has been noticed that the abbreviation ‘‘CLL’’ is incorrectly published throughout the paper as the abbreviation “CCL”. The correct abbreviation is “CLL”.
References
American Cancer Society. Cancer facts & figures 2019. Atlanta: American Cancer Society; 2019.
Seymour EK, Ruterbusch JJ, Beebe-Dimmer JL, Schiffer CA. Real-world testing and treatment patterns in chronic lymphocytic leukemia: a SEER patterns of care analysis. Cancer. 2019;125(1):135–43.
Brenner H, Gondos A, Pulte D. Trends in long-term survival of patients with chronic lymphocytic leukemia from the 1980s to the early 21st century. Blood. 1980s;111(10):4916–21.
National Cancer Institute. Cancer stat facts: leukemia-chronic lymphocytic leukemia (CLL). 2020. https://seer.cancer.gov/statfacts/html/clyl.html. Accessed 10 Apr 2020.
Mato A, Jahnke J, Li P, et al. Real-world treatment and outcomes among older adults with chronic lymphocytic leukemia before the novel agents era. Haematologica. 2018;103:e0462.
Wierda WG, Zelenetz AD, Gordon LI, et al. NCCN guidelines insights: chronic lymphocytic leukemia/small lymphocytic lymphoma, version 1.2017. J Natl Compr Canc Netw. 2017;15(3):293–311.
Zelenetz AD, Gordon LI, Wierda WG, et al. Chronic lymphocytic leukemia/small lymphocytic lymphoma, version 1.2015. J Natl Compr Canc Netw. 2015;13(3):326–62.
FDA. Ibrutinib prescribing information. 2017. https://www.accessdata.fda.gov/drugsatfda_docs/label/2017/205552s020lbl.pdf. Accessed 10 Apr 2020.
FDA. Venetoclax prescribing information. 2018. https://www.accessdata.fda.gov/drugsatfda_docs/label/2018/208573s009lbl.pdf. Accessed 10 Apr 2020.
Mato AR, Nabhan C, Barr PM, et al. Outcomes of CLL patients treated with sequential kinase inhibitor therapy: a real world experience. Blood. 2016;128(18):2199–205.
Mato AR, Allan JN, Pagel JM, et al. Front-line ibrutinib therapy for chronic lymphocytic leukemia (CLL) in the real world: responses, toxicity, outcomes and subsequent therapies. Blood. 2017;130(Suppl 1):3011.
Byrd JC, Brown JR, O'Brien S, et al. Ibrutinib versus ofatumumab in previously treated chronic lymphoid leukemia. N Engl J Med. 2014;371(3):213–23.
Woyach JA, Ruppert AS, Heerema NA, et al. Ibrutinib regimens versus chemoimmunotherapy in older patients with untreated CLL. N Engl J Med. 2018;379(26):2517–28.
Burger JA, Tedeschi A, Barr PM, et al. Ibrutinib as initial therapy for patients with chronic lymphocytic leukemia. N Engl J Med. 2015;373(25):2425–37.
Shanafelt TD, Wang V, Kay NE, et al. A randomized phase III study of ibrutinib (PCI-32765)-based therapy vs. standard fludarabine, cyclophosphamide, and rituximab (FCR) chemoimmunotherapy in untreated younger patients with chronic lymphocytic leukemia (CLL): a trial of the ECOG-ACRIN cancer research group (E1912). Blood. 2018;132(Suppl. 1):LBA-4.
NCCN. Chronic lymphocytic leukemia/small lymphocytic lymphoma (version 5.2019). National Comprehensive Cancer Network. 2019. https://www.nccn.org/professionals/physician_gls/pdf/cll.pdf. Accessed 10 Apr 2020.
Byfield SD, Korrer S, Ellis L, Schenkel B. Real world treatment patterns and healthcare resource utilization (HRU) among chronic lymphocytic leukemia (CLL) patients by regimen. J Clin Oncol. 2015;34:15.
Schenkel B, Ellis L, Korrer S, Byfield SD. Real-world treatment patterns and health care resource utilization (HRU) among patients with chronic lymphocytic leukemia (CLL) by regimen. J Clin Oncol. 2016;34(7_suppl):15.
To TM, Yeh W-S, Biondo J, Masaquel AS. Patterns of ibrutinib use, discontinuation, and hospitalization among patients with chronic lymphocytic leukemia (CLL) in a US healthcare claims database. Blood. 2018;132(Suppl_1):5909.
Nordstrom BL, Knopf KB, Teltsch DY, Engle R, Beygi H, Sterchele JA. The safety of bendamustine in patients with chronic lymphocytic leukemia or non-Hodgkin lymphoma and concomitant renal impairment: a retrospective electronic medical record database analysis. Leuk Lymphoma. 2014;55(6):1266–73.
Kabadi S, Goyal RK, Nagar SP, Kaye JA, Davis KL, Mato AR. Treatment patterns, adverse events, and economic burden in a privately insured population of newly diagnosed patients with chronic lymphocytic leukemia in the United States. Blood. 2018;132(Suppl 1):3557.
Fowler NH. Role of maintenance rituximab (rituxan) therapy in the treatment of follicular lymphoma. Pharm Ther. 2011;36(9):590–8.
Inoue N, Nishimura N, Takahashi A, et al. Rituximab maintenance therapy is an effective therapy in over-sixties with mantle cell lymphoma. Am Soc Hematol. 2015;126(23):5081.
Kenkre VP, Long WL, Eickhoff JC, et al. Maintenance rituximab following induction chemo-immunotherapy for mantle cell lymphoma: long-term follow-up of a pilot study from the Wisconsin Oncology Network. Leuk Lymphoma. 2011;52(9):1675–80.
Romano PS, Roos LL, Jollis JG. Presentation adapting a clinical comorbidity index for use with ICD-9-CM administrative data: differing perspectives. J Clin Epidemiol. 1993;46:1075–9.
Chyou JY, Hunter TD, Mollenkopf SA, Turakhia MP, Reynolds MR. Individual and combined risk factors for incident atrial fibrillation and incident stroke: an analysis of 3 million at-risk US patients. J Am Heart Assoc. 2015;4(7):e001723.
Chanan-Khan A, Cramer P, Demirkan F, et al. Ibrutinib combined with bendamustine and rituximab compared with placebo, bendamustine, and rituximab for previously treated chronic lymphocytic leukaemia or small lymphocytic lymphoma (HELIOS): a randomised, double-blind, phase 3 study. Lancet Oncol. 2016;17(2):200–11.
Shanafelt TD, Wang V, Kay NE, et al. A randomized phase III study of ibrutinib (PCI-32765)-based therapy vs. standard fludarabine, cyclophosphamide, and rituximab (FCR) chemoimmunotherapy in untreated younger patients with chronic lymphocytic leukemia (CLL): a trial of the ECOG-ACRIN cancer research group (E1912). Blood. 2018;132(Suppl 1):LBA-4.
Tedeschi A, Greil R, Demirkan F, et al. Single-agent ibrutinib versus chlorambucil-obinutuzumab as first-line treatment in patients with chronic lymphocytic leukemia or small lymphocytic lymphoma (CLL/SLL): results of a cross-trial comparison. Blood. 2018;132(Suppl 1):5565.
Woyach JA, Ruppert AS, Heerema NA, et al. Ibrutinib alone or in combination with rituximab produces superior progression free survival (PFS) compared with bendamustine plus rituximab in untreated older patients with chronic lymphocytic leukemia (CLL): results of alliance North American intergroup study A041202. Blood. 2018;132(Suppl 1):6.
Mato AR, Barrientos JC, Brander DM, et al. Prognostic testing and treatment approaches in patients with chronic lymphocytic leukemia: clinical experience from an interim analysis of the inform CLL™ real-world registry. Blood. 2018;132(Suppl 1):4425.
Tang B, Szabo E, Zhou J, Wu J, Brander DM. Real-world characteristics of CLL patients receiving front-line therapy, using the Flatiron Health Database. Blood. 2017;130(Suppl 1):4671.
Kasi PM, Tawbi HA, Oddis CV, Kulkarni HS. Clinical review: serious adverse events associated with the use of rituximab-a critical care perspective. Crit Care. 2012;16(4):231.
Stephens DM, Byrd JC. How we manage ibrutinib intolerance and complications in patients with chronic lymphocytic leukemia. Blood. 2019;133(12):1298–301.
Matasar MJ, Dacosta Byfield S, Blauer-Peterson C, Montez M, Reyes C, Masaquel A. Real-world health care utilization and costs among patients newly initiating systemic therapy for chronic lymphocytic leukemia (CLL) in the United States. Blood. 2016;128(22):5928.
Goyal RK, Nagar SP, Kabadi SM, Kaye JA, Seal B, Mato AR. Adverse events, resource use, and economic burden associated with mantle cell lymphoma: a real-world assessment of privately insured patients in the United States. Leuk Lymphoms. 2018;60:1–9.
Chen Q, Jain N, Ayer T, et al. Economic burden of chronic lymphocytic leukemia in the era of oral targeted therapies in the United States. J Clin Oncol. 2017;35(2):166.
Pfeil AM, Imfeld P, Pettengell R, et al. Trends in incidence and medical resource utilisation in patients with chronic lymphocytic leukaemia: insights from the UK Clinical Practice Research Datalink (CPRD). Ann Hematol. 2015;94(3):421–9.
Wong W, Yim YM, Kim A, et al. Assessment of costs associated with adverse events in patients with cancer. PLoS One. 2018;13(4):e0196007.
Acknowledgements
Funding
Sponsorship for this study and the journal's Rapid Service Fee were funded by AstraZeneca.
Authorship
All named authors meet the International Committee of Medical Journal Editors (ICMJE) criteria for authorship for this article, take responsibility for the integrity of the work as a whole, and have given their approval for this version to be published.
Disclosures
Shaum Kabadi is an employee of AstraZeneca. Aimee Near and Keiko Wada are employees of IQVIA, which received funding from AstraZeneca to conduct this research study. Chakkarin Burudpakdee was an employee of IQVIA at the time of the analysis and manuscript preparation.
Compliance with Ethics Guidelines
This study was based on secondary, de-identified data which comply with the Health Insurance Portability and Accountability Act (HIPAA). Institutional review board approval was not required for this study.
Data Availability
The datasets generated during and/or analyzed during the current study are not publicly available but are available from the corresponding author on reasonable request. The data will not be deposited.
Author information
Authors and Affiliations
Corresponding author
Additional information
Digital Features
To view enhanced digital features for this article go to https://doi.org/10.6084/m9.figshare.12130014.
Electronic Supplementary Material
Below is the link to the electronic supplementary material.
Rights and permissions
About this article

Cite this article
Kabadi, S.M., Near, A., Wada, K. et al. Real-World Treatment Patterns, Adverse Events, Resource Use, and Costs Among Commercially Insured, Younger Patients with Chronic Lymphocytic Leukemia in the USA: A Retrospective Cohort Study. Adv Ther 37, 3129–3148 (2020). https://doi.org/10.1007/s12325-020-01350-w
Received:
Published:
Issue Date:
DOI: https://doi.org/10.1007/s12325-020-01350-w