
Abstract
Crowd sensing networks can be used for large scale sensing of the physical world or other information service by leveraging the available sensors on the phones. The collector hopes to collect as much as sensed data at relatively low cost. However, the sensing participants want to earn much money at low cost. This paper examines the evolutionary process among participants sensing networks and proposes an evolutionary game model to depict collaborative game phenomenon in the crowd sensing networks based on the principles of game theory in economics. A effectively incentive mechanism is established through corrected the penalty function of the game model accordance with the cooperation rates of the participant, and corrected the game times in accordance with it’s payoff. The collector controls the process of game by adjusting the price function. We find that the proposed incentive game based evolutionary model can help decision makers simulate evolutionary process under various scenarios. The crowd sensing networks structure significantly influence cooperation ratio and the total number of participant involved in the game, and the distribution of population with different game strategy. Through evolutionary game model, the manager can select an optimal price to facilitate the system reach equilibrium state quickly, and get the number of participants involved in the game. The incentive game based evolutionary model in crowd sensing networks provides valuable decision-making support to managers.
1 Introduction
Recently the crowd sensing networks (CSNs), as a novel networking model, has aroused extensive concerns for solving the complex sensing applications from the significant demands from people’s life [1–5]. Crowd sensing networks (CSNs), which leverages the ubiquity of sensor-equipped mobile devices to collect data at low cost, provides a new paradigm for solving the above demands [1–5]. Data collection and data dissemination are the two most important functions in crowd sensing networks (CSNs) [2, 3]. Through CSNs, data collection department (denoted as collector) collect sensing data from participant, then release relevant information to the public, such as VTrack [6] for providing omnipresent traffic information and NoiseTube [7] for making noise maps [1].
For example, haze is one of seriously pollution air. For effective monitoring Particulate Matter 2.5 (PM2.5), Release Air Quality Index (AQI) and Air Pollution Index (API) to citizens in real-time, weather bureau need deployment a certain density of monitoring station to monitor air quality situation in different areas of the city. But, the lack of the traditional method is need long-term employ a certain amount of manpower and lease monitoring sites, the cost is higher, and the provided information is limited. But in crowd sensing network, each mobile phone can collect air quality situation and report to the weather bureau. Because of the crowd sensing network with large numbers of data collector, thus the AQI and API will be more comprehensive and more real-time. However, the collector needs to pay the cost to collect information, thus, the weather bureau needs to give a certain incentive to the collector, thus the collector will actively participate in data collection. How to determine incentive strategy and get the available AQI and API is a challenge issue for weather bureau.
Data collection and Data dissemination is not an easy thing in the CSNs. For data collection, the participant needs to spend time and equipment cost on the process of collecting sensing data, so most of participants is not willing to participate in data collection. In reality, the behaviors of each individual are naturally selfish, especially when the resources are limited. Data dissemination is also a challenging issue in CSNs. Thus, it is indispensable to provide some incentive schemes to stimulate selfish participant to cooperate in CSNs [1]. Therefore, a lot of incentive schemes have been proposed, such as credit-based mechanism [8], based on virtual currency [9], based on the price mechanism of incentive mechanism [10]. Incentive mechanism can improve the efficiency of the system, but the total payment and total payoff for the system take little into consideration. It is possible that the total payoff is less than its payment in the incentive mechanism; It is not suited to applications for that reason. On the other hand, CSNs is a complex and interactive game system [11], participants with different strategy take part in the crowd sensing in the system, a population is refer to the participant with the same strategy, the whole system is composed of multiple population [11]. The distribution of population composition, population density and frequency (refers to the participant activity, i.e. the game times in the game) can affect the stability of the system [12]. So CSNs is regarded as a complex network system, it is an appropriate way that using the game system to describe the CSNs. In the CSNs, there are the following several kinds of game. (a) There is a game between the collector and all participants [12]. For the collector, the collector hopes to collect as much as sensing data at relatively low cost. For participants, participants hope to obtain the maximum payoff with minimum cost. (b) The game among the participants. Interaction between any two of the participants can be viewed as a game [12]. It would be seen as a cooperative game when the two participants cooperate with each other. In a cooperative game, each participant will pays for a game while they also achieve considerable payoff. However, the two participants is not always cooperate with each other in an interaction, when the sponsor player cooperates and the opponent defects, the sponsor player is only loss and no gains. So the game between participants has a great deal of uncertainty.
In practical crowd sensing applications, the collector plays an important role in promoting the participant cooperation, the collector control the game system by making payoff matrix [12]. The most attention for the collector is the following: (a) setting the price of incentive mechanism. Considering predetermined payment is ϖ Θ, so how much are the incentives when the participant provides a sensing data? Or: how does the collector set price λ for the service provided by participant. If the price λ is too high, the participants are glad to participate in the interaction, the more sensing data provided by the participant and the higher cost of the collection, which result in the lower efficiency. Conversely, if the price λ is too low, and the participant doesn’t want to participant in the game for lack of incentive, so the collector is difficult to collect enough decision-making sensing data. Although the collector can adjust the price λ according to the feedback information in theory, the market competition often is lost for this case which leads to a series of difficulties in practice, so it is an important challenge to make more reasonable and accurate price. (b) How much is the expected payoff and expected payment? After the collector set price λ, the most concern is that how much need to pay for the collector under the price λ? How much payoff of the collector? (c) Other parameters. For the collector, different population makes different contribution to the payoff of the system. According to the law of 20:80, i.e. 20% of the participant provides 80% of payoff. In the CSNs, the other problem the collector concerned is: how the contribution of the different population makes to the payoff of the system? Thus the collector may adopt corresponding strategies for these populations to obtain more payoff, it also hopes to analyze the relationship with the price λ, payment and payoff by inspecting the network structure of the population distribution, density, the frequency of the game, etc. which lead to obtain the maximization payoff through making the optimal payoff matrix. For the participant, the most attention is: (a) what strategy should be adopted to win in the game? (b) How much is payoff of the participant involved in the game?
There are some researches on CSNs model. To the best of our knowledge, there is little study have been made for description of the evolution state of CSNs system and make a good answer to the above question. So, it is necessary to propose an evolutionary game model to depict the collaborative game phenomenon of the crowd sensing networks for facilitating the manager decision [13]. This paper examines the evolutionary process among participants in the crowd sensing networks; proposes an evolutionary game model to depict collaborative game phenomenon of the crowd sensing networks based on the principles of game theory in economics. The main contributions of our work in this paper are as follows:
-
(1)
An evolutionary game model to depict collaborative game phenomenon of the crowd sensing networks which based on the principles of game theory in economics is proposed. A effectively incentive mechanism is established through corrected the penalty function of the game model accordance with the cooperation rates of the participant and corrected the game times in accordance with it’s payoff.
-
(2)
Through evolutionary game model, the major concern issue for the manager can be resolved. For manager, they can get the optimized price λ according to proposed evolutionary game model. They can predict payoff and payment under the price λ. The contribution to payoff made by difference population can be obtained. They can also optimize the price λ, payoff and payment by investigating the distribution of population, density, the frequency of the game, etc. Thus the result of the evolutionary game provides valuable decision-making support to managers.
-
(3)
Through our extensive simulation study, we demonstrate that the incentive game based evolutionary model can reach equilibrium state quickly in various network parameters and under different network structure. The change law of system gains and price is also present under different network structure and different network parameters, which help manager to quickly get optimal parameters. According to these experiments, it illustrate that the proposed model is suitable to the crowd sensing networks, which contributes to the theoretical development of literature.
The rest of this paper is organized as follows: In Section 2, the related works are reviewed. The system model is described in Section 3. In Section 4, an incentive game based evolutionary model for crowd sensing network is presented. Section 5 is experimental results and comparison. We conclude in Section 6.
2 Background and related work
John von Neumann proposes game theory in 1928, the game theory is an significant instrument in many fields [14–20]. Analyze rational players’ strategic game and research competitive mathematical theories and methods are the most important function for game theory [14, 15, 20]. The Nash-equilibrant of Prisoner’s Dilemma (PD) game is a famous topic in the studies, it is defection, and cooperation cannot exist in well-mixed population [12, 14, 16]. However, in 1992, the result of a lot of experiment researched by Nowak showed that cooperation can survive in the lattice network in Prisoner’s Dilemma game [12]. Then, Axelrod gives an important contribution in 1980s [12, 15, 16]. Computer tournaments are conducted to find the strategy that plays best in a population playing Prisoner’s Dilemma game [15]. Tit-for-tat (TFT) has won both of the tournaments [16]. In 1987, when participants can memory more than one steps, Axelrod coded the game history and strategy in binary string and applied Genetic Algorithm to study Prisoner’s Dilemma game [15]. The result is that some models in the strategy chromosome and TFT are in some ways similar. However, Nowak shows that win-stay, lose-shift (WSLS) is better than Tit-for-tat [17] in 1993. In the simulation, win-stay, lose-shift strategy evolves as the optimal strategy.
Cooperation is vital to make high levels of organizations for evolution. Genomes, social insects, organisms, and human society are all rely on cooperation [12]. Thus, it is a crucial problem that knowing the emergence and persistence of cooperative behavior among rational participants. An appropriate theoretical framework can be provided by Evolutionary game theory [17] for addressing the subtleties of cooperation in the dilemmas [12].
Incentives are a powerful and common mechanism for crowd sensing [1]. The incentive scheme has been widely used in society networks and peer to peer network to promote participant cooperation [21]. According the literatures [21], there are three main kinds of incentive schemes: reputation, barter and credit.
The reputation-based schemes are widely applied in many occasions [21]. The main feature of this mechanism is: The participant’s reputation increases when it becomes more cooperative. Participant with higher reputation can reduce the cost when play games with other participant, and the obtained payoff is higher than the participant with lower reputation. In order to improve cooperation ratio for the system, some mechanism must be taken to make participant cooperate with each other [21].
Constructing trustworthy platform need to use the reputation-based schemes. According to the result of repeated game theory [22], in order to describe the behavior of autonomic elements and promote cooperation, Gui and others propose PETrust(a penalty-incentive mechanism). According to the participant reputation, PETrust modifies the degree of penalty. Distinguish the different features of behavior effectively and punish malicious behavior, strengthen cooperation based on the results of theoretical analysis and simulation [22].
In social network and Peer-to-Peer (P2P) networks, trust plays an important role in promoting cooperation among participants [23]. A complete lack of responsibility for the content a peer puts on the network, opening the door to abuses by malicious participants because of the open and anonymous nature of P2P networks [24]. Therefore, it is important that to build trust relationship between participants for large-scale Peer-to-Peer networks [24]. Tian and others propose a dempster-shafer (D-S) evidence theory for P2P networks. The main goal of ETFT is to solve conflicting problems according to fuzzy trust deduce to in a reputation [24].
Liu F and others propose a trust-aware propagation model on the basic of the social network and to find the propagation features and regularity of trust being as network stability factor for Peer-to-Peer networks based on analyzing aware-computing [23]. Their framework has three layers: propagation layer, aware layer, and computation layer. And to complete the formation of trust networks as fast as in P2P, a trust-aware propagation algorithm is appeared [23]. Their results show that the security and stability of P2P network can be improved by their trust-aware propagation model.
In a credit-based scheme, a participant can earn credits by cooperating with other participant or helping others doing some benefit work and then the participant uses credits to rent others to help them [21]. Such credit-based scheme work can also be found in Ref. [25] and Ref. [26].
Adopting the method of game to carry on the reasonable pricing for the resource is common. In Ref. [27], the sellers (or players) set their resources’ prices to earn maximize the payoffs, while buyers want to seek the least expensive resources in a non-cooperative resource pricing game. Those works is better for our follow-up studies.
To sum up, the crowd sensing networks is an important part of cyber—physical systems, using it with the wireless sensor network can realize omnipresent perception function of the future network [28–30], so its research has important significance.
3 The system model and problem statement
3.1 System model
The system model which we adopt in this paper is similar to Ref. [1]. We use Fig. 1 to illustrate a crowd sensing system. The system consists of 3 parts:(a) Clients requiring many crowd sensing applications. (b) Collectors which collect sensing data to provide service for clients, (c) N participants. A requester requires crowd sensing applications from the collectors. When a collector receives a crowd sensing application, it provides relevant sensing data for clients (or called services). But, in order to collect those sensing data, the collectors publishes some sensing task to the area of interest (AoI) for the application. The participants in the AoI receiving the sensing task determine whether to participate in sensing. If a participant decides to conduct the sensing, it will submit sensing reports according the sensing task requirement of the collector. In this paper, after the collector receives the sensing reports, it will update the participants׳ cooperation rate table and return some payoff to participants. At last, the collector produces sensing services for clients. As Ref. [1], our model only has a crowd sensing application in CSNs, which requires a continuous data sensing (traffic jam alter, environmental monitoring and protection such as noise, smog/haze detection, citizen-journalism, tourist query, etc. crowd sensing applications) [1].

A crowd sensing networks framework with an incentive mechanism
There are N participants in the system {π 1, π 2, π 3, …, π N }, each participant represents a person or a mobile device. Game among the participants can be conducted to make their own profit maximization. Such as environmental monitoring, the traffic crowd sensing networks monitoring. After participant π 1 and participant π 2 receive the sensing task from the collector, they sensing the surrounding environment and get some sensing data respectively. IF π 1 and π 2 gave the sensing data to each other when participant π 1 play game with participant π 2, cooperative game formed in this way (the bidirectional arrows in Fig. 1 indicate the cooperative game). In this situation, π 1 and π 2 are not only have its own sensing data, but also received each other’s sensing data, thus they can report more sensing data to their own collect and obtain more payoffs. In Fig. 1, if π 1 request sensing data from π 4, π 4 give the sensing data to π 1, while π 1 don’t provide sensing data for π 4, which resulte in π 4 only bear the cost in the game, and π 1 only obtain payoff, this is the half cooperation game of π 1 defects and π 4 cooperates (one-way arrows in Fig. 1 indicate this cooperative game relationship, direction arrow pointing to the sponsor player). On the contrary, π 1 provide sensing data to π 3, but π 3 don’t provide sensing data to π 1, that is π 1 cooperates and π 3 defects. Finally, π 4 and π 5 don’t provide sensing data with each other, so the two of participants don’t obtain payoff in the game.
The system model can be adopted for many applications. For example in Delay Tolerant Network (Delay Tolerant Network, DTN), each participant can sense data, it can also transfer the sensing data from the other participant to a certain location if the collector give the payment. Both players obtain payoff if they cooperate with each other. To encourage participants to collaborate in the game and promote the exchange of information, maximize the payoff of the system, incentive mechanisms are often adopted in the game model, which leads to the participant willing to cooperate with the other participants in the game and exchange information or spread sensing data with other participant, thus to maximize system payoff.
3.2 Game strategy
In Ref. [12], we show that is not always true when the participant remember history can promote currency in evolutionary games. The participant can remember the last game history (that is, 1-step memory), it is enough for games. So this work adopts 1-step memory mechanism to code the game history and strategy [12]. In the 1-step memory, all participants only remember the last game history. Cooperative is coded into “1” and defection is coded into “0”, There are totally 4 types of historical interactions with 1-step memory: 00 (the sponsor player defects and the opponent defects), 01 (the sponsor player defects and the opponent cooperates), 10 (the sponsor player cooperates and the opponent defects), 11 (the sponsor player cooperates and the opponent cooperates). For different history, each participant choose to cooperation or defect. So the strategy can be coded into 4 bit, and the 4 bit encoding can represent 16 different strategies, as shown in Table 1. So, in crowd sensing network, each participant can only choose one of these 16 different strategies.
In Table 1, the most famous is TFT (Tit for Tat) strategy and WSLS (win–stay, lose–switch; also win–stay, lose–shift) strategy. We can see the code of the strategy TFT (Tit for Tat) is “1010”, and WSLS (win–stay, lose–switch; also win–stay, lose–shift) is 1001. TFT strategy was first introduced by Anatol Rapoport in Robert Axelrod’s two tournaments [14], held around 1980. Tit for tat is a strategy (TFT) where each participant in an iterated prisoner’s dilemma will follow a course of action which is consistent with their opponent’s previous turn. For example, if provoked, a player will subsequently respond with retaliation, but if they are not provoked, the player will subsequently cooperate. The code is 1001 for WSLS strategy. It is a learning rule bases its decision only on the outcome of the previous play. Outcomes are divided into successes (wins) and failures (losses). If the player on the previous round resulted in a success, then the player plays the same strategy on the next round. Alternatively, if the play resulted in a failure the player switches to another action [15, 16]. ALLC strategy is always cooperate strategy, that is, whatever the game history is, it is still adopt the cooperate strategy in the next game, so the strategy is coded as “1111”. ALLD strategy is always defect strategy in the game, that is, the participant always adopts defect strategy in the game, which is coded as “0000”. Considering the total number of participant is m in crowd sensing network, There are n =16 kinds of different game strategies. Each participant adopt one strategy from the 16 kinds of game strategies. One population refers to the participant with the same game strategy. The number of participant in the same population is {ν 1, ν 2, ν 3, … ν n }, \( {\displaystyle \sum_{i=1}^n{\nu}_i}=m \). The probability of population reflects the situation of different participant adopt different game strategy in reality life, while the composition and the proportion of participants with different strategies are different in different regions, different times. So reality world can be reflected in our model.
3.3 Problem formulation
Collector’s goal is that using economic methods to promote the cooperation through publishing area of interest (AoI) and sensing data which want to collect. It calculates the payoff for every game among the participants and publishes the payoff price about interested information. Those m participants can adopt different strategy in order to get maximize payoff after the collector publishes some sensing task. It is complex for participant to choose a cooperation strategy in the evolution process of the game [12], participant takes part in the game with different strategy, and the payoff function of the participant is the obtained payoff of participants according to the action taken. Considering the participant A’s payoff \( {\lambda}_{{}_{A,k}}^j \) which adopt strategy k in the j th game, the payment is \( {\vartheta}_{{}_{A,k}}^j \), the net benefits in the game is : \( {\varpi}_{{}_{A,k}}^j={\lambda}_{{}_{A,k}}^j-{\vartheta}_{{}_{A,k}}^j \) . In n time games, participant A’s total payoff is:
And participant A’s total payoff is the payments require to be paid by collector. So the total payments require to be paid is the sum of payoff of all participants:
In evolution game, the collector set the expected investment (or payment) ϖ total before the game begins. Then, the collector adjusts the payment up to the value of the expected payment through the payoff matrix. In general, the payoff matrix can be indicated by \( \left[\begin{array}{l}R\ \mathrm{S}\\ {}T\ P\end{array}\right] \). R means that if the two participants both cooperate and get payoff R, S, T says one cooperates and the other defects, the cooperator gets S and the defector gets T, P denote both the defect and get payoff P. From the point of the collector, determining a reasonable payoff matrix is necessary to get as much as sensing data. Collectors are not clear about the number of participants and the price in advance. If R set too high, the stimulus of the participants is very strong and the participant take active part in the game, which leads to the more participant involved in the game and a lot of redundancy information be collected, while the payment exceed the expected investment.
Therefore, our main purpose is seek a evolution game model which can depict the evolution process of crowd sensing network. In the case of the total payments are given, the evolution game model can quickly evolve into a robust and stable system in the case of any given system parameters and obtain the optimized payoff matrix \( \left[\begin{array}{l}R\ \mathrm{S}\\ {}T\ P\end{array}\right] \) under the premise of the payment is not exceed a predetermined value and is closest to a predetermined value. What’s more, the proposed incentive based on the evolution game model can answer the following question. For manager, it can predicted in advance what kind of population will involved in the game, how many are the participant in the game? How much payoff is each participant get? How much is each participant’s game times? What’s the cooperate rate of the system?
4 Incentive game based evolutionary model
4.1 Game payoff matrix
When John Maynard and George R Price proposed that using method of the “strategy” and mathematics to predict the biological group competition phenomenon in 1973, Evolutionary game originated [17]. Evolutionary game theory is different from the classical game theory which is to highlight change dynamics of the strategy–it influences the balance of the whole system not only through the quality of the strategy, but also through the density or frequency of the different strategies in the population [12]. Evolutionary game theory is important to explain lots of complex challenges in biological systems. “Last it thing it select, survival of the fittest” is the basic laws of evolutionary game. The payoff in the game theory converted to fitness in the evolution game (fitness) [12, 18]. It is different from the classical game theory, one important part of evolutionary game theory is the replicator dynamics [12, 19], this rule is mainly describe how to reproduce the next generation of the individuals with high fitness in the competition group, and the individual with fitness will die from the group.
Table 2 show the payoff matrix of traditional 2×2 game [12]. In crowd sensing network, participant A play game with participant B, if they cooperate with each other, this kind of situation can be understood that the participant A and participant B can help each other relay message in delay tolerant network, which increases the sensing data, the participant A and B are all get payoff λ, but it need to pay the price ϑ due to relay the other person’s data. Thus the payoff for both participants cooperate with each other is: (λ − ϑ, λ − ϑ). A similar scene in the crowd sensing network is common, for example in the sensing data monitoring, if the participant A is willing to provide their own monitoring data to the participant B, and the participant B is willing to provide their own sensing data to the participant A, the participant A and B can get respectively a new sensing data in the game. They will get payoff λ and pay ϑ after report to the collector, thus its payoff matrix is: (λ − ϑ, λ − ϑ). If the participant B cooperate with A while A don’t, that is, the participant A request to participant B relay information, participant B is willing to help the participant A relay information, but the participant A do not want to help participant B transfer information, in this game, the participant B only bear the payment ϑ, and the participant A only get the payoff λ, expressed as (− ϑ, λ). On the contrary, the participant A adopt cooperate strategy while the participant B adopt defect strategy, the payoff is: (λ, − ϑ). In the end, if the participant A and B all adopt defect strategy in the game, the payoff matrix is (0, 0).
In practice, in order to attract more participant to participate in the game, the collector often offer certain discount to the customer, “the performance point system” is the most commonly way. “Performance point system” offers certain incentives based on the game history of the participant, so as to promote the cooperation and improve the payoff of participation system. Therefore, we introduce the cooperation rate as incentive punishment factor to promote the cooperation of the participant in our model. So, the process of the game can be described in crowd sensing network as follows: when the participant A requests collaboration and get the cooperation response from participant B, participant A can get certain payoff, while participant B offer help to participant A, it needs to pay a certain price ϑ, this is a kind of opportunity cost for the participant B. The loss may be a pure loss because the uncertainly strategy adopt by participant B in the back of the game, which can affect the enthusiasm of the cooperation. So, the cooperation ratio increase when a participant adopt cooperate strategy in the game. The cooperation ratio can adjust dynamically the payment ϑ which paid in the response of cooperation request. The participant with high cooperation ratio is easier to get services provided by other participant, so as to reduce its payment, it is a reward for good behaviors of the participant. The participants with low cooperation ratio get little payoff as difficult to obtain the cooperation of other participant, as a punishment for the participant with bad behavior. Cooperation ratio for the participant calculated as below.
The calculation of cooperation ratio: considering the cooperation ratio of current participant in the i th generation is τ i , the cooperation ratio of w generations of the system remember, expressed as {τ 1, τ 2, τ 3, …, τ w }, τ w means the cooperation ratio of the generation which nearest from the current time, τ 1 denote the cooperation ratio of the generation which furthest from the current time. So, the ratio c can be expressed as follows in recent period of time:
ℏ(k) ∈ [0, 1] is attenuation function, according to the laws of nature, it is used to reasonable weight cooperation ratio in different time, the cooperation ratio of the current time should be given more weight [31], attenuation function is defined as:
The greater the value of w shows that judge cooperation ratio of the participant according to cooperation ratio in many generations, thus reference weight of cooperation rate in recent period of time is small. And the smaller the value of w, especially when the w = 1, it indicate that only refer to the current cooperation ratio of participant in the latest generation. Therefore w need careful determine according to the circumstances of the system in order to obtain the optimization value of the system.
In our model, and we modify ϑ according to the following formula based on the cooperation ratio of participant:
The payment of the participant is related to its cooperation ratio, if its cooperation rate is very high to 1, its payment is ϑ q(.) = ϑ∂, is the lowest price in the cooperation game. When the cooperation ratio is low to zero, the maximum payment ϑ q(.) = ϑ(1 + ∂), and so as to promote the cooperation ratio through punishing the participant with defect strategy.
In our model, we also correct the payoff λ in order to make payment of the collector in the control range. The collector calculates the total payment ϖ total after rounds of games. The value of λ reduced when the total payment exceeds the predetermined payoff threshold ϖ Θ. On the contrary, the value of λ increased. In our model, the value of λ can be computed according to the following function.
In the Eq (6), Μ is the velocity correction of λ, ϖ Θ − ϖ total means that the difference between the current payment and expected payoff, and is divided into equal Μ parts. It means that expects to achieve the expected payment ϖ Θ after Μ generations evolution. The less Μ, the greater speed of evolution, while the bigger Μ, the speed of evolution is stable. We put forward the payoff matrix of evolution strategy through the above analysis, as shown in Table 3.
4.2 Game frequency
In practical, the evolution of the system is also related to the density and frequency of different strategies in population. Because population distribution of evolution system is determined in the implemented area of interest, thus evolution strategy in the game does not change its structure. And the game frequency of different population has important influence on the system. The frequency of the game is the game times of the participant in a generation game. Obviously, the participant has little impact on the payoff of the system if it doesn’t participate in the game or has less activity. The model should to encourage those behaviors which can promote the system evolution and to impose restrictions on those behaviors which block system evolution. Therefore, in our model, we adopt the following incentive strategy:
After a round of games, each participant calculates its payoff. If the payoff is higher than the average payoff of the system or higher than the average payoff of its neighbors, in the next generation of game, the system increase the game times to promote its evolution. Conversely, if a participant’s payoff is lower than average payoff of the system or below the average payoff for its neighbors in a generation of game, so the payoff obtained is lesser. Based on the theory of evolution, the game times should be reduced for loser participant in the next generation of game. We call this way that increase game times of the advantage of population and reduce game times of the disadvantage of population “winner increase and loser decreases” strategy.
“winner increase and loser decreases” strategy is consistent with the crowd sensing networks. In crowd sensing networks, the enthusiasm to participate in game can be increased if their payoff is above the average in the process of game, which resulting in gaining more payoffs and become more active and positive. For that reason, those participates want to increase game times to increase their payoff, while for those participate whose payoff is less than the average in the game, they will reduce the enthusiasm of the game or even no longer involved. Therefore, in our model, g i + 1 in the formula below means the number of game of participant A in i + 1th generation.
\( {g}_{{}_i}^A \) indicates the number of game in the last generation of game (ith generation), \( {g}_{{}_{i+1}}^A \) means the number of game in the next generation of game ((i+ 1) th generation). ϖ i,A denotes the payoff of the participant in the i th game, \( \overline{\varpi_i}={\varpi}^{total}/{m}_i \) said that the average payoff of the system in the i th generation of game, m i means the total number of the participant in the i th generation of game. \( \overline{\omega_{i,A}}={\displaystyle \sum_{B\in {N}_k}\left({\varpi}_{i,B}/{N}_A\right)} \) said that the average payoff of all the neighbors of participant k, N k is the number of neighbors of the participant k.
4.3 Evolutionary strategy
In the crowd sensing networks, in order to survival, the participant with different strategies constantly adapt to the environment in the process of game. So each participant updates their strategy with a certain probability in the game. Replicator rule is adopted in our model. Replicator rule is also named as proportional imitation rule [24]. When a round of games finished, participant A imitate a random neighbor B with probability as follow Eq. (8).
S A and S B are the strategy of participant A and B, ω A , ω B are the accumulated payoff of A and B in a round, \( \overline{\omega} \) is the average payoff in the system. ε means adjustment coefficient.
4.4 The game algorithm based on incentive mechanism
This section discusses the game algorithm based on incentive mechanism which proposed in this paper. Network environment of the algorithm has the following settings. The total number of participant is m. There are n kinds of different strategies, the number of participants of each population is {ν 1, ν 2, ν 3, … ν n }, \( {\displaystyle \sum_{i=1}^n{\nu}_i}=m \). ϖ Θ means the total expected payment set by the collector. The parameters of its initial payoff matrix are set as follows, λ is a positive integer, ϑ is a typically less than the value of the λ. The cooperation ratio of each participant in the beginning is 0, each participant’s game times is υ.
-
Algorithm 1: A cooperative game model based incentive algorithm for crowd sensing network
-
Algorithm1: A cooperative game model based incentive algorithm for crowd sensing network
-
Input: the network structure, the total expected payment
-
Output: the price λ, the total payment, the population and the number of surviving participants
-
Stage 1: initializes the network //Initialize the actions of each node.
-
1)
the number of participant is m, there are n kinds of population with different strategy, the number of participant in different population are {ν 1, ν 2, ν 3, … ν n }
-
2)
cooperation ratio c of each participant is 0, game times of each participant is υ.
-
3)
the number of participant involved in the game are ℏ
-
4)
the game generation of the whole system is ϒ, the game times for each participant is π A . ς = υ
-
5)
λ is a positive integer, ϑ is typically a less than the value of the λ.
-
6)
the total expected payment is ϖ Θ
-
1)
-
Stage 2: network evolution
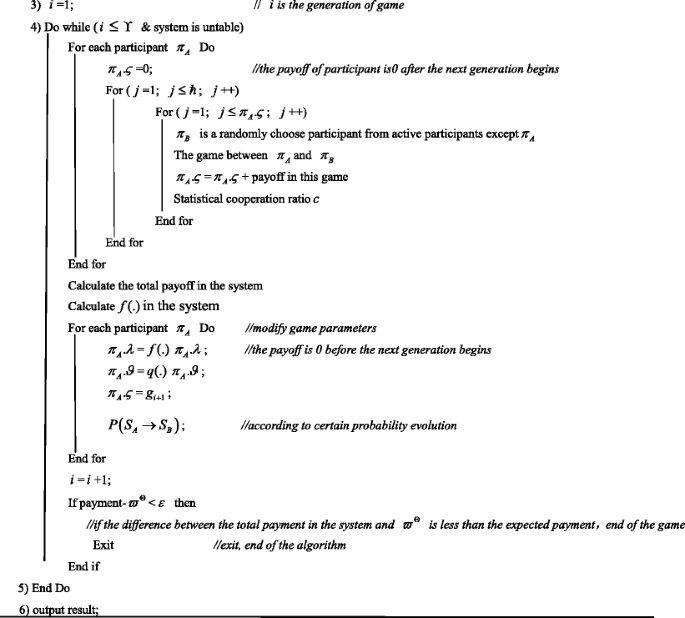

Game process is as follows: each participant randomly selects ℏ participants from the other m-1 participant, and play game with each participant of ℏ participants for υ times. This process called a generation (or round). The payoff matrix and the times of game are corrected after a round of game: each participant’s λ j i is calculated (means the payoff of the ith participant in the jth rounds of game), the payment is \( {\vartheta}_{{}_i}^j \) (means cost of the ith participant in the jth rounds of game). Then, the total payoff \( {\varpi}_{{}_{i,j}}^{total}={\lambda}_i^j-{\vartheta}_{{}_i}^j \) of the ith participant in the jth rounds of game is calculated. So the total payoff of the system \( {\varpi}_{{}_j}^{total}={\displaystyle \sum_{i=1}^m{\varpi}_{{}_{i,j}}^{total}} \) can be get. Its average payoff is: \( \overline{\varpi_j}=\left({\displaystyle \sum_{i=1}^m{\varpi}_{{}_{i,j}}^{total}}\right)/m \). The average payoff of the neighbor of the ith participant is: \( \overline{\omega_i}=\left({\displaystyle \sum_{k=1}^{\hslash }{\varpi}_{{}_{k,j}}^{total}}\right)/\hslash\ \Big|k\in i\hbox{'}s\ \mathrm{neighbor} \). The payoff matrix of each participant can be modified according to above parameters: First, λ is corrected based on the Eq. 6 according to the total payment of the system. Second, calculating the participant cooperation ratio and correct ϑ according to the Eq. 5. Third, calculate game times of each participant in the next generation of game according to the Eq. 7. The participant complete withdrawal from the participation in the game if the game times reduced to 0 (means the individual no longer participate in game). Such participant is death. Fourth, evolution on the participant according to the probability calculated from Eq. 8. After the above process finished, it is said to be a generation (round). Then, the next generation begins, until to achieve system stability or to the specify generations. Its algorithm description is given as pseudo code in Algorithm 1.
5 The experimental results and analysis
5.1 Experimental parameters settings
The experimental parameters by default: There are 500 participants in this system, λ = 5, f(.)=1, ϑ = 1, q(.) =0.5. Each participant play game with 10 randomly chooses neighbors for 100 times in the beginning of experiment. The average payoff is calculated according to the payoff matrix when participant game with its’ neighborhood. Each participant calculates the total payoff after rounds of games, then calculate game times in the next generation of game according to their payoff and the average payoff of neighbors, but if the game times is zero, the participant exit the game (or death). After the completion of the above process, we said one generation (round). Then the system calculates the value of the q(.) function according to the cooperation ratio of each participant and the value of f(.) according to the total payoff, and then the next generation begins. Above process repeat until the game reached steady state or reached the specified game generation.
5.2 The stability of the model experiment
The model stability is test firstly under different network parameters. Steady state refers to the number of the participant involved in game, the cooperation ratio, the density of participant with different strategies no longer change along with the advance of evolution (or a very small change). The total payment of the system can be stable in the given value ϖ Θ. We can see from Figs. 2, 3, 4, 5, 6, and 7: The proposed model in this paper can smoothly reach the stable state under different network parameters, which can seen from Fig. 2, when the initial price λ = 20, λ = 1.3, the payoff is bigger than the expected payment ϖ Θ at the beginning of the experiment and the value of the function f(.) is less than 1, so its price λ drop, so as to the payment of the system falling in the case of same game times. On the other hand, if the current payment for the system is less than expected payment ϖ Θ, the value of f(.) will be increase, thus the price λ rise, the total payment for the system can also be controlled to the expected value.

model can reach equilibrium state at the specified value

The number of survival participants

The ratio of cooperation

The number of total game times, cooperation times, defect times in equilibrium state

The number of survival participants for difference strategy (λ = 20)

The number of survival participants for difference strategy (λ = 1.3)
Figure 3 shows is that the case of the number of the survival participants as the evolution of the system. We can be seen from Fig. 3, the overall trend is that the number of survival participants is declining with the evolution of the system. The reason is that participants are no longer to participate in the game (which can be considered as death) once the game times of a participant is zero in our model. For that reason the number of survival participants is always down in the system. And competition is more intense when the payment for the system is greater than a predetermined ϖ Θ, the higher the mortality ratio of the participant. In Fig. 3, the number of survival participants fell sharply in the early of the system, and there is little participant death in the process of competition when the system is stable. In our experiments, there are 5000 generations of game from 10,000 to 15,000 generations. The number of participants drop is only five when the system is stable. On the other hand, the difference between the total payment and the expected payment ϖ Θ for the system is large when the price λ is high, the competition of the system is intense when price λ make larger adjustments, and therefore lead to death of the participant is more, so we can seen from Fig. 3 that the survival participants fall faster.
Figure 4 shows the cooperation ratio of the model in each round game. Figure 4 shows: (a) system cooperation ratio is about 80% in steady state; (b) it does not necessarily to achieve a higher cooperation ratio when the initial price λ is high. The cooperation ratio with higher initial price λ is slightly lower than that of with lower initial price λ because of the fierce competition. (c) In practice, due to different participant with different strategy and the limited payoff, it is inappropriate that only adopt incentive strategy to increase cooperation ratio. Our model demonstrates that: cooperation ratio is not the ultimate goal for incentive strategy, the main issue should pay attention to how to make the cooperation rate maximization under condition of a given total payment, which is more consistent with the practice of CSNs. Figure 5 shows the number of cooperation game, the number of defect game with different initial price λ.
When initial price λ different, it is an interesting topic that what kind of strategies is more competitive. We investigate the 16 strategies distributions in well-mixed population. When initial price agents λ different (Figs. 6 and 7), dominating strategies almost no change. There are four strategies dominate the game (‘ 1001 ’, ‘0111’, ‘1101’, ‘1000’), the most competitive strategy in these strategies is WSLS strategy (‘ 1001 ’)
5.3 The influence of network parameters of the model
Figures 8 and 9 shows the different evolution game speed have effect on the model. from the result of the experiment, when the evolution velocity is adopted as Eq. 8, the total payment for the system were higher than the predestinate payment in the beginning of the game, then fell to the stable value of ϖ Θ sharp. If the evolution velocity is 0.1 times than the evolution velocity calculated according to Eq. 8. The payment for the system more stable closer to a predetermined value ϖ Θ. The model can reach stationary point at faster velocity (about 200 generations) under different evolution velocity. In terms of the number of surviving participants, the larger evolution velocity is, the less the number of surviving participants (Fig. 10). The reason is that the strategy with the competitive advantage will dominate the network at faster velocity when the evolution velocity is big, other disadvantaged strategy will die at faster velocity, which leads to the survival participant fewer (see from Fig. 10). It does not affect the speed of the model to reach in a stable state when using different payoff (Fig. 11).

The total payment (The generations of game is 4000)

The total payment (The generations of game is 400)

The number of survival participants

The total payment with difference ϑ
5.4 Model optimization
(1) Whether the number of participants involved in the game have influence on the proposed model is also an interesting topic. We investigate this issue through a series of experiments (Figs. 12, 13, 14, 15, 16, and 17). First, when the number of participants increases, the cooperation ratio for the system significantly decreased due to the increase of competition, but it is still higher than payment in the condition of insufficient payment (Fig. 12). Second, the number of cooperation games in the system, the total number of game will be rise as the system increases the total number of participants (Figs. 13 and 14), the number of defect game in the system grows faster, so as to make the system cooperation ratio decline. Third, the number of surviving participants will also grows with the growth in the total number of participants involved in the game (Fig. 15). But the total payment of the system had little influence on the number of the surviving participants (Fig. 15). And WSLS strategy with strong competition ability is also little relationship with the number of participants (Fig. 16). Fourth, the price λ for the system have obvious relationship with the number of participants, the more participants involved in, the lower the price λ (Fig. 17) and the more the total payment of the system, the higher the price λ (Fig. 17). This shows that our model better reflect the situation.

The ratio of cooperation in stability state under difference initial participants

The times of cooperation in stability state under difference initial participants

The times of game in stability state under difference initial participants

The number of survival participants in stability state under difference initial participants

The number of survival participants of WSLS strategy in stability state under difference initial participants

The price λ in stability state under difference initial participants
(2) This section discuss that whether the different total payment of the system have effect on the proposed model. The same as the previous analysis, the system raises its price λ with the total payment growth (Fig. 18), the system cooperation ratio increases at the same time (Fig. 19). For that reason increasing the payment for the system can promote the cooperation for the system. But the number of surviving participants and the currency game times are not growth as the total payment to grow (Figs. 20 and 21). The reason is the price λ for the system and the cooperation ratio are increase with the total payment growth. The number of surviving participants and the cooperation game times don’t need to growth also can make the payment to the specified value.

The price λ in stability state under difference total payment

The ratio of cooperation in stability state under difference total payment

The number of survival participants in stability state under difference total payment

The times of cooperation game in stability state under difference total payment
(3) In this section, we make experiments to further explore the role of 16 strategies with initial difference distribution density in well-mixed population. We can see from the previous experiments, WSLS strategy has a good competitiveness, so we are interested in: in the beginning of the experiment, if the density of participant with the WSLS strategy in population is different, whether have influences on the participants with other strategy. To our great surprise: In the experiment, the initial density of participant with WSLS strategies in population has no effect on game strategy. In the experiments, the density of WSLS strategy in population is set from 1/16 to 7/22, the density of the other 15 kinds of strategy are the same, the total payment for the system is 1,000,000. We can see from the result of the experiment, when the system is stability in the different initial density of WSLS strategy (Fig. 22), the price λ for the system, the number of survival participants (Fig. 23), the ratio of WSLS (Fig. 24), The ratio of cooperation (Fig. 25) have little effect. This shows that only increasing number of participants with advantage strategy will not affect the result of the game overall system in certain cases.

The price λ in stability state under difference initial density of WSLS strategy

The number of survival participants in stability state under difference initial density of WSLS strategy

The ratio of WSLS in stability state under difference initial density of WSLS strategy

The ratio of cooperation in stability state under difference initial density of WSLS strategy
(4) Many game models think that price λ and cost ϑ play an important role in the game. However, a lot of real economic phenomena and market rules show that the product price is mainly affected by supply and demand, not the pricing decision. Therefore a good model should reflect this situation. As can be seen from the experimental results of Fig. 26, regardless of initial ratio of price λ over cost ϑ in the system, its price is almost equal when the system reaches a steady state under the condition of the certain total payment. There is a close relationship between λ and the number of the participant involved in the game, when the number of participants is big enough, the value of λ is small, while the number of participants is small, the value of λ is big. In fact, the participant is the provider of information, the more information supplied, the lower the price λ. This shows that the model in this paper can simulate the real situation better. We can be seen from Figs. 27, 28, 29, and 30, when the system to reach stability, the number of survive participants, the number of surviving participant of WSLS strategy, the times of game have little change with the change of initial ratio of price λ over cost ϑ. The presented model in this paper more realistic depicts the game phenomenon in CSNs. The same as the previous experiment points out, as initial ratio of price λ over cost ϑ growth, higher payoff don’t to promote cooperation, the cooperation ratio become a downward trend (Fig. 30).

The price λ in stability state under difference initial ratio of payoff over cost

The number of survive participants in stability state under difference initial ratio of payoff over cost

The number of survive participant of WSLS strategy in stability state under difference initial ratio of payoff over cost

The times of games in stability state under difference initial ratio of payoff over cost

The ratio of cooperation in stability state under difference initial ratio of payoff over cost
6 Conclusion
In this work, we study how to depict the game relationship between the collector and participants, and the evolution game model among participants in crowd sensing network. An evolutionary game model is proposed to depict collaborative game phenomenon in the crowd sensing networks based on the principles of game theory in economics. A effectively incentive mechanism is established through corrected the penalty function of the game model accordance with the cooperation rates of the participant, and corrected the game times in accordance with it’s payoff. We demonstrate that proposed model can better depict the game relationship of crowd sensing network based on the result of lots of experiments. The game model can rapid evolution to a stable state under the condition of any given system parameters, so as to get optimize payoff matrix. Through the model, we can predict in advance what kind of population will be involved in the game, the average payoff for each participant, each participant’s game times, and cooperation ratio for the system, which provide a good decision support for the manager decision.
References
Sun J, Ma H (2014) Heterogeneous-belief based incentive schemes for crowd sensing in mobile social networks. J Netw Comput Appl 42:189–196
Hoteit S, Secci S, Sobolevsky S et al (2014) Estimating human trajectories and hotspots through mobile phone data. Comput Netw 64:296–307
Mianxiong D, Kimata T, Sugiura K et al (2014) Quality-of-Experience (QoE) in emerging mobile social networks[J]. IEICE Trans Inf Syst 97(10):2606–2612
Ota K, Dong M, Cheng Z et al (2012) ORACLE: Mobility control in wireless sensor and actor networks. Comput Commun 35(9):1029–1037
Dong M, Ota K, Li X, et al (2011) HARVEST: A task-objective efficient data collection scheme in wireless sensor and actor networks. Communications and Mobile Computing (CMC), 2011 Third International Conference on. IEEE pp 485–488
Thiagarajan A, Ravindranath L, LaCurts K, et al (2009) VTrack: Accurate, energy-aware road traffic delay estimation using mobile phones[C]. Proceedings of the 7th ACM Conference on Embedded Networked Sensor Systems. ACM pp 85–98
Maisonneuve N, Stevens M, Niessen ME, et al (2009) NoiseTube: Measuring and mapping noise pollution with mobile phones[M]. Information Technologies in Environmental Engineering. Springer, Berlin Heidelberg pp 215–228
Tham CK, Luo T (2014) Fairness and social welfare in service allocation schemes for participatory sensing. Comput Netw 73:58–71
Wu W, Ma RTB, Lui JCS (2014) Distributed caching via rewarding: An incentive scheme design in P2P-VoD Systems. IEEE Trans Parallel Distributed Systems 25(3):612–621
Li S, Huang J (2014) Price differentiation for communication networks. IEEE/ACM Trans Networking 22(3):703–716
Chorppath AK, Alpcan T (2013) Trading privacy with incentives in mobile commerce: A game theoretic approach. Pervasive Mob Comput 9(4):598–612
Chen ZG, Wang T, Xiao DG et al (2013) Can remembering history from predecessor promote cooperation in the next generation? Chaos, Solitons Fractals 56:59–68
Jiang G, Ma F, Shang J et al (2014) Evolution of knowledge sharing behavior in social commerce: An agent-based computational approach. Inf Sci 278:250–266
Robert Ad, William DH (1981) The evolution of cooperation. http://www.life.umd.edu/faculty/wilkinson/BIOL608W/Axelrod&Hamilton81.pdf
Robbins H (1985) Some aspects of the sequential design of experiments. Herbert Robbins Selected Papers. Springer, New York, pp 169–177
Nowak M, Sigmund K (1993) A strategy of win-stay, lose-shift that outperforms tit-for-tat in the Prisoner’s Dilemma game. Nature 364(6432):56–58
Smith JM, Price GR (1973) The logic of animal conflict. Nature 246:15
Ghergulescu I, Muntean CH (2014) A novel sensor-based methodology for learner’s motivation analysis in game-based learning. Interact Comput 26(4):305–320
Chen J, Kiremire AR, Brust MR et al (2014) Modeling online social network users’ profile attribute disclosure behavior from a game theoretic perspective. Comput Commun 49:18–32
Wu TY, Lee WT, Guizani N et al (2014) Incentive mechanism for P2P file sharing based on social network and game theory. J Netw Comput Appl 41:47–55
Liu G, Ji S, Cai Z (2014) Strengthen nodal cooperation for data dissemination in mobile social networks. Pers Ubiquit Comput 1–15
Chun-Mei GUI, Qiang JIAN, Huai-Min WANG, Quan-Yuan WU (2010) Repeated game theory based penalty-incentive mechanism in internet-based virtual computing environment. J Softw 21(12):3042–3055
Liu F, Li X, Ding Y et al (2013) A social network-based trust-aware propagation model for P2P systems. Knowl-Based Syst 41:8–15
Tian C, Yang B (2014) A DS evidence theory based fuzzy trust model in file-sharing P2P networks. Peer-to-Peer Netw Appl 7(4):332–345
Chen BB, Chan MC (2010) Mobicent: A credit-based incentive system for disruption tolerant network. 2010 Proceedings IEEE INFOCOM pp 1–9
Ning T, Yang Z, Xie X, et al (2011) Incentive-aware data dissemination in delay-tolerant mobile networks. 8th Annual IEEE Communications Society Conference on Sensor, Mesh and Ad Hoc Communications and Networks (SECON) pp 539–547
Okaie Y, Nakano T (2013) Resource pricing games on graphs: Existence of Nash equilibria. Optim Lett 7(2):231–240
Liu A, Zhang D, Zhang P et al (2014) On mitigating hotspots to maximize network lifetime in multi-hop wireless sensor network with guaranteed transport delay and reliability. Peer-to-Peer Netw Appls 7(3):255–273
Liu A, Jin X, Cui G et al (2013) Deployment guidelines for achieving maximum lifetime and avoiding energy holes in sensor network. Inf Sci 230:197–226
Liu Y, Liu A, Chen Z (2014) Analysis and improvement of send-and-wait automatic repeat-reQuest protocols for wireless sensor networks. Wirel Pers Commun 1–37. doi:10.1007/s11277-014-2164-6
Zaki M, Athman B (2009) Reputation bootstrapping for trust establishment among web services. IEEE Internet Comput 13(1):40–47
Acknowledgments
This work was supported by the National Natural Science Foundation of China (61379110, 61073104, 61272494, 61272149), the National Basic Research Program of China (973 Program) (2014CB046305), JSPS KAKENHI Grant Number 25880002, 26730056, JSPS A3 Foresight Program.
Ethical statement
On behalf of, and having obtained permission from all the authors, I declare that:
(a) The material has not been published in whole or in part elsewhere;
(b) The paper is not currently being considered for publication elsewhere;
(c) This study is not split up into several parts to increase the quantity of submissions and submitted to various journals or to one journal over time (e.g. “salami-publishing”).
(d) No data have been fabricated or manipulated (including images) to support our conclusions
(e) All authors have been personally and actively involved in substantive work leading to the report, and will hold themselves jointly and individually responsible for its content;
(f) No data, text, or theories by others are presented as if they were the author’s own (“plagiarism”). Proper acknowledgements to other works have been given.
(g) All relevant ethical safeguards have been met in relation to patient or subject protection, or animal experimentation.
Conflict of interest
There are not potential conflicts of interest.
Author information
Authors and Affiliations
Corresponding author
Rights and permissions
About this article

Cite this article
Liu, X., Ota, K., Liu, A. et al. An incentive game based evolutionary model for crowd sensing networks. Peer-to-Peer Netw. Appl. 9, 692–711 (2016). https://doi.org/10.1007/s12083-015-0342-2
Received:
Accepted:
Published:
Issue Date:
DOI: https://doi.org/10.1007/s12083-015-0342-2