
Abstract
The effects of the temperature and agitation time of the complexing agent on the structural, morphological, compositional, and optical properties of SnS films deposited by chemical bath deposition (CBD) have been studied. The properties of the thin films were studied by X-ray diffraction (XRD) analysis, X-ray fluorescence spectroscopy, atomic force microscopy, and ultraviolet–visible–near infrared (UV–Vis–NIR) spectroscopy. The XRD results confirmed formation of polycrystalline films with orthorhombic phase. The best thin film was formed when using an agitation time of the complexing agent of 16 min, resulting in a maximum crystallite size of 8.26 nm, lattice parameters close to reported values (a = 4.30 Å, b = 10.55 Å, and c = 3.89 Å), and a calculated bandgap of around 1.65 eV. Investigation of the trend with deposition temperature indicated that values between 40°C and 45°C during CBD were better. Variation of the deposition temperature resulted in crystallite sizes ranging from 5 nm to 25 nm and bandgap values from 1.62 eV to 1.66 eV.
Introduction
In recent decades, researchers have devoted efforts to the search for environmentally friendly semiconductor materials that are nontoxic, inexpensive, and Earth abundant, amongst which copper zinc tin sulfide (CZTS) has been studied as an alternative. Nevertheless, several elements make these materials difficult to develop due to the multiple phases that can form, including Cu2–xS, ZnS, CuS, Cu2SnS3, and Sn2S3.1,2,3
Metal sulfide (chalcogenide) semiconductors have been studied for use in various applications such as absorbent and windows layers, sensors, and optoelectronic devices. Among the most widely studied in recent years are ZnS, Sb2S3, CuS, SnS, PbS, and CdS, deposited by using different physical and chemical methods. Thin films of less complicated materials, such as SnS, have exhibited suitable properties that allow their categorization as promising light-absorbing materials for use in optoelectronic devices such as solar cells,4 near-infrared photodetectors,5 semiconductor sensors,6 and others. SnS films can grow with cubic or orthorhombic structure,7,8,9 with energy bandgap values between 1.14 eV and 1.8 eV7,8,10 and absorption coefficients of ~ 104 cm−1.11 SnS films have also been deposited by using different techniques such as thermal evaporation,12 electrodeposition,13 spin coating,14 sputtering,15 chemical bath deposition,7,9,11 and spray pyrolysis,16 among others. Solars cells with maximum conversion efficiency of 4.36% and 1.28% have been reported for the orthorhombic17 and cubic18 structure, respectively.
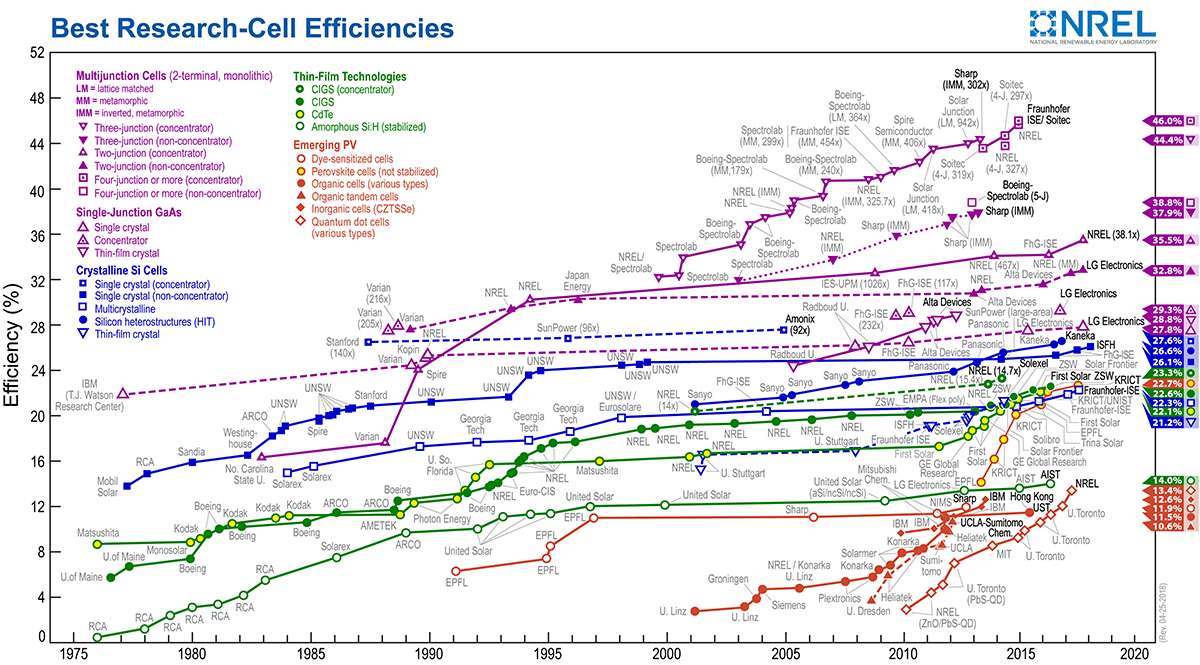
Several materials for use in solar cells such as silicon (Si), CdTe, and CIGS have been studied for years, having the widest presence on the market and efficiency of about 27.6%, 22.1%, and 22.6%, respectively.19,20,21,22 However, these materials are scarce and have high cost, as well as containing toxic elements. The low efficiency of solar cells based on SnS thin films may be due to recombination of photogenerated charge carriers, grain boundaries, and high series resistance.23 Various studies have been carried out on these films to address these defects, including studies on the effects of heat treatment to decrease recombination due to grain growth.24 In addition, other studies have analyzed the influence of the sulfurization time on SnS thin films,25 the effect of temperature on the thickness,9 the deposition time,10 the effect of the solution pH,26 and the effect of the concentration of the complexing agent and its variants.27,28,29,30
Triethanolamine (TEA) has been used as a complexing agent during the production of SnS thin films. A study on the TEA concentration reported its effects on the energy bandgap and optical properties.31,32 Also, other investigations have been conducted on the effects of the amount of TEA on the morphology and phase of SnS thin films.33
However, the effects of the agitation time of the complexing agent with the tin precursor during chemical bath deposition have not been studied. The aim of the complexation is to trap metal ions in the chemical bath then gradually release them. This process is very important because these compounds are highly insoluble and thus precipitate quickly. In the work presented herein, we investigated the effects of its parameters on the SnS thin films, including their structural, morphological, compositional, and optical characteristics, as well as the effects of the deposition temperature on the best agitation time for the complexing agent.
Experimental Procedures
SnS Thin-Film Deposition
SnS thin films were deposited by chemical bath deposition (CBD) using SnCl2·5H2O and Na2S2O3 (Meyer brand) as Sn and S sources, respectively. To prepare the chemical bath, 1 g SnCl2 in 5 ml acetone, 12 ml triethanolamine at 3.7 M, 70 ml deionized water, 8 ml Na2S2O3 at 0.5 M, and 5 ml NH4OH at 8 M were used.
A deposition time of 5 h at 35°C and pH ~ 11 was used throughout the process for the thin-film preparations. The substrates were washed with alkaline soap and deionized water, then air-dried. Subsequently, the substrates were placed vertically in the chemical bath solution. Deposition was only carried out on the side of the substrate near the vessel wall. After deposition had completed, the SnS thin films were washed with deionized water then air-dried at room temperature.
SnS Thin-Film Characterization
For XRD measurements, a RIGAKU X-ray diffractometer ULTIMA IV with Cu-Kα radiation (1.5418 Å) and Ni filter was used. The measurement mode was parallel beam (0.5°), 2θ, with a scanning speed of 5°/min. The diffraction patterns obtained were analyzed using PDXL software. The morphology of the SnS thin films was analyzed by atomic force microscopy (AFM, XE7 Park Systems) in noncontact mode. These images were also used to determine the roughness of the films. For optical transmittance measurements, a Shimadzu UV–Vis–NIR UV 3600 spectrometer was used in the wavelength range from 1650 nm to 250 nm. The composition of the SnS thin films was measured by X-ray fluorescence (XRF) spectroscopy (Supermini 200; Rigaku).
Results
This section presents the results regarding the agitation of the complexing agent and the deposition temperature in the chemical bath, including characterization of the structural, compositional, morphological, and optical properties. All the results were analyzed and compared with the obtained better SnS thin films.
Agitation Time of Complexing Agent
The first parameter studied was the agitation time of the complexing agent (TEA) during the preparation according to the method described in Sect. “SnS Thin-Film Deposition”. Agitation times from 1 min to 20 min were adopted to study their effect on the properties of the (optimized) SnS thin films. Figure 1 shows the X-ray diffraction patterns of the samples obtained using different TEA agitation times. It is observed that, for all films, the diffraction peaks matched Joint Committee on Powder Diffraction Standards (JCPDS) card no. 39-0354, corresponding to SnS with orthorhombic structure. The formation of a small amount of binary compound was observed for the thin films obtained using agitation times of 1 min and 20 min (Fig. 1a, f); this is because the deposition on the substrate was poor. On the other hand, the diffractogram for the SnS thin film obtained using an agitation time of 4 min (Fig. 1b) showed peaks corresponding to (1 1 0), (1 2 0), (1 0 1), and (1 4 1) planes. Figure 1c shows the SnS thin film obtained using an agitation time of 8 min, revealing the appearance of a peak corresponding to (1 3 1) plane. More well-defined peaks with low intensities were also observed, which can be attributed to the greater thickness of the thin film.8

X-ray diffractograms of SnS thin films obtained using complexing agent agitation times of (a) 1 min, (b) 4 min, (c) 8 min, (d) 10 min, (e) 16 min, and (f) 20 min.
The XRD pattern of the SnS thin film obtained using an agitation time of 10 min (Fig. 1d) shows the appearance of a peak located at 2θ = 42.51°, corresponding to (2 1 0) plane. Figure 1e shows the results for the sample obtained using an agitation time of 16 min, revealing more well-defined peaks located at 2θ values of 26.42° and 30.76°, which correspond to (1 2 0) and (1 0 1) planes, respectively. Additionally, the appearance of another peak corresponding to (1 1 1) plane located at Bragg angle of 31.66° may possibly be due to the higher crystallinity of the thin film.
A simplified reaction mechanism for the growth of the SnS films is given below. Na2S2O3 is a reducing agent by nature.9
It is known that Sn2+ ions form bonds with the complexing agent (TEA) ligand to form [Sn(TEA)]2+ first during the deposition, preventing unwanted precipitation. The complex breaks to form bonds with S2− ions, while the SnS compound forms in a subsequent stage.10
Table I presents the crystallite size, microstrain, dislocation density, and lattice parameters calculated for the samples obtained using different agitation times. The crystallite size and microstrain were calculated from the XRD results using the Williamson–Hall method according to the equation
where k is the shape factor (usually taken to be 0.9), λ is the X-ray wavelength (1.5418 Å for Cu Kα radiation), β is the angular line-width at half-maximum intensity, and θ is the Bragg angle in degrees. From a linear fit of βcos θ versus 4sin θ, it is possible to calculate the strain values (ε) and crystallite size (D) from the slope and intercept, respectively. The dislocation density (δ) can be obtained from the crystallite size data calculated from the X-ray diffraction pattern, according to the equation34,35:
The dislocation density provides direct information on the defects in the crystal structure. The dislocation density is defined as the length of the dislocation lines per unit volume of crystal, with higher values indicating lower crystallinity of the film. It is clearly seen that the dislocation density decreased for larger crystallite size values.
The smallest crystallite sizes were obtained when using the times of 1 min and 20 min, due to the poor uniformity of the deposition; the films obtained using times of 4 min, 8 min, and 10 min showed values close to ~ 6.7 nm. The highest value (about 8.26 nm) was found when using 16 min. The microstrain and dislocation density are related to lattice imperfections; high values for these parameters are associated with more imperfections. The results presented in Table I show that, if the crystallite size increases, both the microstrain and density dislocation decrease due to the relationship between the dislocation density and crystallite size. Therefore, the thin film with the least imperfections was found when using the agitation time of 16 min. The lattice parameters for all the samples were evaluated based on the experimental XRD results:
The lattice parameter values reported in the JCPDS card are a = 4.33 Å, b = 11.19 Å, and c = 3.98 Å for the orthorhombic structure. The agitation times yielding values closest to these lay between 8 and 16 min.
The texture coefficient TC(hkl) was calculated to provide information on the plane orientation. The TC was calculated using the equation
where I0(hkl) is the standard intensity from the JCPDS card, I(hkl) is the intensity observed for the hkl plane, and n is the number of diffraction peaks. If the coefficient has a value of unity, the crystallite presents random orientation, whereas if TC > 1, a larger number of crystallites are oriented along the hkl direction.12,36 Figure 2 shows the variation of the texture coefficient for the (1 2 0) and (1 0 1) planes. Note that, at the extremes, preferential orientation of the films is not observed as they were not uniform. However, when using agitation times of 4 min to 16 min, a larger amount of crystallites in the (1 2 0) plane were observed, with higher values when using 10 and 16 min. On the other hand, the (1 0 1) plane did not show a clear trend with the complexing agent agitation time.

Variation of texture coefficient of SnS thin films with complexing agent agitation time.
Figure 3 shows the composition (at.%) of the SnS thin films, revealing that the values closest to stoichiometry were obtained when using times of 4 min, 10 min, and 16 min, with the latter yielding the closest of all, albeit with excess Sn. This figures also shows the compositional dispersion of the thin films. Note that the thin films obtained using agitation times of 1 min, 8 min, and 20 min showed the values furthest from the stoichiometric composition. The thin film obtained after 1 min was the least favorable, due to the lack of uniformity in this deposit. When using 20 min, the composition was lost, which can attributed to the low thickness of the film.

Composition (at.%) versus complexing agent agitation time for the SnS thin films.
Figure 4 shows AFM images of the SnS thin films obtained using different agitation times for the complexing agent. All the images reveal that the grain shape was spherical. The films obtained using 1 min, 8 min, 10 min, and 16 min (Fig. 4a, c–e) showed some surface cracks, whereas the films obtained using times between 4 min and 16 min (Fig. 4b–e) exhibited agglomerations and a more compact surface. However, the film obtained using 20 min (Fig. 4f) was observed to be granulated without agglomeration.

Two-dimensional (2D) and three-dimensional (3D) AFM results for SnS thin films obtained using different agitation times of the complexing agent: (a) 1 min, (b) 4 min, (c) 8 min, (d) 10 min, (e) 16 min, and (f) 20 min.
The grain size and roughness of all the SnS thin films are presented in Table II. The root-mean-square (rms) roughness parameter can be used to describe the surface roughness, providing a measure of the standard deviation of the surface height profile from its average.37 The rms values obtained for the SnS thin films lay between 30.2 nm and 152.5 nm; the lowest value may be due to a thinner layer, since this thin film did not have uniform deposition. For SnS thin films with greater thickness, the grains form alloys or agglomerations between them. The SnS thin film with the largest grain size (288.58 nm) was obtained when using 16 min (Table I), and the crystallite size for this SnS thin film was 8.26 nm, indicating that ~ 35 crystallites form a grain. A small increase in the grain size of the SnS thin films was observed with increasing agitation time, except at the extremes, where the films did not show good uniformity and deposition.
It was also observed that, if the grain size increased, the surface roughness of the thin film was higher. Such a trend has also been reported by other authors.32,38 Nevertheless, this trend was not followed by the film obtained using 16 min, which may be because of how the grains agglomerated on its surface.
Figure 5a shows the transmittance spectra of the SnS thin films, revealing that the absorption wavelength of the samples obtained using agitation times of 1 min and 20 min was ~ 600 nm, while the values for the other thin films ranged from 700 nm to 750 nm. The optical absorption coefficient (α) of the thin films at different wavelengths was calculated from the transmittance.39 The energy bandgap (Eg) of the SnS thin films (Fig. 5b, inset) were determined from the absorption bandgap fundamentals using the equation40
where A is a constant, Eg is the energy gap, and hv is the photon energy. In Eq. 5, n depends on the nature of the transition, being 1/2 and 3/2 for allowed direct and forbidden direct transitions, respectively, but 2 and 3 for allowed indirect and forbidden indirect transitions, respectively. The energy bandgap value was estimated by extrapolating a straight line to the photon energy axis and assuming that α = 0 in Eq. 5.

Optical analysis of SnS thin films obtained using different agitation times from 1 min to 20 min: (a) optical transmittance and (b) energy bandgap. Inset shows calculated bandgap.
Figure 5b shows the energy bandgap values calculated for the thin films obtained using different agitation times of the complexing agent. The values of 1.7 eV, 1.72 eV, and 1.65 eV calculated for the films obtained using agitation times of 4 min, 8 min, and 16 min lie within those reported for orthorhombic SnS thin films.10 Besides, the thin films with higher bandgap values can be attributed to nonuniform deposits on the substrate. The thin film obtained using an agitation time of 10 min showed an energy bandgap value of 1.81 eV at the reported limit, possibly due to the low crystallite size observed in the XRD results, which results in the large energy bandgap.41
The energy gap values for the thin films cover a wide energy range. According to literature, the Eg value depends on the degree crystallinity, the crystallite size, and the stoichiometry of the thin film.
Therefore, low crystallinity results in a higher Eg value. Therefore, a low stoichiometric ratio (Sn/S value) will result in a larger crystallite size, which induces a lower Eg value.41
Deposition Temperature
Figure 6 shows the XRD results for the SnS thin films deposited at temperatures in the range from 35°C to 50°C. We also studied deposits formed at room temperature and 30°C, but no material formed on the surface. However, the film deposited at 35°C (Fig. 6a) presented well-defined higher-intensity peaks corresponding to the orthorhombic structure. Figure 6b and c show that the films deposited at 40°C and 45°C presented the same diffraction peaks, while for the film deposited at 45°C, the peaks were located at Bragg angles of 26.56° and 30.78° corresponding to (1 2 0) and (1 0 1) planes, respectively, in JCPDS card 39-0354 for the orthorhombic structure, with greater intensity, despite the lower uniformity of these deposits.

XRD patterns of SnS thin films deposited at (a) 35°C, (b) 40°C, (c) 45°C, and (d) 50°C.
Figure 6d shows the film deposited at 50°C, with decreased peak intensity, which can be attributed to the degraded uniformity resulting from the fast precipitation of material in the chemical bath. In summary, these results reveal that the crystallinity of the films increased with increasing deposition temperature from 35°C to 45°C.
Table III presents the crystallite size, microstrain, dislocation density, and lattice parameters of the films deposited at different temperatures from 35° to 50°C. The film deposited at 40°C showed the largest crystallite size with a value of 24.82 nm, but the crystallite size decreased to 5.28 nm as the temperature was increased from 45°C to 50°C. On the other hand, the microstrain and dislocation density of the thin films deposited at temperatures in the range from 35°C to 45°C showed low values, with the best film deposited at 40°C showing values of 0.006 and 1.62 × 1011 cm−1, respectively. However, the thin film deposited at 50°C showed a high value, which may be due to lattice deformation.
The lattice parameters of the SnS thin films deposited at temperatures between 35°C and 45°C remained close to those reported in JCPDS card 39-0354, while the thin film deposited at 50°C showed the highest values because the deposit was not uniform. The thin film deposited at 40°C showed the values closest to the reported values, with a = 4.22 Å, b = 11.11 Å, and c = 4.02 Å.
Figure 7 shows the variation of the texture coefficient TC(khl) of the (1 2 0), (1 0 1), and (1 1 1) planes of the thin films deposited at different temperatures. Greater (1 2 0) orientation was observed for the thin films deposited at 35°C at 40°C, albeit similar to the values for the films deposited at the other temperatures. Likewise, a relation with the crystallite size can be seen: the large the crystallite size, the greater the preferential orientation of the SnS thin films.

Texture coefficient for SnS thin films deposited at different temperatures.
The texture coefficients for the (1 0 1) and (1 1 1) planes showed a decreasing trend as the preferential orientation increased in the (1 2 0) plane. Therefore, with increasing temperature, preferential orientation along the (1 2 0) plane occurred for the SnS thin films, but with little variation after 40°C.
Figure 8 shows the composition (at.%) of the SnS thin films deposited at different temperatures. Note that the temperature of the film deposited at 35°C was the closest to stoichiometric. Furthermore, note that increasing the deposition temperature increased the tin content but decreased the sulfur content of the thin films, possibly because of a release of Sn2+ ions from the complexing agent, resulting in the deposition of a thin film with higher Sn content. Heat treatment is therefore necessary to achieve recrystallization of such SnS thin films.

Composition (at.%) of SnS thin films deposited at different temperatures.
Figure 9 shows AFM images of the SnS thin films deposited at different temperatures from 35°C to 50°C. Figure 9a shows a compact surface, with agglomerations, some cracks, and a grain size of 288.58 nm, the highest value among these films. It is observed that the film deposited at 40°C (Fig. 9b) was not very compact, exhibiting some agglomerations, cracks, deep holes, and a grain size of 278.56 nm. Figure 9c shows that the film deposited at 45°C had deep zones in the nether part with a grain size of about 215.94 nm, while the grain shape was spherical and the surface was cracked with agglomerations, lacking uniformity. Note that the film deposited at 50°C showed the smallest grain size with a value of 204.62 nm (Fig. 9d).

2D and 3D AFM results for SnS thin films deposited at different temperatures: (a) 35°C, (b) 40°C, (c) 45°C, and (d) 50°C.
Table IV presents the grain size and roughness results for the SnS thin films deposited at different temperatures. A tendency is observed between the grain size and temperature: as one decreases, so does the other. The films deposited at temperatures from 35°C to 50°C showed rms values from 108.19 nm to 127.92 nm. The lowest rms value of 108.19 nm was obtained for the film deposited at 40°C due to the cracks in the surface morphology, and the grain size was 278.76 nm.
Figure 10a shows the transmittance spectra of the SnS thin films. Note that the films deposited at 35°C showed higher transmittance and absorption at lower wavelengths, while those deposited at 45°C and 50°C exhibited similar behavior. The film deposited at 40°C showed low transmittance and absorption at higher wavelengths. The optical absorption coefficient at different wavelengths was calculated using the optical transmittance. The inset in Fig. 10b shows the energy bandgap (Eg) calculated at different temperatures using Eq. 5.

Optical analysis of SnS thin films deposited at different temperatures from 35°C to 50°C: (a) optical transmittance and (b) energy bandgap. Inset shows calculated bandgap.
All the films showed energy bandgaps within the values reported in literature (Fig. 10b), with a minimum of 1.62 eV for the film deposited at 40°C. The temperature did not greatly affect the energy bandgap of the SnS thin films because the values were very similar, ranging from 1.62 eV to 1.66 eV. As discussed above, the optical properties may vary because of the combined effects of several factors including crystallite size, degree of crystallinity, defects, and growth kinetics.42 Note that, if the crystallite size increases (as indicated by a narrower X-ray peak), the bandgap decreases.
Conclusions
The effect of the agitation time of the complexing agent with the metallic precursor Sn (SnCl2·2H2O) on the chemical bath deposition of SnS thin films has been studied. The results reveal that the triethanolamine (TEA) ligand bonds to form a complex with Sn2+ in the form [Sn(TEA)]2+ first during the deposition, thereby preventing precipitation. According to the characterization of their structural, morphological, and optical properties, the best film was obtained when agitating for 16 min. Further study of the effect of the deposition temperature at these conditions revealed that the best film was obtained at 40°C.
XRD analysis of the effect of the agitation time of the complexing agent (TEA) on the SnS thin films obtained by chemical bath deposition revealed the formation of polycrystalline films with orthorhombic structure. Study of their structure revealed that, with increasing crystallite size, the lattice imperfections decreased. The texture coefficient results indicated that, as the agitation time was prolonged from 4 min to 16 min, the amount of crystallites oriented in the (1 2 0) plane also increased, reaching the highest values for the films obtained using 10 min and 16 min. The optical study revealed that, when the crystallite size of the thin films decreased, the energy bandgap increased in the range from 1.65 eV to 2.18 eV. The composition was not stoichiometric, but the values were similar to those reported in literature. AFM imaging showed that the thin films had spherical grains. Increasing the agitation time to 16 min increased the grain size by about 288 nm. Higher roughness values of 152 nm and 128 nm were measured for the thin films obtained with agitation times of 8 nm and 16 min, respectively. In this work, the best SnS thin film was deposited by CBD with an agitation time of 16 min, according to the XRD results, exhibiting better crystallinity, crystallite size of 8.26 nm, and lattice parameters of a = 4.30 Å, b = 10.55 Å, and c = 3.89 Å. The optical properties showed a bandgap of 1.65 eV, close to reported values.
In the study of the deposition temperature, the crystallite size decreased to 5.28 nm as the temperature was increased from 45°C to 50°C. The film deposited at 40°C showed the largest crystallite size with a value of 24.82 nm. Texture coefficient calculations showed that, at 40°C and 45°C, the amount of crystallites oriented in the (1 2 0) plane was higher while the (1 1 1) and (1 0 1) planes decreased. The energy bandgap did not show changes, lying in the range from 1.62 eV to 1.66 eV for all the temperatures. Compositional analysis revealed that the deposited thin films had higher Sn content when the temperature was increased. AFM revealed thin films with spherical grains. It was observed that increasing the deposition temperature decreased the grain size of 288 nm to 205 nm. The lowest roughness of 108 nm was obtained at 40°C. The thin films deposited at 40°C showed better crystallite size, lattice parameters, and roughness, texture coefficient, energy bandgap (1.62 eV), and grain size of 278 nm. In further study, recrystallization of such SnS thin films by thermal annealing will be investigated.
References
O. Awadallah and Z. Cheng, Sol. Energ. Mater. Sol. C. 176, 222 (2018). https://doi.org/10.1016/j.solmat.2017.11.038.
S. Thiruvenkadam, S. Prabhakaran, S. Chakravarty, V. Ganesan, V. Sathe, M.S. Kumar, and A.L. Rajesh, Phys. B Condens. Matter 533, 22 (2018). https://doi.org/10.1016/j.physb.2017.12.065.
J. Conde, I. Zuñiga, H. Vilchis, N. Hérnandez-Como, F. Pola-Albores, and J. Pantoja, J. Mater. Sci.: Mater. Electron. 29, 15445 (2018). https://doi.org/10.1007/s10854-018-9075-3.
J.Y. Cho, S. Sinha, M.G. Gang, and J.J. Heo, J. Alloys Compd. 796, 160 (2019). https://doi.org/10.1016/j.jallcom.2019.05.035.
M.S. Mahdi, H.S. Al-Arab, H.S. Al-Salman, K. Ibrahim, N.M. Ahmed, A. Hmood, and M. Bououdina, Mater. Lett. 273, 127910 (2020). https://doi.org/10.1016/j.matlet.2020.127910.
Q.X. Zhang, S.Y. Ma, R. Zhang, Y. Tie, and S.T. Pei, Mater. Lett. 258, 126783 (2020). https://doi.org/10.1016/j.matlet.2019.126783.
S.H. Chaki, M.D. Chaudhary, and M.P. Deshpande, J. Semicond. 37, 053001 (2016). https://doi.org/10.1088/1674-4926/37/5/053001.
A.R. Garcia-Angelmo, M.T.S. Nair, and P.K. Nair, Solid State Sci. 30, 26 (2014). https://doi.org/10.1016/j.solidstatesciences.2014.02.002.
U. Chalapathi, B. Poornaprakash, and S.-H. Park, Sol. Energ. 139, 238 (2016). https://doi.org/10.1016/j.solener.2016.09.046.
E. Guneri, C. Ulutas, F. Kirmizigul, G. Altindemir, F. Gode, and C. Gumus, Appl. Surf. Sci. 257, 1189 (2010). https://doi.org/10.1016/j.apsusc.2010.07.104.
M. Cao, W. Chuangsheng, K. Yao, J. Jing, J. Huang, M. Cao, J. Zhang, J. Lai, O. Ali, L. Wang, and Y. Shen, Mater. Res. Bull. 104, 244 (2018). https://doi.org/10.1016/j.materresbull.2018.03.039.
A. Basak, A. Hati, A. Mondal, U.P. Singh, and S.K. Taheruddin, Thin Solid Films 645, 97 (2018). https://doi.org/10.1016/j.tsf.2017.10.039.
Y. Liu, K. Cao, J. Liu, Z. Zhang, J. Ji, F. Wang, and Z. Li, J. Mater. Sci.: Mater. Electron. 30, 15880 (2019). https://doi.org/10.1007/s10854-019-01924-7.
B. Poornaprakash, U. Chalapathi, S.P. Vattikuti, M.C. Sekhar, B.P. Reddy, P.T. Poojitha, and S.H. Park, Mater. Res. Bull. 103, 13 (2018). https://doi.org/10.1016/j.materresbull.2018.03.016.
V.K. Arepalli, Y. Shin, and J. Kim, Superlattice Microst. 122, 253 (2018). https://doi.org/10.1016/j.spmi.2018.08.001.
A.M.S. Arulanantham, S. Valanarasu, K. Jeyadheepan, V. Ganesh, and M. Shkir, J. Mol. Struct. 1152, 137 (2018). https://doi.org/10.1016/j.molstruc.2017.09.077.
P. Sinsermsuksakul, L. Sun, and S.W. Lee, Adv. Energy Mater. 4, 1400496 (2014). https://doi.org/10.1002/aenm.201400496.
A.R. Garcia-Angelmo, R. Romano-Trujillo, J. Campos-Álvarez, O. Gomez-Daza, M.T.S. Nair, and P.K. Nair, Phys. Status Solidi A 212, 2332 (2015). https://doi.org/10.1002/pssa.201532405.
Laboratory, National Renewable Energy NREL, https://www.nrel.gov/pv/assets/images/efficiency-chart.png. Accessed 13 Apr 2020.
T.D. Lee and A.U. Ebong, Renew. Sust. Energ. Rev. 70, 1286 (2017). https://doi.org/10.1016/j.rser.2016.12.028.
First Solar, http://investor.firstsolar.com/releasedetail.cfm?ReleaseID=956479. Accessed 13 Apr 2020.
P. Jackson, R. Wuerz, D. Hariskos, E. Lotter, W. Witte, and M. Powalla, Phys. Status Solidi RRL 10, 583 (2016). https://doi.org/10.1002/pssr.201600199.
J.A. Andrade-Arvizu, M. Courel-Piedrahita, and O. Vigil-Galán, J. Mater. Sci.: Mater. Electron. 26, 4541 (2015). https://doi.org/10.1007/s10854-015-3050-z.
S.S. Hegde, A.G. Kunjomana, P. Murahari, B.K. Prasad, and K. Ramesh, Surf. Interfaces 10, 78 (2018). https://doi.org/10.1016/j.surfin.2017.12.003.
M. Gurubhaskar, N. Thota, M. Raghavender, G.H. Chandra, P. Prathap, and Y.V. Subbaiah, Vacuum 155, 318 (2018). https://doi.org/10.1016/j.vacuum.2018.06.011.
M.S. Mahdi, K. Ibrahim, N.M. Ahmed, A. Hmood, S.A. Azzez, F.I. Mustafa, and M. Bououdina, Mater. Lett. 210, 279 (2018). https://doi.org/10.1016/j.matlet.2017.09.049.
U. Chalapathi, B. Poornaprakash, and S.H. Park, J. Alloys Compd. 689, 938 (2016). https://doi.org/10.1016/j.jallcom.2016.08.066.
Y. Jayasree, U. Chalapathi, and P.U. Bhaskar, Appl. Surf. Sci. 258, 2732 (2012). https://doi.org/10.1016/j.apsusc.2011.10.124.
I. Ammar, A. Gassoumi, A. Akkari, F. Delpech, S. Ammar, and N. Turki-Kamoun, Eur. Phys. J. Plus 134, 505 (2019). https://doi.org/10.1140/epjp/i2019-12976-3.
U. Chalapathi, B. Poornaprakash, W.J. Choi, and S.H. Park, Appl. Phys. A 126, 583 (2020). https://doi.org/10.1007/s00339-020-03763-4.
L.P. Joshi, L. Risal, and S.P. Shrestha, J. Nepal Phys. Soc. 3, 1 (2015). https://doi.org/10.3126/jnphyssoc.v3i1.14436.
P. Mani, K. Manikandan, and J.J. Prince, J. Mater. Sci.: Mater. Electron. 27, 9255 (2016). https://doi.org/10.1007/s10854-016-4963-x.
M. Du, X. Yin, and H. Gong, Mater. Lett. 152, 40 (2015). https://doi.org/10.1016/j.matlet.2015.03.020.
A. Banotra and N. Padha, J. Cryst. Growth 534, 125460 (2020). https://doi.org/10.1016/j.jcrysgro.2019.125460.
R.K. Choubey, D. Desai, S.N. Kale, and S.J. Kumar, Mater. Sci: Mater. Electron. 27, 7890 (2016). https://doi.org/10.1007/s10854-016-4780-2.
A. Jacob, M.F. Andrade-Arvizu, M. García-Sánchez, F.Pulgarín-Agudelo Courel-Piedrahita, E. Santiago-Jaimes, E. Valencia-Resendiz, A. Arce-Plaza, and O. Vigil-Galán, J. Anal. Appl. Pyrolysis 121, 347 (2016). https://doi.org/10.1016/j.jaap.2016.08.016.
C.M. Avendaño, M. Courel, J.P. Enríquez, R.C. Valderrama, A.M. Ayala, I.M. De Los Santos, and J.B. Pérez, Mater. Res. Express 6, 076413 (2019). https://doi.org/10.1088/2053-1591/ab1291.
T. Sall, M. Mollar, and B. Marí, Opt. Quant. Electron. 49, 386 (2017). https://doi.org/10.1007/s11082-017-1219-9.
V.K. Arepalli, Y. Shin, and J. Kim, Opt. Mater. 88, 594 (2019). https://doi.org/10.1016/j.optmat.2018.12.016.
H. Kafashan, Ceram. Int. 45, 334 (2019). https://doi.org/10.1016/j.ceramint.2018.09.172.
E.B. Díaz-Cruz, L. González-Espinoza, E. Regalado-Pérez, O.A. Castelo-González, M.C. Arenas-Arrocena, and H. Hu, J. Alloys Compd. 797, 537 (2019). https://doi.org/10.1016/j.jallcom.2019.05.002.
R.S. Dhari, Z. Javanbakht, and W. Hall, Mater. Lett. 284, 129026 (2021). https://doi.org/10.1016/j.matlet.2020.129026.
Acknowledgments
The authors thank the Instituto de Investigación e Innovación en Energías Renovables de la Universidad de Ciencias y Artes de Chiapas (IIIER-UNICACH) for providing all the necessary tools for the development of this project, and Cátedras CONACYT Project 876.
Author information
Authors and Affiliations
Corresponding author
Ethics declarations
Conflict of interest
The authors declare that they have no conflicts of interest.
Additional information
Publisher’s Note
Springer Nature remains neutral with regard to jurisdictional claims in published maps and institutional affiliations.
Rights and permissions
About this article

Cite this article
Meza Avendaño, C.A., Pantoja Enríquez, J. & Conde, J. Effects of Temperature and Agitation Time of Triethanolamine as a Complexing Agent in Production of Tin Sulfide Thin Films by CBD. J. Electron. Mater. 50, 3266–3275 (2021). https://doi.org/10.1007/s11664-021-08810-1
Received:
Accepted:
Published:
Issue Date:
DOI: https://doi.org/10.1007/s11664-021-08810-1