
Abstract
Inconel718 (IN718) superalloy is one of the most widely employed high-temperature materials. How to improve its working temperature limit is a challenging but rewarding task. In this study, we have proved that by simply mechanical blending pre-alloyed IN718 powder with elemental Al powder, one can successfully add extra Al to the IN718 alloy. The Al-added IN718 alloys developed by this study show homogenous distribution of Al in the as-printed microstructure produced by selective laser melting (SLM), and only a slight loss of the Al amount is detected due to SLM in situ alloying. Excellent relative density of > 99.5 pct has been achieved, and after the standard heat treatment, the IN718 + 0.5Al alloy shows good mechanical properties, achieving a fracture strength of ~ 1400 MPa and elongation of ~ 12 pct. Introducing an extra amount of Al into the IN718 alloy has also improved thermal stability, in which testing is conducted at 680 °C and held for 100 hours. Meanwhile, it is noted that by a new heat treatment approach, the Al-doped IN718 alloy achieves the best fracture strength at ~ 1600 MPa and elongation at ~ 10 pct. The implications of the study have been addressed.
1 Introduction
Inconel 718 superalloy (IN718) is widely used in the fields of aviation, mechanical engineering, power generation, etc. because of its low cost and excellent mechanical properties at elevated temperatures, particularly its good creep resistance, good fatigue life, and high strength.[1,2] These are achieved by combined effects from (1) solid solution strengthening by the face-centered-cubic (FCC) γ phase (a = 3.60 Å) that is normally enriched with Ni and Co; (2) precipitation strengthening by the (FCC) γ′ phase (a = 3.61 Å and enriched with Al, Nb, and/or Ti), and/or the body-centered tetragonal (BCT) γ″ phase (a = 3.63 Å and c = 7.05 Å), which is close to Ni3Nb in chemistry; and (3) grain boundary pinning by carbides.[3,4] Topologically closed packed (TCP) hexagonal Laves phase and/or the orthorhombic δ phase (a = 5.11 Å, b = 4.25 Å and c = 4.54 Å), which is enriched with Nb, Cr, Mo, and/or W, might be also present in the microstructure, whose effects, however, are detrimental to the ductility, especially under high temperature conditions.[5]
The working temperature limit of the IN718 alloy is ~ 650 °C. Above the temperature, the metastable γ″ phase will be converted to the δ phase (orthorhombic structure), causing a rapid decline in strength and creep property.[6] Thus, it will be important to develop IN718-based material whose limits are beyond 650 °C for harsher conditions.[7] Many studies have been conducted for this purpose, and a popular way to solve the problem is to increase the content of strengthening phase γ′ by changing the ratio of (Ti+Al)/Nb, especially Al, as it is known that a fraction of the γ′ phase will increase at higher Al concentrations.[8,9] The increased content of the γ′ phase improves the alloy’s thermal stability by reducing the content of the γ″ phase, and it maintains good mechanical properties of the alloy due to low mismatch with the matrix phase.[10,11]
On the other hand, Ni-based superalloys, including IN718, are typical work-hardening materials. This makes their machining difficult. The rapid development of novel advanced manufacturing techniques, particularly selective laser melting (SLM) additive manufacturing (AM), offers a promising solution to the difficult-to-machine problem for the Ni-based superalloys.[12,13] Intensive studies have been conducted on SLM of IN718.[14,15] One may note, however, that currently there are three limits regarding the SLMed IN718:
-
(a)
It is difficult to change the chemical composition into desirable values. This is mainly because a series of production steps is involved for producing quality pre-alloyed, spherical powders for SLM.[16,17] This is illustrated well in Figure 1.
Fig. 1 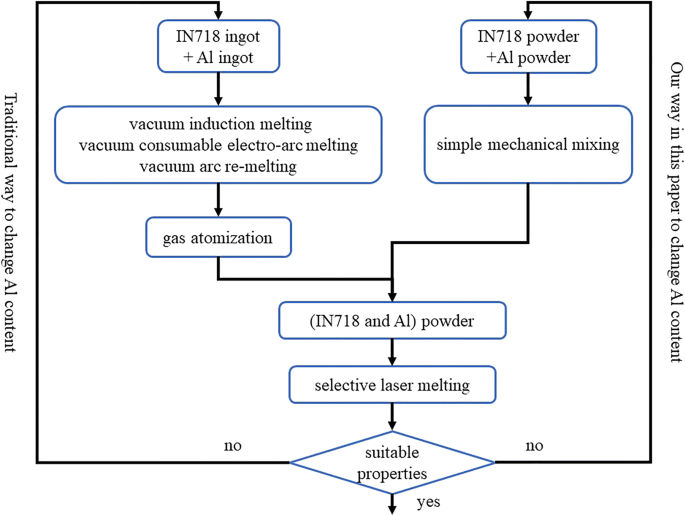
Comparison between the conventional gas atomization approach and the current approach for changing the chemical composition of the IN718 alloy
-
(b)
Only a few studies using blended powders were conducted, but the as-fabricated samples had low density[18,19,20] or the blended powders did not show sufficient metallurgical bonding.[21,22]
-
(c)
There is a rapid cooling rate in the process of SLM that causes a difference in phase constitution: The Laves phase is easier to form, compared with the traditional process,[23,24,25] and this phenomenon requires good study in terms of heat treatment, etc.[26,27,28]

The purposes of our current study are therefore threefold:
-
(1)
To enhance the high-temperature mechanical performance of the widely employed IN718 alloy by incorporating an extra amount of Al.
-
(2)
To demonstrate the possibility of varying the concentration of IN718 through blended powder, which is a mixture of the pre-alloyed IN718 powder with mechanically mixed Al elemental powder.[29] Compared with the conventional route, this approach will be much more convenient and easier to follow (Figure 1).
-
(3)
To propose a new heat treatment approach for the as-printed, Al-added IN718.
Through the current detailed study, we will show that:
-
(a)
By mechanical mixing with different amounts of Al, one can conveniently modify the chemical composition of the IN718 alloy and that chemical homogeneity of the mixed powders has been proved to be excellent.
-
(b)
The (IN718 and Al) blended powders have been processed by SLM. The corresponding densification, microstructure, and mechanical properties are detailed and compared.
-
(c)
Different heat treatments of the as-printed samples have been systematically studied, and the best parameters have been provided.
-
(d)
High-temperature thermal stability of the specimens using blended (IN718 and Al) powders has been addressed.
2 Experimental
The size distribution of the powders to be used was tested by a laser particle size analyzer (Melvin MS3000). Spherical, pre-alloyed IN718 powder (~ 35 μm in average) was blended with Al powder (99.9 wt pct purity) using a TURBULA T2F shaker-mixer for 2 hours. The mixture ratios (wt.pct) between IN718 and Al were 100:0.5, 100:1, and 100:2, respectively; the chemical compositions of the IN718 powders are listed in Table I. Inductively coupled plasma-atomic emission spectrometry (ICP-AES, Horiba Jobinyvon JY2000-2) was used for measuring the concentration of Al in the as-printed state. The powders will be denoted as IN718, IN718+0.5Al, IN718+1Al, and IN718+2Al hereafter.
Regarding the Al powder to be blended with the IN718 pre-alloyed powder, the average sizes of them of ~ 1, ~ 10, and ~ 30 μm were tested and compared. While the ~ 1-μm Al elemental powder led to poor flowability and the ~ 30-μm Al elemental powder tended to incur inhomogeneous mixing (details omitted here), the ~ 10-μm one was chosen as the Al elemental powder. Table II further shows that, although incorporating the ~ 10-μm Al elemental powder may have decreased the flowability of the original IN718 pre-alloyed power, particularly in the case of the IN718+2Al, in practice, they were printable, spread well on the building platform, and showed good as-printed density as shown later on in Figure 4.
Samples were additively manufactured using an SLM Solution 125 HL 3D printer. Pure argon was used as protective atmosphere during the SLM process. The densities of the as-printed samples were measured by the Archimedes method. To determine the relative density accurately, casting samples were made by arc melting as the reference material for the fully dense state.
The general purpose of the heat treatment is to obtain correct phase constitution for the IN718 and (IN718+Al) samples. During the heat treatment, it is hoped that the Laves phase will get dissolved, γ′ phase can be increased, and formation of the δ phase can be inhibited. Similar heat treatments for the IN718 have been done by other researchers as well, where the focus was put on inhibiting the formation of the δ phase and/or improving hardness.[30,31,32,33] Based on the existing approach AMS5662, we have further designed a new heat treatment approach, hoping to resolve Nb that accumulates at grain boundaries. Heat treatment for the as-printed specimens was conducted in two ways:
-
(a)
By following the AMS 5662 standard: Solution treatment at 980 °C for 1 hour and then air cooled to room temperature. The subsequent aging was hold at 720 °C for 10 hours, furnace cooled to 620 °C in 2 hours, held at 620 °C for 8 hours, and then air cooled to room temperature (Figure 2).
Fig. 2 
(a) Heat treatments conducted in this study following the AMS 5662 standard and a new heat treatment approach adopted by this paper. (b) Geometry of the tensile test sample (in mm)
-
(b)
By following a new heat treatment approach: Solution treatment at 1065 °C for 1 hour and then air cooled to room temperature. The subsequent aging treatment was furnace heated to 1065 °C in 10 hours from 760 °C, furnace cooled to 650 °C in 2 hours, held at 650 °C for 8 hours, and then air cooled to room temperature (Figure 2).

For high-temperature thermal stability study, the samples were hold at 680 °C for 100 hours and then air cooled to room temperature; microstructures before and after the high temperature holding test were compared to evaluate the thermal stability.
For microstructural analysis, both the as-printed and the heat-treated samples were polished according to standard procedure and then etched with aqua regia. The as-printed samples were observed in a Zeiss Axio Observer 3 optical microscopy (OM). Scanning electron microscope (SEM) imaging and energy-dispersive X-ray spectrometer (EDS) were carried out on a Zeiss merlin gemini2 field-emission SEM. Samples for transmission electron microscopy (TEM) investigation were prepared by an FEI Helios Nanolab 600i focused ion beam (FIB) workstation. During FIB operation, the TEM samples (~ 8 μm long, 6 μm wide, and 80 nm thick) were coated with amorphous carbon to protect its structure from an ion beam, then milled using a focused Ga-ion beam, and finally cleaned using a Model 1040 NanoMill. TEM characterization was conducted in a Tecnai F30 and operated at 300 kV. Phase identification was performed using X-ray diffraction (XRD) with a Cu radiation, where the 2θ angles were between 35 and 95 deg; a step size of 0.02 deg and a scan rate of 2 deg/min were used for the XRD analysis.
For mechanical property testing, plate-type tensile test specimens were machined to a gage length of 22 mm, 4 mm wide, 2 mm thick, and a total length of 73 mm. The test samples were taken from their XOY planes, perpendicular to the build platform (i.e., Z direction), as shown in Figure 2(b). Tensile tests were performed using Instron 3382 according to the ASTM E8. For each state, at least three samples were tested.
3 Results
3.1 Preliminary Analysis of the Mechanically Blended Powders
Figure 3 shows the analysis results of the mechanically blended (IN718 and Al) powders. Figures 3(a) and (b) are the size distributions of the pre-alloyed IN718 powder and the elemental Al powder, respectively, which suggests that the size of the IN718 powder is 15 to 63 μm and the Al powder is 8 to 12 μm. Their morphologies are presented in Figures 3(c) and (d) recorded by SEM secondary electron imaging. Figure 3(e) shows the morphology of the blended powder, where the large-sized powders are the IN718 pre-alloyed powders and the smaller ones are the Al powders. The SEM and elemental EDS mapping results are shown in Figures 3(f) and (g), respectively, highlighting the distribution of Al and suggesting that generally speaking, a homogenous distribution of Al has been realized using the simple mechanical mixing approach. Figure 3(h) further shows the XRD results for the IN718 and the blended powders, detecting diffraction peaks from both the pre-alloyed IN718 powder and the blended Al powder.

Powder size distribution of (a) IN718 and (b) Al. SEM images of (c) IN718 and (d) Al, (e) IN718 with blended Al, (f) EDX result highlighting the distribution of Al (in green color), (g) EDX mapping to show distribution of Al, and (h) XRD patterns for the Al elemental powder and the blended IN718+1Al powder (Color figure online)
3.2 SLM Processing of the Mechanically Blended (IN718 and Al) Powders
The original IN718, together with the Al-added IN718+0.5Al, IN718+1Al and IN718+2Al, have been fabricated by SLM. Table III lists the processing parameters. The densities of the as-printed samples are shown in Table IV whose relative densities are all over 99.5 pct. There are almost no defects in the as-printed samples as shown in Figure 4 using optical microscopy. Figure 5 further provides a micro CT image showing almost pore-free internal structure. It is noted from the results that, regardless of how much Al is incorporated, the maximum density of the four alloys has been obtained at the parameters of 200-W laser power and 900-mm/s scanning speed. The addition of Al has no obvious effect on the optimized SLM parameters from the density perspective.

Optical metallography of the as-printed specimens: (a) IN718; (b) IN718+0.5Al; (c) IN718+1Al; (d) IN718+2Al

Micro CT image of the as-printed IN718 using 200-W laser power and 900-mm/s scanning speed
3.3 Effect of the Mechanically Blended Al on the As-Printed Microstructure and Mechanical Property
XRD patterns of the as-printed (IN718+Al) alloys are shown in Figure 6. It is noted that, compared with the unmodified IN718, the overall microstructures show no notable changes in the Al-added alloys. The main phase has been determined as γ.

XRD spectra for the as-printed samples
The corresponding SEM images are shown in Figure 7. The microstructural characteristics are summarized as follows:

SEM images and linear EDS analysis for the Nb elemental distribution: (a) IN718, (b) IN718+0.5Al, (c) IN718+2Al; and the subgrain of (d) IN718, (e) IN718+0.5Al, and (f) IN718+2Al
-
Effect of the added Al on the γ phase The grain sizes of the as-printed alloys are in the level of ~ 15 μm; grain boundary areas show enrichment of Nb (see insets in Figures 7(a) through (c) for the IN718, IN718+0.5Al, and IN718+2Al, respectively). Subgrain structures of < 1 μm in size are observable, which is also enriched in Nb elements (see the insets in Figures 7(d) through (f)). Increment of Al has not shown notable impact on the as-printed microstructure. The Nb-enriched phases are suspected to be the Laves phases.
-
Effect of the doped Al on other microstructural features As also suggested by the XRD results in Figure 6, other phases such as carbides are not evidently detectable in the as-printed microstructure.
Figure 8 shows the room-temperature mechanical properties of the four as-printed alloys, which suggests that increasing the Al concentration generally leads to better fracture strength but lowered ductility. But overall speaking, the as-printed (IN718 and Al) alloys show an excellent combination of strength and ductility, with fracture strength higher than 1000 MPa (e.g., IN718+0.5Al) and elongation better than 20 pct (e.g., IN718+0.5Al), respectively.

Engineering stress–strain curves of the as-printed alloys
3.4 Heat Treatment Results of the Mechanically Blended (IN718 and Al) Following the AMS 5662 Standard: Microstructures and Mechanical Properties
The four alloys were heat treated by following the AMS 5662 approach, and the corresponding mechanical and microstructural results are summarized as follows:
-
Regarding the mechanical property The alloys IN718 and IN718+0.5Al have similar mechanical properties (Figure 9 and Table V); it is noted that IN718+0.5Al has a higher elongation after heat treatment than that of the as-printed state. Further increment in Al enhances tensile strength but reduces elongation. Elongation decreases rapidly for the IN718+2Al alloy.
Fig. 9 
Engineering stress–strain curves of the alloys after heat treatment following the AMS 5662 approach
Table V Tensile Strength and Elongation of the As-printed and Heat-Treated Samples -
Regarding the microstructure:
-
(a)
XRD patterns shown in Figure 10 suggest that there is not much difference when comparing between the as-printed and heat-treated IN718 and (IN718+Al) samples that follow the AMS5664 heat treatment, which suggests that the microstructure is dominated by γ/γ’ phases.
Fig. 10 
XRD spectra for the samples following the two different heat treatment approaches
-
(b)
Figures 11(a) and 12 are SEM and TEM results for the heat-treated IN718, where the fine needle-shaped particles ~ 200 nm long make up the δ phase. The figures show that, after the heat treatment, the Laves phase is still retained, which may have caused the sharp drop in the plasticity (~ 10 pct) compared with the as-printed state (~ 25 pct).
Fig. 11 
Effects of Al contents on the microstructures of the heat-treated alloys following the AMS 5662 approach: (a) IN718; (b) IN718+0.5Al; (c) IN718+1Al; (d) IN718+2Al. (I) and (II) are the higher magnification images for the positions I and II
Fig. 12 
(a) TEM bright field image and (b) diffraction patterns for base and precipitation of IN718 after heat treatment following the AMS 5662 approach
-
(c)
Comparing among Figures 11(a) through (d), it is noted that IN718+0.5Al still shows a retained Laves phase but no overwhelming δ phase, enabling the IN718+0.5Al to have a better elongation. With the increasing content of Al, the shape of the Laves phase changes from oval to quadratic and the size of the residual phase becomes much larger, both leading to decreased elongation.
-
(a)


3.5 Heat Resistance/Thermal Stability of the Mechanically Blended (IN718 and Al) Alloys
The thermal stability and heat resistance of the heat-treated (IN718 and Al) alloys have been further studied. The microstructure is shown in Figure 13. Compared with the results shown in Figure 11, it is noted that, after the thermal stability test, the needle-shaped δ phase has grown in both grain size and volume fraction in the unmodified IN718 alloy (Figure 13(a)), which suggests a less ideal thermal stability. In contrast, the IN718+0.5Al changes only slightly in its microstructure, except for a small amount of δ phase getting formed as shown in Figure 13(b). This proves that the increased Al concentration has hindered the growth and precipitation of the δ phase and that the thermal stability is improved as a consequence. Further increasing Al content, however, leads to more δ phases generated in the microstructure and the δ phases even interconnect with each other particularly in the IN718+2Al alloy (see Figures 13(c) and (d) for the corresponding details).

Effects of Al contents on microstructures after the thermal stability test: (a) IN718; (b) IN718+0.5Al; (c) IN718+1Al; (d) IN718+2Al. (I) and (II) are the higher magnification images for the positions I and II
3.6 New Heat Treatment for the Mechanically Blended (IN718 and Al): Microstructures and Mechanical Properties
-
Regarding the mechanical property As shown by Figure 14 and Table V, the mechanical property has a similar trend as the ones following the AMS 5662 standard. In general, the tensile strength increases and elongation decreases with increasing Al concentration. The elongations achieved by the IN718 and IN718+0.5Al are close to 15 pct, which is higher than the 12 pct that is specified by the corresponding ASTM standard. The IN718+1Al alloy also presents a high strength ~1600 MPa and a good elongation of ~ 10 pct.
Fig. 14 
Engineering stress–strain curves of the alloys after the new heat treatment
-
Regarding the microstructure:
-
Microstructure of the unmodified IN718 After the new heat treatment, grain boundaries become unclear in the IN718 when comparing the results in Figures 7(a) and 15(a). Meanwhile, the subgrain boundary almost disappears, which suggests that the Laves phase gets melted. The increase of elongation also proves this. A square γ′ phase and a lenticular-like γ″ phase have replaced the Laves phase and fine needle-shaped δ phase. The γ″ phase may have coherence with the γ matrix, improving the plasticity, which is in contrast to the incoherent δ phase.
Fig. 15 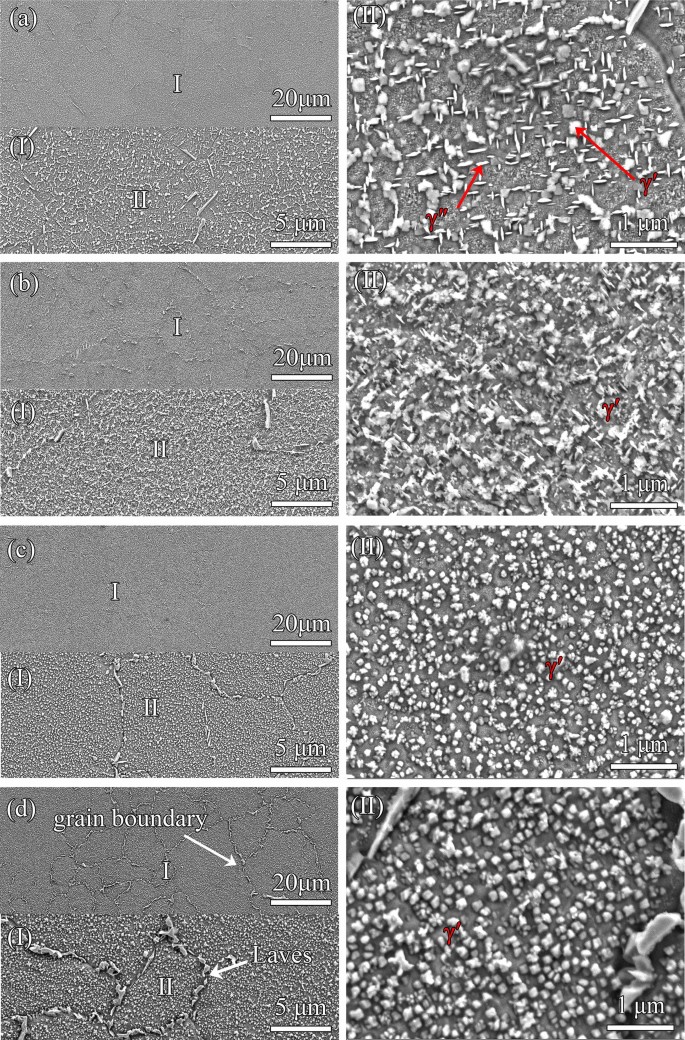
Effects of Al contents on microstructure after the new heat treatment: (a) IN718; (b) IN718+0.5Al; (c) IN718+1Al; (d) IN718+2Al. (I) and (II) are the higher magnification images for the positions I and II
-
Microstructure of the Al-added alloys The samples following the new heat treatment show no obvious difference with those after the AMS5664 heat treatment (Figure 10). More details regarding the microstructures are revealed by the following SEM and TEM analyses. In the IN718+0.5Al alloy, the shape of the γ′ phase changes from square to circle and the γ″ phase almost disappears, and there is a tiny amount of δ phases and carbides in the grain boundary (Figure 15(b), Figures 16(a) and (b), and Table VI). The presence of the γ′ phase and the reduction of the γ″ phase as well as the Laves phase in this case should have contributed to the good plasticity as well as to the alloy’s improved thermal stability. In contrast, larger needle δ phases of several micrometers long are observed in the IN718+1Al alloy as shown in Figure 15(c), which may be the reason for the decreased plasticity. Regarding the IN718+2Al alloy, large particles stay on the grain boundary area, which should decrease ductility (Figure 15(d)). Considering the results presented above, it is our understanding that the IN718+0.5Al represents the best state in terms of thermal stability, and the thermal stability starts to decrease in the case of IN718+1Al.
Fig. 16 
(a) TEM bright field image and (b) diffraction patterns for the base material γ phase and the γ′ precipitation in the IN718 after the new heat treatment
Table VI Al Content (Weight Percent) of the Four Alloys Measured by EDS and ICP
-


4 General Discussions
We have demonstrated that the added Al has evidently improved the mechanical property as well as the thermal stability of the IN718 alloy. We will now briefly discuss the mechanically blended Al approach in the following two aspects:
-
(a)
Distribution homogeneity of the added Al
-
(b)
Effectiveness of the added Al on changing the phase constitution of the IN718 alloy.
4.1 Distribution of the Doped Al in the As-Printed (IN718+Al) Alloys
Figure 17 is the EDS mapping results, showing distribution of the Al in the as-printed IN718, IN718+0.5Al, IN718+1Al, and IN718+2Al. It is noted that there is no obvious segregation or strong phase contrast in the IN718+0.5Al and IN718+1Al samples. A slight difference in contrast, however, can be observable in the IN718+2Al, which should correspond to the existing melt track or grain boundary. These figures suggest that generally speaking the added Al distributes rather homogeneously in the as-printed microstructure.

EDS mapping for Al in the as-printed samples: (a) IN718; (b) IN718+0.5Al; (c) IN718+1Al; (d) IN718+2Al (Color figure online)
The phenomenon can be understood in this way: Pure Al has high laser reflectivity (~ 90 pct for 1064-nm wavelength laser) and poor laser energy absorptivity (~ 10 pct for 1064-nm wavelength laser).[34] In the current study, their particle sizes (~ 10 μm) are much smaller than IN718 (~ 35 μm). These mean that the added Al will most likely get melted by thermal conduction, which is caused by the first melted, bigger-sized, pre-alloyed IN718 particles. In the meantime, although the diffusion distance of the Al has been calculated to be small (~ 2 μm; details omitted here), when the molten pool life time is in the 0.1-ms scale,[24] there are other mechanisms, including strong melt stirring, which can and have helped the added Al element to distribute fairly homogenously in the microstructure.[4,22] These further imply that, as long as a homogenous distribution of the Al powder can be realized during the mechanical blending procedure, the homogenous distribution of the Al can be ensured in the as-printed (IN718+Al) alloys.
4.2 Effectiveness of the Added Al on Changing the Microstructure of IN718
To examine the effectiveness of the added Al on the changing phase constitution of the IN718 alloy, we further discuss the following two aspects:
-
(a)
Loss of the Al during SLM processing The Al content in the IN718+0.5Al, IN718+1Al, and IN718+2Al are 0.42, 0.87, and 1.71 pct, respectively, by the ICP measurement (Table VII). The corresponding real increments of Al are 0.42, 0.87, and 1.71 pct, respectively, which are close to the originally designed. As discussed previously, the added Al powders are likely melted by the conductive heat rather than directly from the incident laser, which may have helped to avoid large evaporation of the Al element.
Table VII Compositions of Point 1 and Point 2 in Fig. 16 -
(b)
Changes of phases with the blended Al It is noted that the present study is close to other reports in terms of Al’s effect on formation of the γ′ phase.[9] The comparison before and after incorporating Al into IN718 suggests that the currently developed mechanically mixing approach effectively enlarges the fraction of the γ′ phase as expected.
5 Conclusion
The present study shows that it is feasible to incorporate Al into the IN718 superalloy by a simple but effective way of mechanical blending using IN718 pre-alloyed powder and Al elemental powder. Better thermal stability due to the presence of added Al has been confirmed. Detailed findings can be summarized as follows:
-
The elemental Al has been mechanically blended with the pre-alloyed IN718 powder; it shows rather homogenous distribution of the microstructure of the as-printed, Al-added IN718 alloys.
-
The added Al is capable of enlarging the volume fraction of the γ′ phase, and only a small amount of elemental loss (less than 20 pct) has been detected for the added Al due to the SLM processing.
-
The added Al has no obvious effects on the as-printed density of the IN718. All the investigated samples, including the IN718, IN718+0.5Al, IN718+1Al, and IN718+2Al, have shown excellent relative density of > 99.5 pct.
-
The Al-added IN718 alloys have been heat-treated following the standard AMS 5662 approach. The added Al generally increases fracture strength but lowers elongation. The IN718+0.5 alloy shows the best overall mechanical property, achieving a fracture strength of ~ 1400 MPa and elongation of ~ 12 pct. Thermal stability testing conduced at 680 °C for 100 hours shows that the IN718+0.5 alloy has improved stability compared to the unmodified IN718 alloy.
-
A new heat treatment approach (Figure 2) has been studied for the Al-added IN718 alloys. After the heat treatment, the IN718+0.5 alloy shows a fracture strength of ~ 1400 MPa and elongation of ~ 15 pct. Meanwhile the IN718+1Al alloy shows a fracture strength of ~ 1600 MPa and elongation of ~ 10 pct.
References
1. E. A. Loria: JOM, 1988, vol. 40, pp. 36-41.
2. R. F. Decker: JOM, 2006, vol. 58, pp. 32–36.
3. C.T. Sims, N.S. Stoloff, and W.C. Hagel: Superalloys II. Wiley-Interscience, New York, 1987, pp. 97-131.
4. R.C. Reed: The Superalloys: Fundamentals and Applications. Cambridge University Press, New York, 2008, pp. 33-99.
5. M. Sundararaman, P. Mukhopadhyay, and S. Banerjee: Metall. Trans. A, 1988, vol. 19, pp. 453-65.
J.P. Collier, A.O. Selius, and J.K. Tien: Superalloys,1988, pp. 43–52.
7. R. Martin and D. Evans: JOM, 2000, vol. 52, pp. 24-8.
8. R. Cozar and A. Pineau: Metall. Trans., 1973, vol. 4, pp. 47-59.
9. J.P. Collier, H.W. Song, J.K. Tien, and J.C. Phillips: Metall. Trans. A, 1988, vol. 19, pp. 1657–66.
10. S.H. Fu, J.X. Dong, M.C. Zhang, and X.S. Xie: Mater. Sci. Eng. A, 2009, vol. 499, pp. 215-20.
W. D. Cao and R. Kennedy: Superalloys, 2004, 2004, pp. 91-99.
12. I. Gibson, D.W. Rosen, and B. Stucker: Additive Manufacturing Technologies – Rapid Prototyping to Direct Digital Manufacturing. Springer, New York, 2010, pp. 32–55.
13. C.Y. Yap, C.K. Chua, Z.L. Dong, Z.H. Liu, D.Q. Zhang, L.E. Loh, and S.L. Sing: Appl. Phys. Rev., 2015, vol. 2, pp. 41-101.
14. K.N. Amato, S.M. Gaytan, L.E. Murr, E. Martinez, P.W. Shindo, J. Hernandez, S. Collins, and F. Medina: Acta Mater., 2012, vol. 60, pp. 2229-39.
15. Q. Jia and D. Gu: J. Alloy Comp., 2014, vol. 585, pp. 713-21.
X. Wang, R.M. Ward, M.H. Jacobs, and M.D. Barratt: Metall. Mater. Trans. A, 2008, vol. 39A, pp. 2981-89.
17. I. Gibson, D. Rosen, and B. Stucker: Additive Manufacturing Technologies.Springer, New York, 2010, pp 32–55.
18. B. Zhang, N.E. Fenineche, H. Liao, and C. Coddet: J. Magn. Mater., 2013, vol. 336, pp. 49-54.
19. B. Zhang, N.E. Fenineche, H. Liao, and C. Coddet: J. Mater. Sci. Technol., 2013, vol. 29, pp. 757-60.
20. J.P. Kruth, L. Froyen, J. Van Vaerenbergh, P. Mercelis, M. Rombouts, and B. Lauwers: J. Mater. Process. Technol., 2004, vol. 149, pp. 616-22.
21. Q. Jia and D. Gu: J. Mater. Res., 2014, vol. 29, pp. 1960-9.
22. X. Yao, S.K. Moon, B.Y. Lee and G. Bi: Int. J. Precision Eng. Manufact., 2017, vol. 18, pp. 1693-1701.
23. T. Trosch, J. Strößner, R. Völkl, and U. Glatzel: Mater. Lett., 2016, vol. 164, pp. 428-31.
24. M. Xia, D. Gu, G. Yu, D. Dai, H. Chen, and Q. Shi: Int. J. Mach. Tool Manufact., 2017, vol. 116, pp. 96-106.
M. J. Sohrabi, H. Mirzadeh, and M. Rafiei: Vacuum, 2018, vol. 154, pp. 235-43.
26. Y. Zhang, Z. Li, P. Nie, and Y. Wu: Metall. Mater. Trans. A, 2013, vol. 44, pp. 708-16.
27. M.D. Sangid, T.A. Book, D. Naragani, J. Rotella, P. Ravi, A. Finch, P. Kenesei, J.S. Park, H. Sharma, J. Almer, and X. Xiao, Add. Manufact., 2018, vol. 22, pp. 479-96.
28. W.M. Tucho, P. Cuvillier, A.S. Kverneland, and V. Hansen: Mater. Sci. Eng. A, 2017, vol. 689, pp. 220-32.
29. S.A. Khairallah, A.T. Anderson, A. Rubenchik, and W.E. King, Acta Mater., 2016, vol. 108, pp. 36-45.
30. E. Chlebus, K. Gruber, B. Kuźnicka, J. Kurzac, and T. Kurzynowski: Mater. Sci. Eng. A, 2015, vol. 639, pp. 647-55.
31. S. Raghavan, B. Zhang, P. Wang, C.N. Sun, M.L. Sharon, T. Li, and J. Wei: Mater. Manufact. Process., 2017, vol. 32, pp. 1588-95.
32. W.M. Tucho, P. Cuvillier, A.S. Kverneland, and V. Hansen: Mater. Sci. Eng. A, 2017, vol. 689, pp. 220-32.
33. G.H. Cao, T.Y. Sun, C.H. Wang, X. Li, M. Liu, Z.X. Zhang, P.F. Hu, A.M. Russell, R. Schneider, D. Gerthsen, Z.J. Zhou, C.P. Li, and G.F. Chen: Mater. Character., 2018, vol. 136, pp. 398-406.
34. Y. H. Zhou, Z. H. Zhang, Y. P. Wang, G. Liu, S. Y. Zhou, Y. L. Li, J. Shen, and M. Yan: Add. Manufact., 2019, vol. 25, pp. 204-17.
Acknowledgments
This work is supported by the Shenzhen Science and Technology Innovation Commission [ZDSYS201703031748354 and JCYJ20170817110358927] and the National Science Foundation of Guangdong Province [2016A030313756]. Dr M. Yan appreciates the support of the Humboldt Research Fellowship for Experienced Researchers. This work was also supported by the Pico Center at SUSTech with support from the Presidential fund and Development and Reform Commission of Shenzhen Municipality.
Author information
Authors and Affiliations
Corresponding author
Additional information
Publisher's Note
Springer Nature remains neutral with regard to jurisdictional claims in published maps and institutional affiliations.
Manuscript submitted January 8, 2019.
Rights and permissions
About this article

Cite this article
Zhang, Z.H., Zhou, Y.H., Zhou, S.Y. et al. Mechanically Blended Al: Simple but Effective Approach to Improving Mechanical Property and Thermal Stability of Selective Laser-Melted Inconel 718. Metall Mater Trans A 50, 3922–3936 (2019). https://doi.org/10.1007/s11661-019-05299-6
Received:
Published:
Issue Date:
DOI: https://doi.org/10.1007/s11661-019-05299-6