
Abstract
One of the attractive properties of Ti-6Al-4V alloy is control of microstructure through heat treatment to vary the mechanical properties. In this study, three different microstructures, Lamellar, Widmanstätten, and Martensitic morphologies, were created through heat treatment at a post-β transus temperature followed by cooling at different rates. With faster cooling rates, the microstructures evolved finer lamellae, smaller colony sizes, and thinner grain boundary layers. High-temperature dynamic compression was conducted on these specimens at a strain rate of 1000 s−1 and temperatures in the range of 23 °C to 1045 °C. Flow stresses decreased linearly with colony size and grain boundary layer thickness, but increased with inverse square root of lamellar thickness. This strong correlation of flow stress to several microstructural feature sizes indicated multiple modes of deformation. All three microstructures showed identical thermal softening. The softening rate was intensified at elevated temperatures due to hcp → bcc allotropic phase transformation. Gangireddy modification to Johnson–Cook model could account for this augmented softening and the modified J–C model predicted the three microstructures to follow a similar thermal softening coefficient m = 0.8. The kinetics of phase transformation appear to be very rapid irrespective of the microstructural differences in the Ti-6Al-4V alloy.
1 Introduction
Ti-6Al-4V is a popular α + β alloy with low density, high specific strength, corrosion resistance, and good high temperature properties. Being a two phase titanium alloy, it can display a wide range of microstructures depending on the thermo-mechanical or thermal processing routes used to produce them. Mechanical properties such as hardness, yield strength, tensile elongation, impact toughness, and fracture toughness are very sensitive to the characteristics of these microstructures such as the phases present, their volume fractions, grain size, shape, distribution of phases, and their morphology.[1,2,3] Depending on the nature of application, designers choose the morphologies with the required combination of properties. In order to make an engineering component from thus selected microstructures, manufacturing steps such as machining/drilling/cutting/grinding have to be performed either before or after the heat-treatment step. If the selected morphology is one that requires thermo-mechanical processing, the manufacturing steps can only be applied after the heat treatment step. If the selected morphology is one that requires only thermal processing, the heat treatment step could also be performed after manufacturing a final component shape, but if the component is of very large size, heat treatment may not be possible due to spatial constraints of furnace size. In such cases also, the heat treatment step has to precede the manufacturing step. Many investigators studied the effect of the material’s heat-treated microstructure on manufacturing processes such as machining, and milling. For example, Attanasio[4] found lamellar structures more preferable over equiaxed grains for lower and more constant cutting forces. Cedergren[5] found heat-treated microstructure to change chip morphology. Several such[4,5,6,7] studies clearly highlight that magnitude and stability of cutting forces, the type of chip formation, tool wear, and tool life changed significantly when working with different microstructures such as lamellar, equiaxed, bimodal. So microstructural dependence of dynamic deformation behavior should also be taken into critical consideration in terms of selection, development, and designing of materials.
Most studies have evaluated the effect of microstructure on Ti-6Al-4V mechanical properties under static or quasi-static loading.[8,9,10,11] Only a few studies focused on deformation under hostile conditions like dynamic loading and even these were limited to room temperature and their conclusions were contradictory.[12,13,14,15] While Wagoner[15] reported that the room temperature dynamic flow stresses of equiaxed and Widmanstätten morphologies were similar, Lee[14] compared equiaxed, Widmanstätten, and bimodal microstructures and found that the dynamic torsional deformation had a strong correlation to the starting microstructural features such as colony size and lamellar thickness. Further, there is a total lack of literature on the effect of microstructure on high temperature dynamic deformation. It is critical to investigate the high-temperature domain because manufacturing processes like machining involve not only rapid deformation but also rapid heating rates and high temperatures. A new variation of the Kolsky bar method has been developed at NIST[16] which directly sent pulses of DC electric current through the sample and resistively heat it to high temperatures upto 1200 °C with rapid heating rates of upto 2500 °C/s, the combination of rapid thermal and mechanical loading conditions, which, while somewhat short of the extremes found in machining, nevertheless can provide insight into material behavior under controlled conditions that approach those in machining. In this study, we investigated the high temperature and room temperature dynamic compression of three microstructures of Ti-6Al-4V—Lamellar, Widmanstätten and Martensite, at temperatures from 23 °C to 1045 °C and a strain rate of about 1000 s−1.
2 Experimental Procedure
2.1 Material
Commercial Ti-6Al-4V alloy purchased in the form of a 4 mm thick place was EDM cut into cylindrical specimens of 4 mm diameter and 4 mm thickness. The composition of the Titanium Grade 5 alloy is depicted in Table I.
2.2 Heat Treatment
The heat treatment involved homogenizing above the β-transus temperature, as given in the ASM technical guide for Titanium.[17] This is followed by cooling at different rates to create different microstructures. Three sets of specimens were prepared. Each set was wrapped in tantalum sheet to avoid contamination and then placed inside a silica glass tube. The tubes were evacuated to 10−6 Pa vacuum and sealed. These three capsules were then placed inside a tube furnace preheated to 1100 °C. After 1 hour of homogenization, one capsule is shattered in salt water—BQ (Brine Quenched). The second capsule is crushed in the air and specimens were left to cool in the ambient atmosphere—AC (Air Cooled). The third capsule is left inside the turned off furnace—FC (Furnace Cooled). Figure 1 schematically depicts this heat treatment procedure.

Heat treatment procedure for creating different microstructures from the initial globular morphology
2.3 Dynamic Deformation
Dynamic compression tests were performed at a strain rate of 1000 s−1 and initial temperatures between 23 °C and 1045 °C. Specimens were resistively heated with high amperage, low voltage electric current that was conducted directly through the sample while it sat fixed between the incident and transmission bar. The rapid heating rates of this method (about 1000 °C/s) enabled short heating durations (3.5 s of total transient and steady state heating time). The specimens (4 mm diameter) were also much smaller in cross section than the bars (15 mm diameter). Gangireddy[18] has shown earlier that under such conditions, the bars did not undergo significant heating and the wave-propagation remained unaffected. Heating was controlled using a fast response infrared spot pyrometer as a feedback sensor for a proportional–integral–derivative (PID) controller that modulated the heating power. A measure of the temperature uniformity of the specimen during heating was provided by a second infrared pyrometer focused on the opposite side of the specimen from the control pyrometer. An R-type thermocouple was also spot welded on the specimen to read the true temperature. During resistive heating, electromagnetic interference disrupts the thermocouple signal until the heating current is switched off. So while the thermocouple signal could be used to read the true temperature at impact (after current is turned off), it could not be used as temperature control during heating itself. So the radiance temperature measured by the pyrometer was used instead as the feedback to the PID controller of the power supply. As tests were conducted inside an environmental chamber, oxidation was minimal and the surface emissivity did not change significantly. The true temperature (thermocouple) and radiance temperature (pyrometer) were found to be well correlated between room temperature and 1200 °C. So the radiance temperature for a test could be set such that the true temperature would be close to the desired value (within 20 °C). Further details of this heating method, its performance capabilities and assessment of its uncertainties have been described elsewhere.[19,20]
2.4 Metallographic Preparation
The samples were grinded using P1200 and P2400 SiC paper at 300 rpm speed for 1 min under 5 and 3 lb force successively. Then they were polished with 6, 3, 1 µm diamond polish cloths. These polished surfaces were etched with Kroll’s Reagent of 5 mL HF, 10 mL HNO3, and 85 mL water composition. The polished and etched specimens were studied under a metallographic optical microscope.
3 Results and Discussion
3.1 Microstructures from Heat Treatment
Owing to the large difference in the cooling rates undergone by the three sets of specimens, they display very different microstructures, Figure 1. Microstructural features such as prior-β grain size, lamellar colony size, thickness of the grain boundary α layer as well as lamellar thickness were charted (Table II). Here, the colony size is a representative diameter (d) calculated from two perpendicular diagonal distances (d1 and d2) as
The colonies were typically rectangular in shape. So d reflects the diameter of a circular grain which has same area as the rectangular colony. A similar method was used to characterize the prior-β grain size as well.
-
(a)
Furnace-cooled microstructure (FC):
The furnace-cooled microstructure (FC) was lamellar in nature (Figure 2(a)). Prior-β grains were clearly discernible with a grain boundary (αGB) layer and were large from grain growth during the hour long homogenization at 1100 °C. The size of the prior-β grains ranged from 170 to 1370 µm with an average size of 680 µm and a distribution peak at 400 µm. α lamellae grew from multiple grain boundaries resulting in several colonies within a single prior-β grain, Figure 3(a). Some smaller colonies also resulted from an occasional nucleation within a β grain, Figure 3(b). Together, the entire set of colony sizes ranged from 115 to 865 µm with an average of 343 µm and a distribution-peak at 240 µm. In both the lamellar colony and prior-β grain size distributions, the average size was larger than the value at distribution-peak due to the presence of one or two large grains/colonies. The width of the lamellae in the colonies varied widely ranging from 4.5 to 33 µm.
Fig. 2 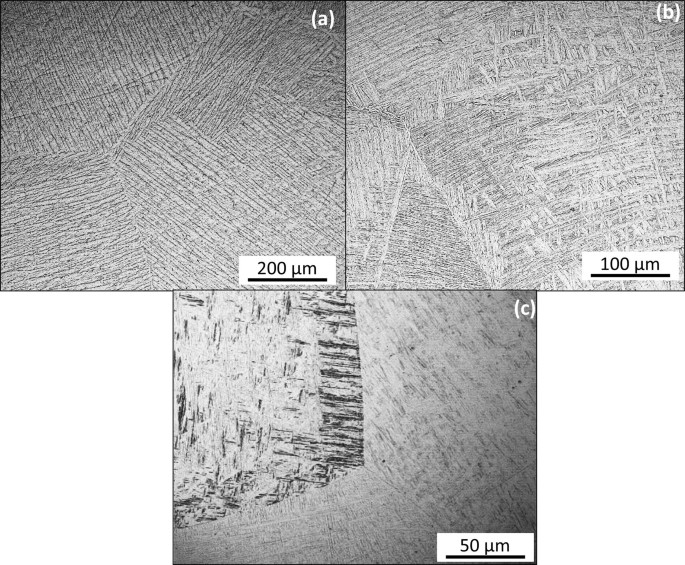
The array of microstructures (a) FC: furnace-cooled lamellar microstructure. (b) AC: air-cooled Widmanstätten microstructure. (c) BQ: brine-quenched martensitic microstructure
Fig. 3 
Microstructure of the furnace-cooled (FC) specimens, highlighting. (a) Prior-β grain boundaries and growth of lamellae from multiple sides of a single prior-β grain. (b) Secondary lamellae nucleating from existing α plates inside a β grain
The grain boundary layer (αGB) was about 20 µms in thickness and showed two kinds of morphologies: (a) Smooth: Majority of the boundaries composed of continuous α indicating a single nucleation and growth event, Figure 4(a). (b) Zigzag: a few grain boundaries resulting from separate heterogeneous nucleation and growth events occurring on prior-β grain boundary which coalesce after growth.[21]
Fig. 4 
Microstructure of the furnace-cooled (FC) specimens, highlighting prior-β grain boundary types: (a) smooth α layer and (b) zig-zag α layer
-
(b)
Air-cooled microstructure (AC):
The air-cooled microstructure (AC) was mostly Widmanstätten with some lamellar nature, Figure 5(a). Lamellar colonies occurred in a few places in the core of the specimen, where the cooling rate must have been lower from slower heat dissipation. The rest of the specimen is in Widmanstätten morphology with secondary-α plates nucleating inside a β grain in addition to the primary-α plates nucleating at the grain boundaries, giving its characteristic basket-weave appearance, Figure 5(b). The α plates here were finer than FC, with their width ranging from 0.9 to 2.8 µm. Prior-β grains were large and of similar size range as FC, between 210 and 1100 µm with an average of 620 µm and a distribution-peak at 600 µm. The boundaries were distinctly visible with clear grain boundary α layers (αGB). With a thickness of about 12 µm, the αGB layer was much wider than α plates in the grain interior. It had dual nature in this specimen as well with both smooth and zigzag morphologies. The interior of each prior-β grain consisted of several lamellar/basket-weave colonies. They were smaller than the lamellar colonies of FC and ranged from 80 to 530 µm with an average of 270 µm and histogram-peak at 180 µm.
Fig. 5 
Microstructure of air-cooled (AC) specimens. (a) Widmanstätten and lamellar morphologies in the core. (b) Basket-weave nature of the Widmanstätten morphology
-
(c)
Brine-quenched microstructure:
Quenching in brine solution resulted in a martensitic microstructure composed of largely acicular martensite (α′) with randomly oriented plates, and some massive martensite (αM) with long aligned plates, Figure 6(a). While the interior of all the grains was acicular α′, a few grain boundaries showed αM phase that appeared with long, closely stacked plates[22] which could exceed 50 µm in length, Figure 6(b). Both acicular α′ and αM plates were less than 0.5 µm in thickness.
Fig. 6 
Formation of massive αM with long, closely stacked plates at the grain boundaries. (a) αM at an internal grain boundary with the adjacent grain composed of only α′. (b) αM at a grain boundary on sample edge with grain interior of α′


The grain boundaries of prior-β grains were visible in this specimen as well with etched lines that were about 0.7 µm thick, Figure 7. The size of the prior-β grains was similar to the other two microstructures and ranged from 300 µms to 1210 µm with an average of 615 µm and a histogram peak at 550 µm.

Etched prior-β grain boundaries in the brine-quenched (BQ) specimens: (a) between two α′ grains and (b) between α′ and αM grains
3.2 Room Temperature Dynamic Response
Figure 8(a) plots the dynamic room temperature response of the three microstructures. These stress–strain curves showed that all the three microstructures have a similar work hardening, but flow stresses to be higher in the microstructures cooled at a faster rate during the heat treatment. The flow stress at 0.08 true strain was used as representative of the dynamic mechanical response in further analysis. Figure 8(b) plots the flow stresses at 0.08 strain in the three microstructures. The flow stress was highest in the martensitic BQ at 1529 MPa. The AC Widmanstätten at 1440 MPa, and FC lamellar at 1394 MPa, showed slightly lower flow stresses.

(a) Room temperature dynamic stress–strain curves, (b) flow stresses at 0.1 strain compared across the three heat-treated microstructures: (FC) Furnace-cooled lamellar, (AC) air-cooled Widmanstätten, and (BQ) brine-quenched martensite
The prior-β grains were similarly sized in the three microstructures as they underwent similar homogenization treatment. Hence no connection could be observed between the prior-β grain size and the dynamic mechanical response. But the other feature sizes such as (i) lamellar colony size, (ii) α-plate/lamellae thickness, and (iii) thickness of the grain boundary layer αGB seem to have a strong correlation to the flow stresses.
-
(i)
α-colony size is usually considered the most influential microstructural parameter on mechanical properties because it is a measure of the allowed slip length across similarly oriented lamellae before lamellae of a different orientation are encountered.[23] During slow cooling, the nucleation of lamellae occurred only at the prior-β grain boundaries (FC). At faster cooling, the colony sizes became smaller due to multiple nucleation locations inside the grain as well (AC). As the cooling rate increased further, the colony structure was changed into martensitic structure (BQ) where the slip length and “colony” size become equivalent to the width of individual α plates (0.5 µm) resulting in a drastic increase in strength, Figure 9(a). As effective colony size increased, the slip length during plastic deformation increased and deformation occurred more readily.
Fig. 9 
Dynamic flow stress variation across the three microstructures as a function of (a) effective colony size, (b) inverse of the square root of lamellae thickness, (c) width of α grain boundary layer
-
(ii)
The dynamic flow stresses increased linearly with the inverse square root of α plate thickness (Figure 9(b)), similar to a Hall–Petch relationship reported by Lee[12] and Lin[24]
$$ \sigma = \sigma_{i} + k d^{{\frac{ - 1}{2}}} $$where the friction stress \( \sigma_{i} \) is 1376 MPa and the locking parameter \( k \), which is related to the critical shear stress and burger’s vector, is 108.5 MPa/µm0.5. Such a strong association between the lamellae thickness and flow stress is attributed to be due to slip across the aligned lamellae in the colony.[23] It is also possible that the width of the β phase between the lamellae is proportional to the lamellar thickness, resulting in reduction of the constraint for slip in the β phase at low cooling rates and hence lower strength.
-
(iii)
The thickness of the grain boundary layer decreased with increasing cooling rate. Gil[25] made a similar observation and explained this behavior as arising from bigger diffusivity at lower cooling rates which favors growth of the grain boundary layer. The presence of αGB layer at the grain boundaries can aid the mechanical response. Even as the αGB layer helps impede slip activity from the adjacent colonies, Sandala[26] showed intense slip can occur within this layer. A continuous αGB layer such as shown in Figure 4(a) is of a single orientation and typically is thicker and much longer than the α lamellae in the grain. Such layers are the weakest regions in the two phase lamellar structures and their width could be expected to have a strong effect on the strength. The dynamic flow stresses here decreased linearly with the average width of the αGB layer, Figure 9(c).

The lamellae thickness alone follows a Hall–Petch relationship with flow stresses and must hence be the determinant feature size. Even as it appears there is a strong correlation between the flow stresses and the other microstructural features, it must be noted that these feature sizes are all arising from the same cooling rate during the heat treatment. But the primary deformation mode cannot be determined through these relations alone and requires a thorough microstructural investigation, such as Schmid factor calculation as done by Antonysamy[27] for measurement orientation in the different lamellae families which would determine ease of slip.
3.3 Microstructures Post-Deformation at Room Temperature
Adiabatic shear bands were not observed in any of the three microstructures. Several researchers such as Meyers[28] and Li[29] have reported adiabatic shear banding in titanium alloys during dynamic deformation, but at plastic strains larger than 20 pct. In our specimens with only 10 pct plastic strain, it is clear strain localization has not yet initiated. The deformation in lamellar microstructures is different from equiaxed structures and can be heterogeneous as each single colony could be differently oriented to deform for each slip system. The slip systems with the highest Schmid factor are the ones most likely to deform. Chan[30] showed the critical resolved shear stress for yielding of individual colonies could vary a lot. So we can anticipate that deformation-induced features could appear differently across different colonies/regions in these post-test microstructures.
The optical images of air-cooled Widmanstätten (AC) specimen showed very curious deformation zones. While majority of the sample looked unaffected, a few regions showed ribbons of intense deformation (Figure 10), which stood out distinctly in the optical images after etching. These ribbons always occurred in clusters, and aligned in one direction. Closer observation of these features in SEM showed that these ribbons occurred perpendicular to the lamellar growth direction. The ribbons also occurred only in certain colonies. If there was an intersecting colony of lamellar growth in a different direction, the ribbons do not appear in that area. EBSD shows that all the ribbons within a prior-β grain boundary had the same orientation and were at nearly 60 deg misorientation with the colony. So it appears that Widmanstätten structures formed very large twins that occur in certain preferentially oriented colonies.

AC Widmanstätten after room temperature compression at 1000 s−1 strain rate to 0.1 strain: (a) optical image of ribbon features, (b) same features in SEM, (c) closer view of ribbon features, (d) EBSD of region in (c), (e) SEM image showing ribbons of a different shape, (f) EBSD of the region in (e) showing the ribbons to have same orientation within one prior-β grain irrespective of the shape
The furnace-cooled lamellar (FC) specimen did not show any evidence twinning, Figure 11(a), with the exception of one single region showing shear-like bending in the lamellae (Figure 11(b)). This could be the initial stage before the formation of a shear band, indicating that the dominant mechanism here could be slip rather than twinning. FC has thick αGB layers, so slip within this grain boundary layer could be a bigger contributor as well.

Optical images of FC after room temperature compression at 1000 s−1 strain rate to 0.1 strain. (a) Typical region showing no deformation damage and (b) rare region showing shear-like bending of lamellae hinting shear band initiation
The brine-quenched martensite (BQ) also did not show much evidence of damage from deformation. A few regions displayed twin-like features in the grain interior with acicular martensite α′ phase (Figure 12(a)). Occasionally slip at a grain boundary with adjacent massive martensite αM phase (Figure 12(b)) was also seen. EBSD (Figure 12(d)) shows that these features have the same grain orientation and are aligned in one direction with uniform spacing in between. Such regularity would not be present in the usual martensitic microstructure where the acicular needles would grow randomly. This presence of twins is further reasonable because in the acicular α′ phase, the plates are typically densely populated with dislocations. Manero[31] showed that the prior existence of dislocations in this grain interior could reduce the activation energy required for the nucleation of twins. The Manero study also showed that when the number of defects is not sufficient, slipping mechanism would also be present. Massive martensite αM has closely aligned plates with low initial density of defects (dislocations, α′/α′ interfaces) and hence may favor slip over twin nucleation, as seen in one occurrence shown in Figure 12(b). The size of the twin-like features was similar across this BQ and AC specimens, with the larger ones exceeding a length of 50 μm.

BQ martensite after room temperature compression at 1000 s−1 strain rate to 0.1 strain. (a) Etched optical image showing twin-like features in the grain interior acicular martensite α′ phase, (b) etched optical image showing features resembling slip impedance at the grain boundary with massive martensite αM phase, (c) unetched SEM image of the region with twins which do not look pronounced, (d) EBSD of the same region showing the twin-like features to have the same orientation
After a plastic strain of 0.1, deformation at room temperature generally did not really alter the microstructure, besides the few rare occurrences demonstrated in Figures 10, 11, and 12. Further, the type of deformation-induced features in these specimens were different. While we have early indications that the purely lamellar structure could deform by slip while the Widmanstätten and martensitic structures could also have twinning contributions, further studies are necessary to determine the extent of these contributions and their evolution as the deformation proceeds to higher strains. These will be explored in a future publication.
3.4 High-Temperature Dynamic Response
In order to study the effect of temperature on flow stress, tests were conducted at temperatures between room temperature and β transus for each of the three microstructures. Because radiance temperature (pyrometer) is used as the temperature control, the true temperature of the tests (thermocouple) varied slightly for a given selected radiance temperature control setting. The stress–strain curves are plotted in Figure 13.

High temperature dynamic stress–strain curves from testing the three microstructures FC, AC, and BQ
At room temperature, the brine-quenched martensite (BQ) was the strongest, followed by air-cooled Widmanstätten (AC) and furnace-cooled lamellar (FC). This BQ > AC > FC trend continued at high temperatures as well, except for the tests conducted around 900 °C. These tests fall in the temperature range where the allotropic transformation from hcp to bcc in Ti-6Al-4V is substantial.[17] We showed in a previous publication[18] that the hcp phase fraction is very important for the resistance of the material to deformation and that the transformation results in a sharp drop in the flow stresses between 800 °C and 1000 °C.
The equilibrium phase fraction of the hcp phase not only decreases with temperature, but decreases more rapidly as temperature approaches β transus (Figure 14). For example, the equilibrium composition changes from 0.27 β + 0.73 α at 800 °C to 0.44 β + 0.56 α at 900 °C, and finally turns 100 pct β at 1000 °C. So even a few degrees of temperature uncertainty above 900 °C could imply a very different phase composition and hence a large uncertainty in the flow stress. The observed shift in the trend in Figure 13 (BQ > AC > FC → FC > BQ > AC) is likely a manifestation of this. The α → β transformation, i.e., dissolution of α, is complete above the β transus. So all the three microstructures become simply β grains and their mechanical response should be similar. Figure 13 confirms this and shows overlapping of the three stress–strain curves above 1000 °C.

Equilibrium phase fraction of the hcp α phase in Ti-6Al-4V as a function of temperature
All the three microstructures showed similar thermal softening behavior, i.e., a comparable decrease in flow stresses with increasing temperatures. Figure 15 plots normalized flow stresses as a function of homologous temperature, so the data could be compared to the predictions by Johnson–Cook model. Earlier we developed a correction factor to the Johnson–Cook equation to account for the changing phase fractions and enabled mapping the thermal softening trend in equiaxed Ti-6Al-4V.[18] The same modification factor, G(T), should be applicable for these materials too, as G(T) is dependent on purely equilibrium phase composition. In this investigation, we found G(T) can describe the thermal softening trends in the heat treated microstructures as well (Figure 15). Once the augmented softening rate due to phase transformation was incorporated by G(T), all the three microstructures show similar temperature sensitivity m = 0.8.

Normalized flow stress at 0.08 strain plotted as a function of homologous temperature. (a) Furnace-cooled, (b) air-cooled, (c) brine-quenched conditions. Thermal softening in all microstructures could be described by the corrected Johnson–Cook model (dashed line). The uncorrected model is shown as the solid line
3.5 Microstructures Post-Testing at High Temperature
All three microstructures showed partial phase transformation after testing above 900 °C, Figure 16. The resistive heating method employed in the pulse-heating Kolsky Bar caused the specimens to undergo rapid cooling after the mechanical test. With cooling rates reaching 1000 °C/s, this is effectively a quenching condition for this material. If any α → β transformation had occurred on heating, the newly formed β would precipitate α with a characteristic acicular morphology (transformed-α′) upon quenching. This new morphology (transformed α′) is distinguishable from the α lamellae initially present in FC and AC specimens, as well as the longer acicular α′ and αM plates of BQ specimen.

Specimens post-deformation (a, b) Furnace-cooled lamellar (FC) at 912 °C ± 6 °C, (c, d) Air-Cooled Widmanstätten (AC) at 912 °C ± 6 °C, (e, f) Brine-quenched martensite (BQ) at 905 °C ± 15 °C
The furnace-cooled lamellar (FC specimen) showed the phase transformation to occur in the regions between colonies but not between the lamellae within a colony, Figures 16(a) and (b). The air-cooled Widmanstatten (AC specimen) also showed similar behavior where the transformation occurred predominantly between the colonies, Figure 16(c). Only occasionally smaller regions of transformed-α′ were also observed between the cross-woven lamellae within a basket-weave/cross-woven colony, Figure 16(d). The brine-quenched martensite (BQ specimen) showed phase transformation to occur mostly within the acicular α′ regions in the grain interior. The massive martensite αM at the prior-β grain boundaries which has closely packed plates with relatively lesser volume of remnant β phase did not show any transformed α′, Figures 16(e) and (f).
During the cooling step of the heat treatment, the grain boundary α layer is the first to nucleate in FC and AC specimens, followed by lamellae growing into the grain from these layers forming colonies. So the regions between the colonies contain larger amounts of the remnant β phase with bigger concentration of β-stabilizing Vanadium and lower concentration of α-stabilizing Aluminum. In BQ specimen, the αM plates are closely stacked while the grain interior has more β phase between the randomly stacked acicular α′ plates. So the transformation seems to preferentially initiate in those regions densest with remnant β phase.
Despite the differences in the locational preference of transformation in these lamellar structures, the total quantity of transformation seems to amount to the equilibrium fraction of that temperature, otherwise the thermal softening trend in Figure 15 would not match the predicted trend. The presence of transformed α′ in the microstructures (Figure 16) and the highly similar thermal softening behavior (Figure 15), together indicate that the phase transformation kinetics are as follows: (i) similar in the three microstructures, (ii) rapid enough to complete within the 3.5 seconds of heating time, and (iii) have a strong effect on the dynamic flow stresses. A similar studied previously conducted on equiaxed (globular) Ti-6Al-4V with a higher temperature resolution than the present experiments showed that the flow softening behavior in the transition region mimicked the equilibrium phase fractions behavior, suggesting that the phase transformation finished within 3.5 seconds of heating time and the phase transformation resulted in lower resistance of the material to deformation.
Earlier Sheshacharyulu[32] conducted a rigorous study and mapped the deformation mechanisms active in lamellar structures at various temperature and strain rate conditions. However, no one has so far reported the mechanisms operating at such high temperatures when strain rates are as high as 1000 s−1. At a strain rate of 10 s−1 and a total strain of about 50 pct, adiabatic shear banding between 800 °C and 900 °C, lamellar kinking between 900 °C and 1000 °C, and β-instability above 1000 °C were reported. But our images from Figure 16 (tested around 900 °C) show that neither adiabatic shear banding nor lamellar kinking occurred at a strain rate of 1000 s−1 when the total strain was less than about 20 pct. So entirely different mechanisms could be active during deformation at such high strain rates.
4 Conclusions
In this study, we explored for the first time the effect of microstructure on high-temperature dynamic response of Ti-6Al-4V alloy. Three microstructures—Lamellar, Widmanstätten and Martensitic morphologies, were produced through a heat treatment involving two steps—homogenization at a temperature in β phase field, followed by cooling at different rates. From comparison of their room temperature and high-temperature dynamic flow stresses, the following observations were made:
-
1.
Due to the same temperature and duration of homogenization, all three microstructures had similarly sized prior-β grains. The microstructures that were cooled at a faster rate evolved smaller colony sizes, finer lamellae, and thinner grain boundary layers.
-
2.
The flow stresses decreased linearly with colony size and grain boundary layer thickness, but followed a Hall–Petch relationship with α-plate thickness. The varying correlation of flow stress to the different microstructural feature sizes indicated multiple deformation modes being active during the dynamic compression.
-
3.
The work hardening was similar across the three microstructures.
-
4.
All three microstructures show similar thermal softening. The rate of decrease in the flow stress with temperature, i.e., thermal softening rate, was intensified above 800 °C due to hcp → bcc phase transformation. Gangireddy modification to Johnson–Cook model could account for this augmented softening and the modified model predicted the three microstructures to follow similar thermal softening coefficient m = 0.8.
-
5.
The phase transformation was not uniform but initiated predominantly at certain locations, such as the regions between the colonies in the Lamellar, between the cross-woven lamellae in the Widmanstätten, and within the grain interior with acicular α′ in the Martensite.
-
6.
The kinetics of phase transformation seem to be very rapid in Ti-6Al-4V, irrespective of the microstructural differences. Judging purely on the thermal softening behavior within the transformation zone, it is possible that the transformation could be complete within 3.5 seconds of heating time. Other high temperature phenomena such as grain growth, lamellar thickening appear slower as there was no distinct increase in the lamellar thickness or prior-β grain sizes.
References
R. Reda, A.A. Nofal, A.H.A. Hussein, J. Metall. Eng. ME., 2013, vol 2, pp. 48-55.
T. Mohandas, D. Banerjee, V.V.K. Rao, Mater. Sci. Eng. A, 1998, vol. 254, pp. 147–154,
R. Filip, K. Kubiak, W. Ziaja, and J. Sieniawski, J. Mater. Process. Technol., 2003, vol. 133, pp. 84–89.
A. Attanasio, M. Gelfi, A.Pola, E. Ceretti, C. Giardini, Materials, 2013, vol. 6, pp. 4268-4283.
S. Cedergren, G. Sjöberg, G. Petti, Procedia CIRP, 2013, vol. 12, pp. 55-60.
S.J. Sun, M.Brandt, J.Mo, Adv. Mater. Res., 2013, vol.690-693, pp. 2437-2441.
M. Nouari, H. Makich, Metals, 2014, vol. 4, pp. 335-358.
K.A. Hartley, J. Duffy, R.H. Hawley, J. Mech. Phys. Solids, 1987 vol. 35, pp. 283-301
D.K. Kim, S.Y. Kang, S. Lee, K.J. Lee, Metall. Mater. Trans A, 1999, vol. 30A, pp. 81-92.
H.J. Ryu, S.H. Hong, D. K. Kim, S. Lee, Metals and Materials., 1998, vol. 4, pp. 367-371.
A. Marchand, J. Mech. Phys. Solids., 1988, vol. 35, pp. 252-261.
D.G. Lee, S. Lee, C.S. Lee, S. Hur, Metall. Mater. Trans. A, 2003, vol. 34A, pp. 2541-2548.
D.G. Lee, S. Kim. S. Lee, C.S. Lee, Metall. Mater. Trans. A, 2001, vol. 32A, pp. 315-324.
D.G. Lee, S. Lee, C.S. Lee, Mater. Sci. Eng. A, 2004, vol. 366, pp. 25-37
A.W. Johnson, C.W. Bull, K.S. Kumar, C.L. Briant, Metall. Mater. Trans. A, 2003, vol. 34A, pp. 295- 306
S.P. Mates, R. Rhorer, E. Whitenton, T. Burns, D. Basak. Exp. Mech., 2008, vol. 48, pp. 799-807.
M. Donachie: Titanium: A Technical Guide, 2nd ed., ASM International, 2000, Chap. 3, pp. 13–25.
S. Gangireddy, S.P. Mates, J. Dyn. Behav. Mat., 2017, vol. 3, pp. 557-574.
D. Basak, H. W. Yoon, R. Rhorer, T. Burns, AIP Conf. Proc. 2003, vol. 684, pp. 753-759.
D. Basak, R.A. Overfelt, D. Wang, Int. J. Thermophys., 2004, vol. 252, pp. 561-574.
E.S.K. Menon, H.I. Aaronson, Metall. Mater. Trans. A, 1986, vol. 17A,pp. 1703-1715
T. Ahmed, H.J. Rack, Mater. Sci. Eng. A, 1998, vol. 243,pp. 206-211
G. Lutjering, Mater. Sci. Eng. A, 1998, vol. 243, pp. 32-45
F.S. Lin, E.A. Starke, S.B. Chakrabortty, A. Gylser, Metall. Mater. Trans. A, 1984, vol. 15, pp. 1229-1246
F.J. Gil, M.P. Ginebra, J.M. Manero, J. Alloys Compd., 2001, vol. 329, pp. 142-152.
R.S. Sandala: Ph.D. Thesis, Deformation Mechanisms of Two-Phase Titanium Alloys, University of Manchester UK (2013), pp. 95–105
A.A. Antonysamy: Ph.D. Thesis, Microstructure, Texture and Mechanical Property Evolution during Additive Manufacturing of Ti6Al4V Alloy for Aerospace Applications, University of Manchester UK, 2012, pp. 290–94.
M.A. Meyers, G. Subhash, B.K. Krad, L. Prasad, Mech. Mater., 1994, vol. 17, pp. 175-193.
Q. Li, Y.B. Xu, M.N. Bassim, J. Mater. Process. Technol., 2004, vol. 155, pp. 1889-1892.
K.S. Chan, C.C. Wojcik, D.A. Koss, Metall. Mater. Trans. A, 1981, vol. 12A, pp.1899-1907.
J.M. Manero, F.J. Gil, J.A. Planell, Mater., 2000, vol. 48, pp. 3353-3359.
T. Seshacharyulu, S. C. Medeiros, W. G. Frazier, and Y. V. R. K. Prasad, Mater. Sci. Eng. A, 2002, vol. 325, pp. 112–125.
Acknowledgments
The author gratefully acknowledges the support of Dr. Steven Mates and NIST Mechanical Performance Group as well as James Warren, NIST Technical Program Director for Materials Genomics. I also acknowledge the valuable assistance of Mr. Eran Vax and Mr. Eli Marcus of the Nuclear Research Center, Negev, Israel, for many improvements to the electrical heating control system.
Author information
Authors and Affiliations
Corresponding author
Additional information
Manuscript submitted February 27, 2018.
Rights and permissions
About this article

Cite this article
Gangireddy, S. Effect of Initial Microstructure on High-Temperature Dynamic Deformation of Ti-6Al-4V Alloy. Metall Mater Trans A 49, 4581–4594 (2018). https://doi.org/10.1007/s11661-018-4774-1
Received:
Published:
Issue Date:
DOI: https://doi.org/10.1007/s11661-018-4774-1