
Abstract
Studies into the magnetic susceptibility have been used to assess the soils contamination in the Krakow area. The results of topsoil (over a 2 × 2 km grid), subsoil (37 shallow holes) and soil samples (112) measurements were presented as maps of soil magnetic susceptibility (both volume and mass) illustrating the distribution of parameters in topsoil horizon (0–10 cm) and differential magnetic susceptibility maps between topsoil horizon and subsoil (40–60 cm). All evidence leads to the finding that the highest values of magnetic susceptibility of soil are found exclusively in industrial areas. Taking into consideration the type of land use, the high median value (89.8 × 10⁻⁸ m3kg−1) was obtained for samples of cultivated soils and is likely to be connected with occurrence of fertile soil (chernozem). Moreover, enrichment of soils with Pb and Zn accompanies magnetic susceptibility anomalies in the vicinity of the high roads and in the steelworks area, respectively.
Introduction
The soils of Krakow (Poland’s historic second city) located in southern Poland, have been a subject of magnetic susceptibility (MS) investigations during the last decade to determine its pollution. The first data concerning MS of soils in Krakow area come from the publication by Magiera et al. (2002). Until now, reconnaissance investigations have been done in selected parts of the city, namely in the close vicinity of the steelworks (Magiera 2004; Rosowiecka and Nawrocki 2010) and in Nowa Huta, local district (Hasso-Agopsowicz et al. 2004; Wojas 2009).
Urban soils have been recently the subject of MS investigations in other countries, e.g. Turkey (Canbay et al. 2010; Kucer et al. 2012), Jordan (El-Hasan et al. 2009; El-Hasan and Lataifeh 2013), Iran (Karimi et al. 2011, Dankoub et al. 2012), Mexico (Morton-Bermeaa et al. 2009), Romania (Gârbacea and Ioane, 2010), etc.
It should be emphasised that natural conditions (especially topography, climate and meteorological features) of Krakow have a negative impact on the circulation of air mass which in turn manifest the smog formation which we see today. Krakow is situated in an exceptionally narrow part of the Vistula valley following an east-westerly direction. Additionally, the land elevation in the western part of the city makes the flow of air mass difficult. The strength of wind is often very poor in the city and windless days are a common occurrence. For the previous reasons stated, the majority of pollutants released into the atmosphere within the city area are usually present in soil over a short distance from their original point of emission.
Geochemical studies of soil samples collected in the 1990s throughout the whole area of Poland (Pasieczna 2003) have proven that permissible levels of heavy metals, the most common of which are Pb, Zn, Cu and the following Ni, Cd, Hg are less commonly observed, were exceeded in the surrounding sites within Krakow. Geochemical anomalies have occurred mainly in the city centre and in the surroundings of the former Lenin Steelworks (currently ArcelorMittal Poland SA industrial plant, see Fig. 1), situated in the eastern part of Krakow. The steelworks, in operation since 1954, is the largest contributor of dust, ash, gaseous pollution and all airborne matter present in the atmosphere (Regional Inspectorate for Environmental Protection in Krakow 2013). Mineralogical studies of atmospheric particulate matter (PM) released by the steelworks have revealed that it contains mostly heavy metals such as Fe, Zn, Mn, as well as minor amounts of Pb, Cu, Ni, and sometimes Cd (Lis and Pasieczna 1995 and references therein). It has also indicated that the emission of gaseous particles, PM and heavy metals from “EC Kraków” heat and power plant (Fig. 1), located to east from the city centre, constitutes an important source of soil pollution. Lis and Pasieczna (1995) have suggested that soil pollution in Krakow is also associated with the functioning of local boilers and household hearths as well as increasing road traffic.

Distribution of 112 measurement sites over the area of Krakow. The map includes such aspects as type of land use, mass magnetic susceptibility (χ × 10−8 m3kg−1) of soils and the occurrence of chernozem soil
This paper concerns a magnetic susceptibility survey of soils in Krakow and laboratory studies of samples, examined in 2008–2012. The objectives of this study were as follows:
-
(a)
investigations of topsoil magnetic properties (determination of MS of soils, identification of MS anomalies),
-
(b)
indication of increased values of soils MS correlated with heavy metals concentrations,
-
(c)
analysis of the relationship between soil type (Skiba et al. 2013) and soil MS.
Materials and methods
Measurements of topsoil MS were carried out at 112 locations over a 2 × 2 km grid throughout the entire area of Krakow (Fig. 1).
The measurement sites respected specific criteria, namely:
-
minimum distance from a road—20 m,
-
existing vegetation allows for a proper contact of field survey sensor with the studied soil,
-
with the exception of forest areas, measurements were not performed in close vicinity of the tree trunks, i.e., the measurement sites were placed in uncovered areas with no barriers preventing the direct fall of air pollutants on the soil surface. In less urbanised areas, measurement sites were located mainly in wastelands, meadows and forests, whereas in strongly urbanised areas, they were situated in parks, housing estate greens, urban greens and former fortifications (Fig. 1).
Surveys of MS were carried out using MS2 meter supplied with MS2D sensor produced by Bartington Company, with approximately 6 cm measurement range. Depth of response is 50% at 1.5 cm and 10% at 6 cm (Bartington Instruments Ltd. 2002). Apparent volume magnetic susceptibility κ a (Sharma 1997) of soils was measured in situ, in 112 locations with minimum 5 repetitions in accordance with the applicable procedure (Bartington Instruments Ltd. 2002; Schibler et al. 2002). In some places the vegetation was removed to ensure a proper contact of the sensor with soil. In the case of MS exceeding 50.0 × 10⁻⁵ [SI], additionally the author drilled to a depth of approximately 100 cm and took measurements of MS in the excavated area with the use of down-hole MS2H sensor. Furthermore, an extensive soil material [112 soil samples from the depth (0–10) cm] was collected at each measurement site during fieldwork for laboratory measurements, including MS measurements and geochemical analysis. The soil material, collected from the depth of (0–10) cm, was dried at room temperature, crushed and placed in 10 cm3 plastic containers.
In the next stage, the laboratory magnetometric studies involved study of low-frequency (465 Hz) volume magnetic susceptibility (κ). Volume MS of total of topsoil samples was measured using the MS2 meter with MS2B sensor working in the magnetic field of 80 A/m (Bartington Instruments Ltd. 2002). Subsequently, after weighing the soil samples, their mass magnetic susceptibility (χ) was calculated according to the formula:
where: κ volume MS [−], ρ volume density [kg/m3].
Values of χ are density-independent, hence the comparison of magnetic properties of material coming from different environments is possible.
Geochemical analysis, including pH value and content of heavy metals (Pb, Zn, Cu, Cd, Ni, Fe) was carried out for soil samples (37) with κ above 30.0 × 10⁻⁵ [SI]. Soil reaction (pH) was determined by potentiometric method, whereas the content of heavy metals in soil was measured with atomic absorption spectrometry (AAS). The study included the heavy metals that can contaminate soils in Krakow (Pasieczna 2003).
On the basis of the results of surveys and laboratory studies, maps of MS of soils in Krakow have been constructed, namely:
-
1.
map of the apparent volume magnetic susceptibility of topsoil (at the depth of 0–10 cm) (Fig. 2),
Fig. 2 
Map of apparent volume magnetic susceptibility (κ a × 10−5 [SI]) of topsoil (0–10 cm) in Krakow (Wojas 2012)
-
2.
map of the mass magnetic susceptibility of topsoil (Fig. 3),
Fig. 3 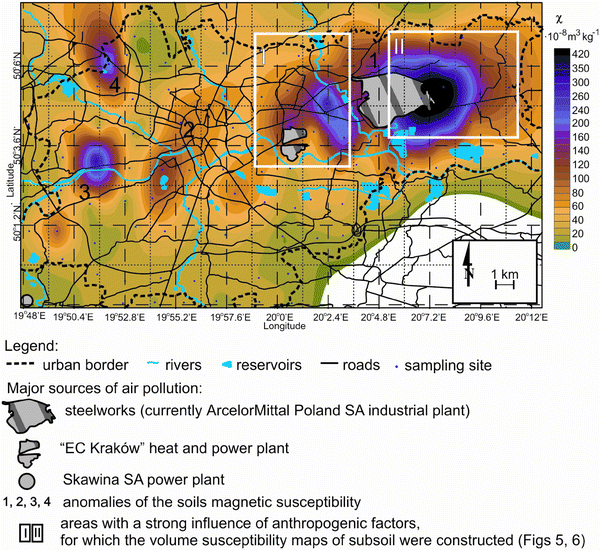
Map of mass magnetic susceptibility (χ × 10−8 m3kg−1) of topsoil (0–10 cm) in Krakow
-
3.
map of the volume magnetic susceptibility of subsoil (at the depth of 40–60 cm) for areas subjected to high anthropogenic factors (Figs. 5b, 6b), namely urbanised surroundings of industrial areas,
-
4.
maps of differential magnetic susceptibility between topsoil (0–10 cm) and subsoil at the depth of (40–60) cm for areas subjected to high anthropogenic factors (Figs. 5c, 6c).


The magnetic susceptibility maps were prepared using ‘Surfer Surface Mapping System’ software provided by Golden Software.
The maps (Figs. 2, 5, 6) contain two thick isolines with values 30.0 × 10⁻⁵ [SI] and 50.0 × 10⁻⁵ [SI]. In Upper Silesia (strongly industrialised region of Poland), the values of κ a of soil in the range of (30.0–50.0) × 10−5 [SI] indicate a considerable risk of soil contamination with heavy metals, while the values exceeding 50.0 × 10⁻⁵ [SI] imply the absolute necessity of geochemical studies (Magiera 2004, Strzyszcz et al. 2006). On the other hand, soils in the unpolluted region of the Carpathians are characterised by low MS values, usually below 30.0 × 10⁻⁵ [SI] (Magiera et al. 2002; Gonet and Wojas 2016). It should be mentioned that topsoil MS depends on magnetic mineralogy, concentration and grain-size of magnetic particles in soil. The parent material on which the soil is formed and pedogenesis intensity cannot be omitted. For these reasons, each finding and the data received therein is case specific and independent of each of other.
Results and discussion
Apparent volume magnetic susceptibility of topsoil (0–10 cm)
Topsoil (0–10 cm) κ a in the whole area of Krakow varies in a very wide range, i.e. (11.8–434.6) × 10−5 [SI]. The high average value of the all measurements (53.0 × 10⁻⁵ [SI]) points to the significant influence of anthropogenic factors on top layer of soil. On the map of topsoil magnetic susceptibility (Fig. 2), three major MS anomalies (positive, with increased values of MS) can be distinguished. These anomalies occur in different parts of Krakow: eastern (1), central (2) and south-western (3).
Anomaly 1 is the biggest one. An extension of the anomaly and its approx. W-E orientation are in clear relation (Magiera et al. 2016) with west winds prevailing in Krakow. The anomaly is marked by two peaks. The first one is situated in the centre of Nowa Huta district, to the west of the steelworks (Fig. 2). High MS (220.0 × 10⁻⁵ [SI]) is probably caused by soil pollution with magnetic particles originating from high traffic in this region. The second, much larger peak of the anomaly is situated in close proximity to the steelworks, on the eastern side. It should be noted that it corresponds to increased heavy metals contents in soil, especially Zn, Pb, Cu and Cd (Pasieczna 2003). Very high values of topsoil MS in the close vicinity of the steelworks, reaching 434.6 × 10⁻⁵ [SI] (Jarzyna et al. 2012), are mainly associated with technogenic magnetic particles (TMP) (Magiera et al. 2011, 2015) arising from industrial emission and comprising iron compounds (oxides, sulphides, etc.). The industrial pollutions emitted by ArcelorMittal Poland SA consist of iron minerals such as: magnetite Fe2+ Fe3+ 2O4, hematite α- Fe2O3, siderite FeCO3, wüstite Fe2+O, olivine (Fe, Mg silicate), melanterite Fe2+[SO4]·7H2O, ilesite (Mn, Zn, Fe)SO4·4H2O (Manecki and Marszałek 1993). This is reflected in the strong correlation between MS and Fe (see “Geochemical studies of topsoil (0–10 cm)” section). The increase of topsoil MS in this part of the city can be additionally caused by other anthropogenic factors, such as:
-
thermal transformations of magnetic minerals in soil caused by a consequence of burning grass (currently prohibited by law, although still taking place),
-
the corrosion and rubbing of metal railway elements,
-
the usage of chemical fertilisers (containing ash) in agricultural areas (Hasso-Agopsowicz et al. 2004),
which cause the enrichment of soil with iron compounds.
Furthermore, no assurance can be given to the fact that geogenic factors have no influence on the soil MS due to the weathering of magnetic minerals present in rocks creating the foundation of railway track and, moreover, the occurrence of chernozem soil (Fig. 1) characterised by stronger magnetic properties (Jeleńska et al. 2004) compared with other soil types.
In summary, topsoil κ a measured in the vicinity of the steelworks are:
-
lower in confrontation with MS of soils exposed to strong human impact, e.g. in the strongly industrialised Upper Silesia region (Magiera et al. 2002), as well as in the areas in the proximity of power plants, e.g. Chrzanów and Jaworzno (Heller et al. 1998),
-
higher in comparison to MS of soils near others ironworks in southern Poland (Rosowiecka and Nawrocki 2010).
The topsoil in western part of the anomaly 1, situated within the area of “EC Kraków” heat and power plant (Fig. 2), is strongly magnetic with MS varying in the range of (50.0–145.0) × 10−5 [SI]. The anomaly may be caused by magnetic particles released with ash from the heat and power plant as well as particles accompanying road traffic pollution. Moreover, in these soils the limit values of Cu and Pb content are exceeded (Pasieczna 2003).
Magnetic susceptibility anomaly 2 (Fig. 2) in the Krakow city centre is less extensive. This anomaly has a visibly elongated shape and its intensity is about four times lower (maximum κ a is 119.4 × 10⁻⁵ [SI]) in comparison to anomaly 1. It is almost certainly associated with soil pollution by magnetic particles released by road transport. The influence of traffic on the soil magnetic properties is clearly visible on the map along the main roads. A localization and an extension of the anomaly is strictly connected with a position on the map of dual carriageway road which is the only road running through the city centre, in the N–S direction, connecting nearby cities in the south part of Poland. In the effect, a very high intensity of road traffic and road congestion are often observed in this region. The anomaly is connected also with coal burning in local boilers and coal stoves in households.
A moderate in size, magnetic susceptibility anomaly 3 is located in S–W part of the city (Fig. 2). Its extension is similar to the anomaly 2. In this case, a maximum value of topsoil MS occurs on the hillside in a forest and amounts to 73.0 × 10⁻⁵ [SI]. Sources of increased values of MS may be an accumulation of dust and fly ashes in soil, emitted by Skawina SA power plant (located near the south-western border of Krakow, Fig. 2) and air pollutions from strongly industrialised region of Upper Silesia. A lithogenic origin (occurrence of calcareous soils in this region) can be also influential because of enhancement content of Fe and Pb (Dankoub et al. 2012) in soils.
The presented anomalies of topsoil magnetic susceptibility cover the most of the Krakow area. In the other places, MS of topsoil is distinctly lower and ranges between (10.0–30.0) × 10−5 [SI].
Mass magnetic susceptibility of topsoil (0–10 cm)
Weighing of 112 soil samples allowed the author to determine volume density (ρ) of sample collection and afterwards establish mass MS (i.e. χ). Median value of soil χ, as the most representative value, was calculated for five groups of samples collected in areas of different land development (Table 1). The results show that forest soils and cultivated soils (mostly located close to the steelworks) have the highest median values (106.9 × 10⁻⁸ and 89.8 × 10⁻⁸ m3kg−1, respectively). Lower value is observed in the case of soils of lawns and city parks (62.8 × 10⁻⁸ m3kg−1). Similar, lower χ median values have been noted in areas of meadows (35.4 × 10⁻⁸ m3kg−1) and wastelands (27.9 × 10⁻⁸ m3kg−1).
The results of χ have been compared (Table 1) with χ of soils in Poland (Magiera et al. 2002). It can be concluded that soils in Krakow vs. Poland display:
-
conspicuously lower maximum values of χ (in each of the considered type of land use),
-
higher median values of χ in meadows, forest areas, cultivated fields as well as, lawns and parks,
-
lower median value of χ in wastelands.
Afterwards, a map of χ of topsoil in Krakow was constructed on the basis of 112 values (Fig. 3). Anomaly 1, prevalent in the eastern part of Krakow, is clearly visible (Fig. 3). The second peak of the anomaly, observed in the centre of Nowa Huta district, is also prominent. Anomaly 2 has a lower intensity specifically in the city centre. The most attention is paid to the western part of Krakow. Anomaly 3 in the south-western region of the city is considerably stronger because of a much higher value of χ for sample 87 (Fig. 1). High χ values for sample 87 as well as 41 can be related with uninterrupted accumulation of magnetic particles for many years taking into account the type of land use (forests) (Magiera et al. 2006).
Contrary to the map of κ a (Fig. 2), fourth positive anomaly has appeared on the map of mass MS (Fig. 3). It is situated in the north-western part of the city and has no equivalent on the previous map. It is caused probably by impeded contact of MS2D sensor with soil (due to dense and high grass). Nevertheless, additional MS measurements, in a denser measurement and sampling network, should be taken in the future to take a deeper insight into this discrepancy.
What is more, an attempt to find a connection between χ and type of soil was made. The types of soil in Krakow area were taken from publication by Skiba et al. (2013). Unfortunately, the study has revealed the lack of clear relationship between topsoil MS and the soil type. This fact can be caused by considerable pollution of soil in Krakow.
Geochemical studies of topsoil (0–10 cm)
Geochemical studies of soil samples have concerned the determination of pH and content of six heavy metals (Pb, Zn, Cu, Cd, Ni and Fe). The results are shown in Table 2 (exceeded values are in bold).
The studies have indicated that the soils are predominantly alkaline (pH > 7.5) (Polish Standard PN-ISO 10390: 1997) and confirmed the previous geochemical studies (Pasieczna 2003). Soils with the strongest (7.7–9.0) alkaline reaction were noted in the vicinity of the steelworks. The Pearson correlation coefficient between MS and Fe, calculated for alkaline soils collected in the eastern part of Krakow is >0.83 (statistical significance level p = 0.05). The alkaline reaction of soils is chiefly associated with the natural calcareousness of loess occurring in this area (Gradziński 1972). Furthermore, possible alkaline character (Magiera et al. 2011) of TMP settled on the ground surface can also affect soil reaction. The exception is low pH value (5.25, an acidic reaction) of soil sample 108 (Fig. 1) from agricultural area (to the east of the steelworks). Due to increased value of MS and acidic reaction of soil, the soil liming procedure is recommended in order to limit the absorption of heavy metals by plants which are cultivated in this area (Hołubowicz-Kliza 2006).
Conversely, pH of soils in areas without strong influence of human factor (i.e., forest areas) are strongly acidic or acidic [<5.0 or (5.1–6.0), respectively].
Geochemical analysis of heavy metals concentration in soils has demonstrated that high content of Zn accompanies the increased value of MS only in the close vicinity of the steelworks. In this case the highest concentration of Zn in soil amounts to 1494 ppm (anomaly 1, sampling site 101, see Fig. 1).
There is an increased content of Zn (293 ppm, the limit value is 300 ppm) and Pb (80 ppm, the limit value is 100 ppm) in the soils of the city centre (anomaly 2, sampling site 100, see Fig. 1). Furthermore, in the forest area of anomaly 3 (sampling site 87, see Fig. 1), the Zn content is enhanced (238 ppm) and, what is more, the limit value of Pb content is exceeded (139 ppm). It should be mentioned that previous geochemical studies of soils from this region (Pasieczna 2003) showed low content of heavy metals (Pb, Zn, Cd, Cu and Hg).
It is worth emphasising that permissible contents of Cu, Cd, Ni in soils are not exceeded in any of the areas with increased values of soil MS (>30.0 × 10⁻⁵ [SI]).
Geochemical analyses were supplemented with the correlation between the mass MS and concentrations of heavy metals expressed by pollution load index (PLI) (Tomlinson et al. 1980):
where:
CFn—contamination factor, the ratio of the metal’s concentration (Fn element) to its background value (the lowest concentration value for this element),
n—number of elements.
The Pearson’s correlation coefficient is R = 0.75 (Fig. 4) for group of samples (closed circles) with the exception of two samples (11 and 112, closed triangles) from the nearest distance from the industrial plant.

Plot of the correlation between the mass MS and concentrations of heavy metals expressed by pollution load index (PLI)
Magnetic susceptibility of subsoil (40–60 cm) and differential magnetic susceptibility maps between topsoil horizon and subsoil
An average value of subsoil MS in strongly industrialised regions of Krakow (near the steelworks and the heat and power plant) amounts to the level of 40.0 × 10⁻⁵ [SI] and is slightly higher than topsoil MS ((10.0–30.0) × 10−5 [SI]) in areas with a weak impact of anthropogenic factors.
Subsoil MS in the vicinity of the heat and power plant (Fig. 5b) ranges from 18.2 to 62.8 × 10⁻⁵ [SI]. The enhanced MS values (above 50 × 10−5 [SI]) may be connected with magnetic properties of alluvia of Vistula river (Skiba et. al 2013) and easier migration of magnetic minerals in the soil profile because of looser and better permeable alluvial soil.

In the centre of Nowa Huta district (Fig. 5b), lower values of subsoil MS (below 50 × 10−5 [SI]) have been noted (Fig. 5b). It is probably the effect of a lower content of magnetic particles occurring in the soil at the depth of (40–60) cm and confirms the accumulation of heavy metals mainly in upper horizons of soil profile.
In addition, maps of differential κ a have been prepared in order to gain a better insight into a level of soil pollution in areas strongly affected by the human activity. The maps, representing the difference between κ a of topsoil (0–10 cm) and subsoil (40–60 cm), reflect topsoil pollution.
Anomaly in differential MS map (Fig. 5c) is observed in the centre of Nowa Huta district. Increased MS values (up to 180.0 × 10⁻⁵ [SI]) are the evidence of highly urbanised area with heavy traffic.
The subsoil MS to the west and north-east of the steelworks suggests a possible relationship with soil type (comp. Figs. 1, 6b), i.e., chernozem soil (Skiba et al. 2013) which exhibits naturally stronger magnetic properties (Hanesch and Scholger 2005). In the chernozem soil areas, MS values reach 80.0 × 10⁻⁵ [SI] (Fig. 6b). On the other hand, in the areas covered with soil of different type (situated S and SE of the steelworks), the subsoil MS is lower (<40.0 × 10⁻⁵ [SI]).

A high differential MS of soils in close proximity of the steelworks reaches 340.0 × 10⁻⁵ [SI] (Fig. 6c) and is determined by distinctly higher (up to 420.0 × 10⁻⁵ [SI]) MS of topsoil (Fig. 6a) compared to subsoil MS (Fig. 6b). This fact indicates topsoil pollution and in consequence very serious danger for pollution of plants cultivated in this region.
Conclusions
In this study area, which includes urbanised, industrialised and agricultural regions, anthropogenic factors play a key role in the creation of soil magnetic properties (especially MS) and soil pollution. This study allows the author to locate with accuracy four key areas which represent high risk of soil pollution. The research confirms that industrial emissions have the strongest influence on the level of topsoil pollution in Krakow.
The magnetic susceptibility anomaly 1 (maximum value of 651.4 × 10⁻⁸ m3kg−1) is clearly visible on the map in the vicinity of the steelworks region. Geochemical studies of samples show that Zn and Pb content in soil exceeds the permissible values, in this area. Dangerous components of the particulate matter in the atmospheric air (heavy metals, toxic substances, etc.) deposited in the soil throughout the last century pose a severe threat for the quality of crops growing in this area. For this reason both monitoring and protection of the environment are of paramount importance reference the area in close proximity of the steelworks.
In addition, subsoil MS may be connected with geogenic (natural) factors associated with occurrence of chernozem soil. Natural enhancement MS (over 40.0 × 10⁻⁵ [SI]) at the depth of (40–60) cm confirms the stronger magnetic properties of chernozem soil.
Topsoil in Krakow yields lower values of MS in comparison to soils in strongly industrialised areas in Poland (e.g. Upper Silesia). Nevertheless, only MS of soils in wastelands (27.9 × 10⁻⁸ m3kg−1) is lower in comparison, than those found in Poland. MS of soil in cultivated fields (89.8 × 10⁻⁸ m3kg−1) is significantly higher due to the adjacent steelworks area. Furthermore, high κ a values obtained in the forest areas can be related with uninterrupted accumulation of magnetic particles for many years.
The factor of wind direction is especially important in the case of MS anomaly 1 caused by pollution from ArcelorMittal Poland SA industrial plant. Consequently other sources of soil pollution for example, traffic and low emissions are unaffected by wind direction.
The influence of road traffic on soil magnetic properties is recognised in the vicinity of the high roads in the centre of Krakow (anomaly 2), and in the centre of Nowa Huta district (anomaly 1). Enrichment of soils with Pb accompanies MS anomalies in the central part of Krakow.
The anomalies on the maps of κ a and mass MS of soils are qualitatively matching.
Considerable topsoil (0–10 cm) pollution has not allowed the author to determine a relationship between soil MS and soil type.
Additional study (hysteresis loops, anhysteresis magnetic susceptibility, etc.) of soil samples collected in the MS anomalies areas should be carried out in order to describe magnetic minerals in detail. Furthermore, the origin of anomaly 4, near the Krakow boarder, has not been completely investigated and more detailed survey (denser measurement network) will be planed.
In the end, magnetic susceptibility mapping could be a useful tool in assessment of soil pollution in Krakow and could be used in soil monitoring.
References
Bartington Instruments Ltd. (2002) Operation manual for MS2 magnetic susceptibility system, OM0408, Issue 27, Oxford, UK, ISBN: 0 9523409 0 9
Canbay M, Aydin A, Kurtulus C (2010) Magnetic susceptibility and heavy-metal contamination in topsoils along the Izmit Gulf coastal area and IZAYTAS (Turkey). J Appl Geophys. 70(1):46–57. doi:10.1016/j.jappgeo.2009.11.002
Dankoub Z, Ayoubi S, Khademi H, Lu SG (2012) Spatial distribution of magnetic properties and selected heavy metals in calcareous soils as affected by land use in the Isfahan region, Central Iran. Pedosphere 22(1):33–47. doi:10.1016/S1002-0160(11)60189-6
El-Hasan T, Lataifeh M (2013) Field and dual magnetic susceptibility proxies for heavy metal pollution assessment in the urban soil of Al-Karak City, South Jordan. Environ. Earth Sci. 69:2299–2310. doi:10.1007/s12665-012-2058-4
El-Hasan T, Al-Nawiseh AJ, Lataifeh MS (2009) Environmental magnetism: heavy metal concentrations in soils as a function of magnetic materials content. Jordan J Earth Environ Sci 2(Sp. Publ. No. 1):38–49 ISSN: 1995-6681
Gârbacea GF, Ioane D (2010) Geophysical mapping of soils. New data on Romanian soils based on magnetic susceptibility. Rom J Geophys 54:83–95. Bucureşti, ISSN: 1220-5680
Gonet T, Wojas A (2016), Investigations of magnetic properties of soils in the Cisna—Wetlina Landscape Park. Geol Geophys Environ 42(1):7–19. ISSN: 299-8004
Gradziński R (1972) Przewodnik geologiczny po okolicach Krakowa, Wydawnictwa Geologiczne, Warsaw, UKD 55(026)(438.311-194,2) (in Polish)
Hanesch M, Scholger R (2005) The influence of soil type on the magnetic susceptibility measured throughout soil profiles. Geophys J Int 161(1):50–56. doi:10.1111/j.1365-246X.2005.02577.x
Hasso-Agopsowicz A, Jeleńska M, Wicik B (2004) Magnetic susceptibility of chernozems. MGRSD 11:57–61. e-ISSN: 2084-6118
Heller F, Strzyszcz Z, Magiera T (1998) Magnetic record of industrial pollution in forest soils of Upper Silesia, Poland. J Geophys Res 103(B8):17767–17774. Paper No. 98JB01667, 0148-0227/98/98JB-01667509.00
Hołubowicz-Kliza G (2006) Wapnowanie gleb w Polsce, Instrukcja upowszechnieniowa, No. 128, IUNG-PIB Publisher, Puławy, ISBN: 83-89576-31-7 (in Polish)
Jarzyna JA, Dec J, Karczewski J, Porzucek S, Tomecka-Suchoń S, Wojas A, Ziętek J (2012) Geophysics in near-surface investigations. In: Hwee-San L (ed) New achievements in geoscience. ISBN: 978-953-51-0263-2, InTech. 46-80. doi:10.5772/37067
Jeleńska M, Hasso-Agopsowicz A, Kopcewicz B, Sukhorada A, Tyamina K, Kądziałko-Hofmokl M, Matviishina Z (2004) Magnetic properties of the profiles of polluted and non-polluted soils. A case study from Ukraine. Geophys J Int 159:104–116. doi:10.1111/j.1365-246X.2004.02370.x
Karimi R, Ayoubi S, Jalalian A, Sheikh-Hosseini AR, Afyuni M (2011) Relationships between magnetic susceptibility and heavy metals in urban topsoils in the arid region of Isfahan. Central Iran. J Appl Geophys. 74:1–7. doi:10.1016/j.jappgeo.2011.02.009
Kucer N, Sabikoglu I, Can N (2012) Measurements of environmental pollution in industrial area using magnetic susceptibility method. Acta Physica Polonica A 121(1):20–22. PACS: 91.25.fd, 91.62.Rt
Lis J, Pasieczna A (1995) Geochemical atlas of Cracow and environs: 1:100 000. Polish Geological Institute, Warsaw (in Polish). ISBN 83-7372-852-X
Magiera T (2004) Wykorzystanie magnetometrii do oceny zanieczyszczenia gleb i osadów jeziornych, Works and Studies: No. 59, Institute of Environmental Engineering Polish Academy of Sciences in Zabrze, ISBN: 8391382486 (in Polish)
Magiera T, Lis J, Nawrocki J, Strzyszcz Z (2002) Magnetic susceptibility of soils in Poland. Institute of Environmental Engineering Polish Academy of Sciences in Zabrze, Poland (in Polish). ISBN 83-86986-64-6
Magiera T, Strzyszcz Z, Kapička A, Petrovsky E, Team Magprox (2006) Discrimination of lithogenic and anthropogenic influences on topsoil magnetic susceptibility in Central Europe. Geoderma 130:299–311. doi:10.1016/j.geoderma.2005.02.002
Magiera T, Jabłońska M, Strzyszcz Z, Rachwał M (2011) Morphological and mineralogical forms of technogenic magnetic particles in industrial dusts. Atmos Environ. 45(25):4281–4290. doi:10.1016/j.atmosenv.2011.04.076
Magiera T, Parzentny H, Róg L, Chybiorz R, Wawer M (2015) Spatial variation of soil magnetic susceptibility in relation to different emission sources in southern Poland. Geoderma 255–256:94–103. doi:10.1016/j.geoderma.2015.04.028
Magiera T, Parzentny H, Łukasik A (2016) The influence of the wind direction and plants on the variability of topsoil magnetic susceptibility in industrial and urban areas of southern Poland. Environ Earth Sci. 75:213. doi:10.1007/s12665-015-4846-0
Manecki M, Marszałek M (1993) Zanieczyszczenie atmosfery w Krakowie, Cykl: Problemy ekologiczne Krakowa, Nr 16 Globalne, kontynentalne i lokalne zanieczyszczenia atmosfery. Wydawnictwa AGH, Kraków (in Polish)
Morton-Bermeaa O, Hernandeza E, Martinez-Pichardoa E, Soler-Arechaldea AM, Lozano Santa-Cruzb R, Gonzalez-Hernandeza G, Beramendi-Oroscob L, Urrutia-Fucugauchia J (2009) Mexico City topsoils: heavy metals vs. magnetic susceptibility. Geoderma 151(3–4):121–125. doi:10.1016/j.geoderma.2009.03.019
Pasieczna A (2003) Atlas of urban soils contamination in Poland. Polish Geological Institute, Warsaw (in Polish). ISBN 83-7372-636-5
Polish Standard PN-ISO 10390 (1997) Jakość gleby. Oznaczanie pH (in Polish). http://sklep.pkn.pl/pn-iso-10390-1997p.html. Accessed 24 Apr 2017
Regional Inspectorate for Environmental Protection in Krakow (2013) Raport o stanie środowiska w województwie małopolskim w 2012 roku, Cracow, ISBN: 978-83-63638-05-4 (in Polish)
Regulation of the Minister of Environment of 9 September 2012 (2012) w sprawie standardów jakości gleby oraz standardów jakości ziemi. Journal of Laws (in Polish). http://isap.sejm.gov.pl/DetailsServlet?id=WDU20021651359. Accessed 24 Apr 2017
Rosowiecka O, Nawrocki J (2010) Assessment of soils pollution extent in surroundings of ironworks based on magnetic analysis. Stud Geophys Geod. 54:185–194. doi:10.1007/s11200-010-0009-7
Schibler L, Boyko T, Ferdyn M, Gajda B, Holl S, Jordanova N, Rfsler W, Team MAGPROX (2002) Topsoil magnetic susceptibility mapping: data reproducibility and compatibility, measurement strategy. Stud Geophys Geod 46:43–57. doi:10.1023/A:1019885532390
Sharma PV (1997) Environmental and engineering geophysics. Cambridge University Press, UK. ISBN 9781139171168
Skiba S, Drewnik M, Szymański W, Żyła M (2013) Chapter. 6. Gleby. In: Degórska B, Baścik M (eds) Środowisko przyrodnicze Krakowa, Cracow. ISBN: 978-83-88424-89-2 (in Polish)
Strzyszcz Z, Magiera T, Rachwał M (2006) Application of Soil magnetometry for identification of technogenic anomalies in trace metal and iron contents: a case study in the Katowice Forest district. Polish J Environ Stud 15(2a):176–184. doi:10.2478/v10239-012-0039-7
Tomlinson DL, Wilson JG, Harris CR, Jeffrey DW (1980) Problems in the assessment of heavy-metal levels in estuaries and the formation of a pollution index. Helgolander Meeresun. 33(1–4):566–575. doi:10.1007/BF02414780
Wojas A (2009) Badania podatności magnetycznej gleb miejskich w Krakowie. Geologia, kwartalnik AGH 35(z. 2/1):489–496 (in Polish)
Wojas A (2012) Badanie podatności magnetycznej gleb na obszarze Krakowa jako wskaźnika ich zanieczyszczenia. Górnictwo i Geologia, kwartalnik Politechniki Śląskiej 7:287-299. ISSN: 1896-3145 (in Polish)
Acknowledgements
The author would like to thank Reviewers for their important suggestions.
The study was conducted under Dean’s Grant No. 15.11.140.077 entitled “Measurements and initial processing of measurement data concerning the magnetic susceptibility of soils in the Krakow region”, AGH University of Science and Technology, Faculty of Geology, Geophysics and Environmental Protection.
Author information
Authors and Affiliations
Corresponding author
Rights and permissions
About this article

Cite this article
Wojas, A. The magnetic susceptibility of soils in Krakow, southern Poland. Acta Geophys. 65, 453–463 (2017). https://doi.org/10.1007/s11600-017-0041-x
Received:
Accepted:
Published:
Issue Date:
DOI: https://doi.org/10.1007/s11600-017-0041-x