
Abstract
Non-point source pollution is a significant environmental issue in small watersheds in China. To study the effects of rainfall on pollutants transported by runoff, rainfall was monitored in Xueyan town in the Taihu Lake Basin (TLB) for over 12 consecutive months. The concentrations of different forms of nitrogen (N) and phosphorus (P), and chemical oxygen demand, were monitored in runoff and river water across different land use types. The results indicated that pollutant loads were highly variable. Most N losses due to runoff were found around industrial areas (printing factories), while residential areas exhibited the lowest nitrogen losses through runoff. Nitrate nitrogen (NO3-N) and ammonia nitrogen (NH4-N) were the dominant forms of soluble N around printing factories and hotels, respectively. The levels of N in river water were stable prior to the generation of runoff from a rainfall event, after which they were positively correlated to rainfall intensity. In addition, three sites with different areas were selected for a case study to analyze trends in pollutant levels during two rainfall events, using the AnnAGNPS model. The modeled results generally agreed with the observed data, which suggests that AnnAGNPS can be used successfully for modeling runoff nutrient loading in this region. The conclusions of this study provide important information on controlling non-point source pollution in TLB.
Introduction
Non-point source pollution (NPSP) is the addition of impurities into a surface water body or an aquifer, usually through an indirect route and from spatially diffuse sources. This has developed into a global and regional environmental issue. Globally, it has become the most widespread environmental degradation issue in recent years (Kim et al. 2014).
Surface runoff is the main medium of transport for non-point source pollutants (Owens et al. 2008). Runoff from agricultural land is generally enriched with sediments, nutrients, and pesticides (McKee et al. 2000; Sharpley et al. 2008). Presently, leaching and runoff from agricultural land contribute to the pollution of natural waters to a much greater degree than it did a few decades ago (Bian et al. 2014). It has become one of the greatest threats to water quality in the world (Liu et al. 2014). To our best knowledge, the generation of NPSP is mainly related to rainfall intensity (Hatfield et al. 2009), rainfall frequency (Fouz et al., 2009), and land use type (Ouyang et al. 2014) and changed with them. Thus, NPSP in different watershed has its specific spatial distributions and temporal trends.
China is one of the largest producers and consumers of chemical fertilizers in the world. Excessive nutrient loading from agricultural watersheds is considered to be the principal source of NPSP (Guo et al. 2004). Since measures for the abatement of point source pollution have been instituted, the contribution from non-point sources accounts for much of the water quality degradation in China. The issue of NPSP is particularly serious in the Taihu Lake Basin (TLB), located in Jiangsu Province. Lake Taihu is the third largest freshwater lake in China and is surrounded by densely populated and urbanized areas. However, agriculture contributes significantly to the local economy. As a result, eutrophication in the lake has increased significantly in recent years, with a corresponding deterioration in water quality. Eutrophication is caused by excessive amounts of nutrients (mainly nitrogen, N, and phosphorus, P) being transported into a water body (Qiao et al. 2012). Although, there were models such as the Soil and Water Assessment Tool (SWAT) (Shen et al. 2015) and Agricultural Non-point Source Pollution Model (AGNPS) (Haregeweyn and Yohannes 2003) to evaluate NPSP, to our knowledge, in complex TLB, a few studies have used watershed models for investigating rainfall runoff generation or the fate and transport of contaminants arising from non-point source activities.
In this study, rainfall distribution was documented over a year in the town of Xueyan, which lies in the TLB. The predominant forms of N and P, and their concentrations and transport, as well as chemical oxygen demand (COD), were analyzed during both rainfall events and in microcatchments across different land use types. Furthermore, we applied the AnnAGNPS model to current landscape scenarios to examine potential changes in N and P loading caused by NPSP. A feasibility and adaptability test was carried out on the model’s parameters. The results of this study establish an important foundation for designing a regional wastewater treatment facility to treat non-point source pollutants from a contaminated watershed.
Materials and methods
Site description
This study was conducted in the town of Xueyan (Wujin City), with an area of 33.01 km2 (31.5° N, 120.1° E). The town is located in a characteristic alluvial floodplain, where rice (Oryza sativa) and wheat (Triticum aestivum) are the main crops.
The Xueyan area has a humid subtropical climate with distinct seasons. The mean annual temperature is 16 °C and mean annual rainfall is 1100–1400 mm (60–70 % of which occurs from June to October, during the rice production season). The population of the Xueyan area is about 30,000 of which 3195 live in the town center, while the rest reside in surrounding villages. The area of paddy fields in Xueyan is about 1133 ha (about 32 % of the total area), while dryland fields occupy about 270 ha (7.6 % of the total area). Mountainous areas and settled areas occupy about 700 ha (20 % of the total area) and 260 ha (7.3 % of the total area and 1.4 % of the town center), respectively. The remainder consists of water bodies, factories, etc. (Fig. 1).

Geographical location of Xueyan Town
There are three main reasons for the selection of Xueyan for a case study: (1) It is a representative area for studying land use allocations in a small watershed; (2) land use patterns in small watersheds tend to be relatively simple, which simplifies understanding of how land use type influences nitrogen and phosphorus loss and can thus assist in identifying model parameters; and (3) the Taihu Lake watershed is naturally closed. Since there is only one outlet, it is simple to monitor trends in nutrient levels.
Experimental design
Runoff is a carrier of farmland nutrients such as N and P. Intensive rainstorms contribute most of the precipitation in Xueyan, which facilitates the release of non-point source pollutants. In this study, we used field investigations to analyze changes in nitrogen, phosphorus, and COD in the lake during and after rainfall events, as well as along the river.
Four representative sampling locations were selected in the vicinity of the Yapu River, namely, Xueyan Bridge (entrance of the town), Xuema Bridge (outflow from the town), Wanshou Bridge (small industrial zone with a sewage treatment plant nearby), and Yapu Bridge (Xueyan valley export route for commodities), to sample and monitor their water quality with respect to N, P, and COD. Four main non-point source pollution types were examined in this project: agricultural land, rural residential sources, urban residential sources, and poultry production. Each representative sampling location was corresponding to each land use type, respectively. In other words, every representative sampling location was the typical point of the land use type.
Sample analysis and data collection
Considering the stability, continuity, and comparability of the water quality across the different sampling points around Xueyan as described in Fig. 1, all parameters were monitored monthly for a year (March 2009 to February 2010).
All water samples were collected in the middle of the river, 0.5 m below the surface. The reasons that water samples were collected in the middle of the river were as follows: One was according to the national standard of China, and the other was that each water sample point was in closed area where there was almost no upstream water. The surface water at each site was gathered before and immediately after heavy rain events, which tend to cause water to be lost over the local dams (10 cm lower than the field ridge) at the outlet of each plot. The volume of water outflow was recorded using a flow meter set at the water outlet. Three random water samples from different positions were collected, composited, and then immediately filtered and refrigerated at 4 °C for analysis. The concentration of total phosphorus (TP), NH4-N, NO3-N, and total nitrogen (TN) was measured according to standard methods (National Environmental 1991) and analyzed using UV-220 spectrophotometry.
During average rainfall events, the concentrations of N and P as well as COD were monitored at the sampling sites as well as in the river along the runoff path every 3 h, on average. The frequency of sampling was adjusted as needed depending on rainfall intensity.
Rainfall data were obtained using a Digital Rainfall Monitoring Meter (type: JDZ-1), calibrated to meet accuracy requirements. The meter was placed in an open area within 20 m of Xueyan as described in Fig. 2.

Photograph of the rain gauge
AnnAGNPS modeling and analysis
The simulation model AnnAGNPS was developed by the USDA-ARS and Natural Resource Conservation Services (NRCS) to help evaluate watershed responses to agricultural management practices (Chahor et al. 2014). It is a continuous simulation, daily time step, pollutant-loading model designed to simulate water, sediment, and chemical movement from agricultural watersheds (Wang et al. 2004). The AnnAGNPS model was developed based on the original single-event AGNPS model (Chahor et al. 2014) but includes significantly more advanced features than the latter. Spatial variability in soils, land use types, and topography within a watershed can be determined by dividing the watershed into many user-specified, homogeneous, drainage-area-determined cells.
The hydrology components considered within AnnAGNPS include rainfall, interception, runoff, evapotranspiration (ET), infiltration/percolation, subsurface lateral flow, and drainage. The AnnAGNPS model calculates a daily mass balance within each cell for soil moisture, N, P, organic carbon (OC), and pesticides. Plant uptake of nutrients, fertilization, residue decomposition, mineralization, and transport are major factors that are considered to determine the fate of nutrients in the watershed. Both soluble and sediment-adsorbed nutrients are considered by the model.
Input data used in the AnnAGNPS model are presented in Table 1. The required input parameters include climate data, watershed physical parameters, and land management operations such as planting, fertilizer and pesticide applications, cultivation events, and harvesting. Daily climate information is required to account for temporal variation in weather; multiple climate files can be used to describe the spatial variability in weather. Output files can be produced to describe runoff, sediment, and nutrient loadings, on a daily, monthly, or yearly basis. Output information can be specified for any desired watershed source location such as specific cells, reaches, feedlots, or point sources. Additional information on AnnAGNPS was described by Taguas et al. (2012) (Table 2).
Results and discussion
Rainfall characteristics in Xueyan
-
1.
Rainfall
Based on rainfall monitoring, there were 171 rainfall events (considered on a 24-h basis) from April 2009 to March 2010. During this period, the total rainfall was 1400.8 mm; the largest daily rainfall amount was 97 mm (on July 22, 2009), accounting for 6.92 % the total over the year. The smallest recorded rainfall amount was 0.1 mm, observed on seven different occasions.
As described in Fig. 3, rainfall was concentrated in the period June–July; these 2 months accounted for 50.93 % (713.4 mm) of rainfall over the study period. Therefore, the main period during which NPSP occurred as a result of rainfall-induced runoff was during June and July.
Fig. 3 
Rainfall in Xueyan between April 2009 and March 2010
-
2.
Rainfall patterns and frequency
As indicated in Fig. 4, during 2009–2010, there were five rainfall events with amounts exceeding 50 mm; these were classified as rainstorms. Although the frequency of these events was only 2.92 %, they accounted for a total of 25.79 % (361.2 mm) of yearly rainfall. Heavy rainfall events, classified as those with rainfall amounts of 25 to 50 mm, occurred eight times (4.68 %), accounting for 21.17 % (296.6 mm) of total rainfall. The frequency of rainstorms and heavy rainfall events together was only 7.60 %, but this accounted for 46.6 % of total rainfall.
Fig. 4 
Distribution of rainfall and runoff from April 2009 to March 2010 in Xueyan
Intermediate rainfall events, with amounts of 10–25 mm, were recorded 25 times (14.62 %) and accounted for a total of 393 mm, with a frequency of 14.62 %. Finally, small rainfall events (0.1–10 mm) were observed 133 times (77.78 %) and accounted for a total of 350 mm of rainfall. Therefore, rainfall events with daily amounts exceeding 25 mm were the key cause for agricultural NPSP in the small watershed studied.
Comparing our results with previous studies on this issue, it can be postulated that daily rainfall events below 20 mm in spring or winter, or below 15 mm in the early summer rainy season, generally do not contribute significantly to surface runoff. Based on this, the average annual number of days witnessing significant runoff was calculated to be around 40 days in Xueyan (several consecutive days of light rain were calculated as 1 day of rainfall).


Variation in NPSP characteristics during a rainfall event
-
1.
Trends in nitrogen/phosphorus/COD during a rainfall event
The concentrations of TN and soluble N in river water were relatively stable over time but increased with increasing rainfall intensity. Furthermore, since TN primarily comprised dissolved N, the trends in TN and soluble N were virtually identical. Total soluble nitrogen mostly comprised nitrate nitrogen and a small amount of ammonia nitrogen. The lower the variation in TN concentration, the lower the concentration of soluble N, which presented a sawtooth wave curve. This suggests that N concentrations did not increase beyond a certain limit and that runoff was not the decisive factor influencing changes in soluble N. In addition, the natural characteristics of the river basin would also affect such variation. The greater the basin’s area, the more resistant it is to externally induced changes. However, in general, the high concentrations of TN in runoff suggest that nitrogen pollution from the town of Xueyan is an extremely pressing issue. According to the environmental quality standards for surface water (GB3838-2002), the water quality in this area, with respect to N, can be classified as class V (highly inferior).
Trends in the loss of P in runoff during the rainfall event of 29–30 July 2009 are described in Fig. 5. The concentration of TP in runoff was far greater than that of soluble P, which indicates that particulate P was the dominant form in runoff water. When soluble P concentrations were high in runoff, TN and soluble phosphorus concentrations tended to be high as well. Generally, soluble P levels tended to be stable during the entirety of each rainfall event. When rainfall intensity was low, the concentration of TP in runoff was stable, but with higher rainfall intensities (which led to erosion), TP levels in runoff were correspondingly higher.
Fig. 5 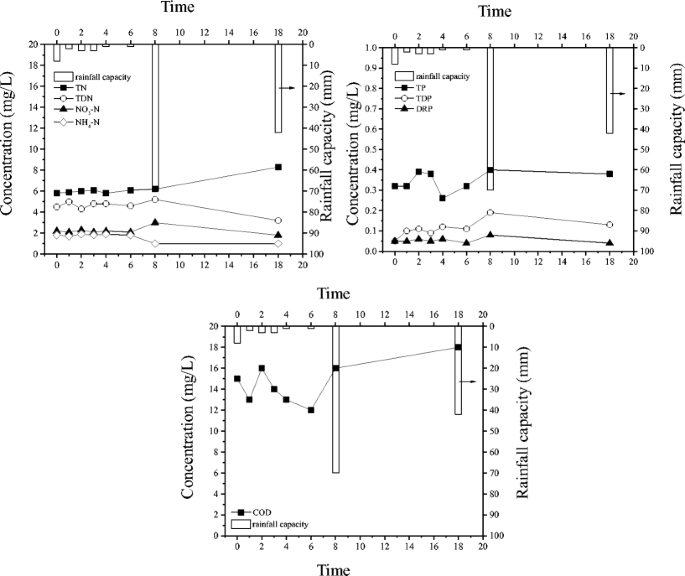
Non-point source pollution characteristics during a rainfall event
Altogether, the pollution caused by P-rich runoff from Xueyan was deemed to be significant. Therefore, the water quality was classified as class IV. Finally, COD in runoff was measured during the rainfall event on 29–30 July 2009 (Fig. 5). Similar to the trend in N, a sawtooth wave curve was observed. The COD in runoff was generally low; we concluded that it had no appreciable effect on the pollution of local water bodies.

Characteristics of NPSP arising from runoff with respect to different soil types
The land use types in and around Xueyan predominantly comprise urban residential areas, farmland, market areas, and industrial (printing factories) areas. To illustrate the loss of N, P, and COD across these different land use types, we analyzed the concentrations of N, P, and COD in effluent in each of these land use types during the rainfall event on 29–30 July 2009 as described in Fig. 6.

Variation in NPSP across different land use types in Xueyan
As indicated in Fig. 6, land use types had significant effects on the losses of N and P. The highest values in effluent were observed with respect to TN and TDN (total dissolved nitrogen in industrial zones (printing factories)), while the lowest values were with respect to NH4-N in residential areas.
Overall, effluent concentrations of total nitrogen (TN) decreased in the order industrial areas > markets > hotels > farmland > residential areas. Most of the soluble nitrogen comprised NO3-N. Thus, the trend in the latter paralleled that of the former, which in turn paralleled the trend in TN. Meanwhile, concentrations of NH4-N in runoff were generally comparable across all land use types (less than 1 mg/L); the exception was around hotels, because of the large amounts of waste generated by the latter. Effluent concentrations of TP decreased in the order markets > printing factory areas > hotels > farmland > residential areas. Total dissolved phosphorus (TDP) and dissolved reactive phosphorus (DRP) were both below 0.1 mg/L in all areas. In contrast to N and P, effluent concentrations of COD varied from 13 to 23 mg/L across all land use types, suggesting that there were no appreciable effects of the latter on COD.
Additionally, our study area includes industrial, urban, and rural sectors, which can represent a useful case study model with respect to runoff. We observed that 30 % or less of the pollutants (on average) was discharged during the early stages of a rainstorm. In other words, most of the pollutants were released later in the event. Runoff characteristics of NPSP were different among industrial, urban, and rural areas and were site specific. This is in agreement with the results of Xu et al. (2013). Therefore, unique management plans should be prepared for each watershed.
AnnAGNPS simulation
The main input and output parameters of the AnnAGNPS model
-
1.
Input parameters for the model
Two input files are necessary for operating the AnnAGNPS model, namely, the AnnAGNPS input file and climate input file. The former contains eight categories and 31 subclasses, with more than 500 parameters (of which 33 parameters are currently unused) (Zhang et al. 2010). The climate input file contains six parameters, namely, daily maximum air temperature, minimum air temperature, dew point temperature, precipitation, wind speed, and cloud cover.
Among the input data, the following are known to be closely linked to soil erosion and nutrient loss: simulative period data, location data, land parcel data, crop data, water flow data, soil data, and fertilization data (Shen et al. 2014).
-
2.
The output parameters of the model
When the input parameters of a basin are determined, this model can supply the output of runoff, sediment, and nutrients on the outlet’s cross section or any unit.
In this study, we used the rainfall events, daily monitoring runoff, and water quality data within April 2009 to March 2010 in Xueyan to calibrate and validate AnnAGNPS. In view of the monitoring data of runoff was less, we only calibrate and validate TN and TP (Table 2). Based on the model output and the measured data, within a certain and reasonable range, we continuously adjusted the input parameters to make the gaps between the simulation and the measured results in an acceptable range. Finally, we used the water quality data on June 30 and July 28, 2009 in Shangjian village and Longquan river watershed to verify the model adaptability. The main results of this study are as follows: The model was relatively inaccurate at modeling total P because there were too many parameters influencing soil erosion and sediment transport (P is transported with sediment during heavy rainfall, which makes it easy to be adsorbed, degraded, or transported elsewhere). Meanwhile, the main parameters were quantified with field surveys and extrapolations; the inclusion of additional parameters could have improved accuracy. With respect to those parameters that were difficult to quantify experimentally, the model was calibrated based on past research. This limitation was one of the main reasons for the relatively poor modeling accuracy with respect to P. Previous studies have reported deviations ranging from 6.2 % to as high as 44.3 %. The results of our modeling are within this range.
Conclusions
A case study of the Xueyan watershed was presented based on recorded data and simulations using an AnnAGNPS pollution model. Runoff production and nutrient losses increased with increasing rainfall intensity. Losses of N and P were more sensitive to runoff caused by high rainfall intensity than that caused by intermediate intensity. As expected, runoff was high in TN and NO3-N but low in TP, NH4-N, and TP. Therefore, pollutant reduction plans for this rural area should be based on data sets obtained during the initial stages of a storm.
Land use changes from industrial and urban to rural had the greatest effects on the losses of N and P through runoff, with smaller effects on COD. Losses of TP and TN were greatest near printing factories, followed by around markets and farmland.
Furthermore, simulations were conducted on two differently sized study sites (Shangjian village and Longquan River), with respect to pollutant levels during two rainfall events. The simulated results matched closely with the observed data. This confirms that AnnAGNPS can be used effectively to model runoff and nutrient loads, particularly in the complex TLB region.
References
Bian B, Hua GF, Li L, Wu HS (2014) Elimination of agricultural nonpoint source pollution using a pre-dam in the Taihu Lake basin: perspective from a laboratory study. Desalin Water Treat 52(40–42):7450–7459
Chahor Y, Casalí J, Giménez R, Bingner RL, Campo MA, Goñi M (2014) Evaluation of the AnnAGNPS model for predicting runoff and sediment yield in a small Mediterranean agricultural watershed in Navarre (Spain). Agr Water Manage 134:24–37
Fouz PS, Avalos JMM, Vázqueza EV, Gonzáleza AP (2009) Phosphorus Contents and Loads at the Outlet of an Agroforestry Catchment in Northwestern Spain. Commun Soil Sci Plan. 40(1):660–671
Guo HY, Wang XR, Zhu JG (2004) Quantification and index of non-point source pollution in Taihu Lake region with GIS. Environ Geochem Health 26(2–3):147–156
Haregeweyn N, Yohannes F (2003) Testing and evaluation of the agricultural non-point source pollution model (AGNPS) on Augucho catchment, western Hararghe, Ethiopia. Agric Ecosyst Environ 99:201–212
Hatfield JL, McMullen LD, Jone CS (2009) Nitrate-nitrogen patterns in the Raccoon River Basin related to agricultural practices. J Soil Water Conserv 64(3):190–199
Kim SW, Park JS, Kim D, Oh JM (2014) Runoff characteristics of non-point pollutants caused by different land uses and a spatial overlay analysis with spatial distribution of industrial cluster: a case study of the Lake Sihwa watershed. Environ Earth Sci 71(1):483–496
Liu RM, Wang JW, Shi JH, Chen YX, Sun CC, Zhang PP, Shen ZY (2014) Runoff characteristics and nutrient loss mechanism from plain farmland under simulated rainfall conditions. Sci Total Environ 468–469:1069–1077
McKee L, Eyre B, Hossain S (2000) Intra- and inter annual export of nitrogen and phosphorus in the subtropical Richmond River catchment, Australia. Hydrol Proc 14(10):1787–1809
National Environmental Bureau (1991) Water and wastewater monitoring and analysis methods (4th Edition)
Ouyang W, Song K, Wang X, Hao F (2014) Non-point source pollution dynamics under long-term agricultural development and relationship with landscape dynamics. Ecol Indic 45:579–589
Owens LB, Shipitalo MJ, Bonta JV (2008) Water quality response time to pasture management changes in small and large watersheds. J Soil Water Conserv 63:292–299
Qiao J, Yang LZ, Yan TM, Xue F, Zhao D (2012) Nitrogen fertilizer reduction in rice production for two consecutive years in the Taihu Lake area. Agr Ecosyst Environ 146(1):103–112
Sharpley AN, Kleinman PJA, Heathwaite AL (2008) Phosphorus loss from an agricultural watershed as a function of storm size. J Environ Qual 37(2):362–368
Shen Z, Qiu J, Hong Q, Chen L (2014) Simulation of spatial and temporal distributions of non-point source pollution load in the three gorges reservoir region. Sci Total Environ 493:138–146
Shen ZY, Zhong Y, Huang Q, Chen L (2015) Identifying non-point source priority management areas in watersheds with multiple functional zones. Water Res 68:563–671
Taguas EV, Yuan Y, Bingner RL, Gómez JA (2012) Modeling the contribution of ephemeral gully erosion under different soil managements: a case study in an olive orchard microcatchment using the AnnAGNPS model. Catena 98:1–16
Wang X, Zhang W, Huang Y, Li S (2004) Modeling and simulation of point-non-point source effluent trading in Taihu Lake area: perspective of non-point sources control in China. Sci Total Environ 325(1–3):39–50
Xu K, Wang YP, Su H, Yang JX, Li LL, Liu C (2013) Effect of land-use changes on nonpoint source pollution in the Xizhi River watershed, Guangdong, China. Hydrol Process 27(18):2557–2566
Zhang QL, Chen YX, Jilani G, Shamsi IH, Yu QG (2010) Model AVSWAT apropos of simulating non-point source pollution in Taihu lake basin. J Hazard Mater 174(1–3):824–830
Acknowledgments
The authors acknowledge financial support for this work from the Natural Science Fund Project in Jiangsu Province (BK20130834) and the National Higher Education Institution for General Research and Development Funding (2012B00714).
Author information
Authors and Affiliations
Corresponding author
Additional information
Responsible editor: Philippe Garrigues
Highlights
• Runoff production and nutrient losses increased with increasing rainfall intensity.
• Land use changes from industrial and urban to rural had the greatest effects on nutrient loss but smaller on COD.
• AnnAGNPS can be used effectively to model runoff and nutrient loads in the complex TLB region.
Rights and permissions
About this article

Cite this article
Zhu, Q.D., Sun, J.H., Hua, G.F. et al. Runoff characteristics and non-point source pollution analysis in the Taihu Lake Basin: a case study of the town of Xueyan, China. Environ Sci Pollut Res 22, 15029–15036 (2015). https://doi.org/10.1007/s11356-015-4709-y
Received:
Accepted:
Published:
Issue Date:
DOI: https://doi.org/10.1007/s11356-015-4709-y