
Abstract
The Matthew effect describes a model according to which, over time, inequalities fuel ever-widening gaps among individuals and social groups on the basis of the wellknown adage: “the rich get richer and the poor get poorer”. In this paper, we analyse the results of the Matthew effect in Italy in relation to first and second level digital divide, in order to determine the trajectories of closure, persistence or reinforcement of inequalities within the population. The central research question of the work aims to understand whether, when compared with a higher level of dissemination of technology over time, the adoption curves trace a model of progressive inclusion for the “poor” which approach the “richest”, or whether progressive increases are recorded in gaps. Considering a time span of more than a decade, microdata from the Istat multipurpose “Aspects of daily life” survey were used to find an empirically grounded answer to this research question. In terms of methodology, indices of absolute and relative digital exclusion and marginalisation which are necessary to take into account the changing nature of the phenomenon were proposed and used. Techniques of multivariate analysis (cluster analysis and multiple factor analysis) were also applied to detect any changes in the structure of variables and trajectories of the socio-demographic characteristics in question. The main results show the existence of a relative Matthew effect in Italy: despite the general increase in the spread of technologies, we are witnessing a progressive impoverishment of the weakest sectors of the population.
1 The Matthew Effect in the Digital Scenario
The Matthew effect takes its name from a verse in the Gospel of Matthew, which reads: “For whoever has, to him more shall be given, and he will have an abundance; but whoever does not have, even what he has shall be taken away from him” (13:12). Used at first to explain the widespread mechanisms of celebrity within the scientific community (Merton 1968, 1973), the Matthew effectFootnote 1 has subsequently been used in many areas to explain the mechanisms of reproduction or widening of inequalities over time (DiPrete and Eirich 2006; Rigney 2010).
Many scholars have also highlighted the existence of the Matthew effect in the field of Information and Communication Technologies (ICTs), with reference to both the gaps in Internet access (digital divide) and to inequalities in the frequency and autonomy of access, digital skills possessed and the ways in which Internet users engage (digital inequalities) (e.g. Bentivegna 2009; Bracciale 2010; De Haan 2004; Harambam et al. 2012; Hargittai 2003; Hargittai and Hsieh 2013; Hunsinger et al. 2010; van Dijk 2009; Zillien and Hargittai 2009). Specifically, the digital divide refers to the binary division between information ‘haves’ and information ‘have-nots’—those who have and those who do not have Internet access—whether they are individuals, social groups or countries and geographical areas (Norris 2001; NTIA 1999). This is the first-level digital divide, which is based on the single dimension of Internet access. In this case, the Matthew effect predicts that the persons who already possess more personal resources will be included in the network society and that the information haves are able to empower themselves through Internet usage and vice versa.
It is evident that Internet access depends on many factors, such as the subjective attitude and reasons, the availability of personal devices and a connection with good quality broadband navigation. However the essentiality of these elements, they do not constitute a sufficient prerequisite for becoming an information haves (Chen and Wellman 2004; DiMaggio et al. 2004; Katz and Rice 2002; Ono and Zavodny 2007; Selwyn 2004; van Deursen and van Dijk 2014; van Dijk 2005).
On the other hand, the second-level digital divide deals with the concept of digital inequalities and it is focused solely on the differences among information haves: those who have Internet access (DiMaggio and Hargittai 2001; DiMaggio et al. 2004). According to the literature (e.g. Bentivegna 2009; Bracciale and Mingo 2009; Bracciale 2010; DiMaggio and Hargittai 2001; Hargittai and Hsieh 2013; Hargittai 2002; Helsper 2012; Mossberger et al. 2003; van Deursen et al. 2011; van Dijk 2005; Warschauer 2003), the multidimensional concept of digital divide can be operationalised by taking into account three different aspects of digital inequalities related to Internet users: frequency of Internet use (access), digital skills (e-skills) and activities (use) carried out on the network. The main difficulties related to the analysis of digital inequalities from a diachronic perspective depend on the operationalisation of a “mobile” concept, for which the indicators change over time, due to the spread of Internet access, the rise of new digital expertise and the resulting increase in new services and platforms that transform the digital environment.
For the dimension of access, these dynamics of transformation are quite obvious. As connections become part of everyday life (Bakardjieva 2005; Haddon 2004; Selwyn 2003; Wellman and Haythornthwaite 2002), people connect more frequently and the parameters by which users are classified change. Until just a few years ago, it might have made sense to consider someone who connected at least once a week as a “regular”Footnote 2 user, but now it is more appropriate to use the same label to classify daily users, i.e. those who include the Internet among the media of habitual use.
For the dimension of digital skills it is not possible to identify a shared definition, or a single operational role to the concept, thus numerous labels are used to define the relation between digital technologies and “literacy” (Bawden 2008). Changes in the classifications of digital skills also reflect the evolution of the technology within a digital milieu in continuous change (Ala-Mutka 2011; Ferrari 2012). Since it is not possible to account for the complexities and nuances of definitions suggested by different scholars (e.g. Donat et al. 2009; Gui and Argentin 2011; Helsper and Eynon 2013; Hargittai 2005; Helsper and Eynon 2013; van Deursen and van Dijk 2010; van Deursen et al. 2012, 2014), in line with van Dijk we use the label “digital skills” to identify “the collection of skills needed to operate computers and their networks, to search and select information in them, and to use them for one’s own purpose” (van Dijk 2005, p. 73). Furthermore, since the use of nationally representative surveys (e.g. Eurostat harmonised surveys in Europe; ISTAT in Italy) is the only approach that enables the use of extensive surveys and comparable diachronic studies on these issues, we are bound to the operationalisation of the dimension decided by the European Union.Footnote 3
Digital skills are detected in Eurostat’s harmonised surveys by asking respondents if they are able to perform some activities related to the use of computers and the Internet which have changed over time. This approach presents various problems: self-reported measurements are context dependent and positively biased (Helsper et al. 2015; van Deursen et al. 2014; van Dijk and van Deursen 2014; van Dijk 2006); self-perception of skill is gender dependent (Bunz et al. 2007; Hargittai and Shafer 2006; Liff and Shepherd 2004; Sieverding and Koch 2009); and there is overlap between the domain of e-skills and the domain of Internet use (van Deursen and van Dijk 2010), although correlations between these indicators are often high (Helsper and Eynon 2013).
Nevertheless, it is the most diffuse and appropriate way of collecting data and testing generalizable models of digital divide in extensive, comparable and diachronic studies.
The dimension of the activities performed on the network by Internet users has been subject to numerous attempts at classification to build shared and comparable typologies of uses of the network (e.g. Blank and Groselj 2014; Kalmus et al. 2011; Papacharissi and Rubin 2000; van Deursen and van Dijk 2014). Undoubtedly, one of the main problems is that the motivations behind performing a specific activity on the network cannot be associated with a single objective, so the classification of activities cannot be organised on the basis of mutual exclusivity. For example, the same activity—such as “using the Internet to make phone calls”—can be useful for both work conference calls and for a family meeting.
Internet activities are detected in Eurostat’s harmonised surveys through a list of questions asking respondents whether they perform certain network activities. The items used to detect such activities have increased and partially changed over time, in particular to take into account the emergence of new social uses of the Internet.
Specifically, we can distinguish between “instrumental use” (activities performed on the network to achieve a specific objective) and “relational use” (activities aimed at interaction with other subjects and online participation). This is a fairly broad distinction used by many authors, albeit with different labels, to account in general terms for the different motivations that guide the activities performed on the network. For example, Kalmus et al. (2011) identify two main reasons that guide use of the Internet—social media and entertainment (SME) and work and information (WI); Papacharissi and Rubin (2000) distinguish between ritualised and instrumental use; and using the ISTAT and Eurostat datasets, Bentivegna (2009) and Bracciale (2010) speak of an instrumental axis and a relational axis along which activities are performed on the network.
The gaps in access, digital skill and Internet use trigger a process of enrichment or impoverishment among Internet users, attributed to the “capital” which is available to them (Bourdieu 2001; Hargittai 2008; van Deursen and Helsper 2015). In fact, especially “when the Internet matures, it will increasingly reflect known social, economic and cultural relationships of the offline world, including inequalities” (van Deursen and van Dijk 2014, p. 1). This differentiation among users could intensify a progressive impoverishment of the already most marginalised segments of the population. Some segments will use the Internet systematically, benefiting in terms of personal empowerment with respect to the spheres of education, employment and information, while others will limit themselves exclusively to activities related to entertainment and shopping (van Dijk 2005; Wasserman and Richmond-Abbott 2005; Zillien and Hargittai 2009).
These opportunities of empowerment are often closely connected with higher levels of education and an upper socioeconomic status (Bonfadelli 2002; Hargittai and Hinnant 2008; van Dijk 2005) because the position on the social ladder has a decisive role in the uses that are made of the network, even when technological equipment, use experience and interests are equal (Zillien and Hargittai 2009). Thus there is a further underpinning of inequalities and the formation of new disparities so that “the influence of access to IT must be in addition to existing sources of inequality, such as inherited wealth, social networks and educational and occupational success” (De Haan 2004, p. 80).
The gaps that arise as a result of these inequalities can produce different kinds of absolute and relative effectsFootnote 4 (Rigney 2010). Specifically, the absolute Matthew effect refers to when there is a dynamic in which the “rich” become increasingly richer and the “poor” become increasingly poorer,Footnote 5 so that over time the poor are doomed to failure or social exclusion. The relative Matthew effect exists when both the rich and the poor become richer, but the rich become so at a rate which is so much higher that the differences with the poor persist or increase. If one considers the combinations between the two types of Matthew effect and the two levels of digital divide described, four scenarios could occur (Table 1). Depending on social context, historical period and geographical area, one of the possible combinations might prevail.
What is the situation in Italy in comparison with other European countries?
The Italian digital context is an anomaly in Europe because of the country’s strong lack of digital development. Indeed, many scholars have pointed out that Italy is among the countries so “lagging behind” in Europe among the countries with a majority of Internet non-users (Brandtzæg et al. 2011) that it is unable to access the economic benefits of digitisation (Guerrieri and Bentivegna 2011). The rankings of European countries based on a set of ICT indices disclose poor Italian performance (Vicente and López 2011), with an unbalanced digital development connected with a low level of ICTs infrastructure and adoption by the population associated with high costs of Internet access (Cruz-Jesus et al. 2012). Along with other Southern and Eastern European countries (e.g. Greece, Cyprus, Romania and Bulgaria), Italy is included in a cluster of increasingly digitally excluded countries characterised by high levels of social marginality and more evident signs of the economic crisis (Bracciale and Mingo 2015).
The most recent data show a digital landscape in which, starting from the technological equipment available to families in their homes, Italy lags behind at the international level: the broadband penetration rate of 51.1% places Italy as last in European rankings, with an 18.8 percentage point difference from the European average. The causes for the delay are numerous and involve infrastructural aspects, quality of connection and accessibility of online services (ISTAT-FUB 2015), and they are reflected in the digital engagement of the population.
By contrast, new aspects are transforming the Italian digital environment and are changing the approach to Internet use. A significant increase in mobile broadband services has been recorded since 2010, along with a decrease in fixed broadband services in Italy during the same period; therefore “it could be argued that there is strong evidence that in Italy mobile broadband services are considered as a substitute for fixed broadband services” (Prezerakos and Polykalas 2014, p. 327). In 2014, the mobile broadband penetration rate in Italy (32%) was slightly higher than the European average (31%) (ISTAT-FUB 2015). The increased availability in Internet access, even if through a smartphone or tablet, is registering substantial recovery in terms of the first-level digital divide. Considering that this is very recent, it is too early to fully understand what opportunities may be offered for closing the second-level digital divide. Moreover, we do not yet know the possibilities of empowerment offered by mobile devices for improving ICT skills and uses.
Given these scenarios and taking into account the increasing diffusion of ICTs among the population, the reflection proposed in this work is structured around the following research questions:
-
1.
Which easily replicable measurement strategy can be adopted to take into account the variability of the phenomena of digital divide and digital inequalities over time?
-
2.
Which kinds of different scenario described in Table 1 can be recorded in Italy?
The hypothesis guiding this work is that the general increase in the spread of technologies avoids the absolute Matthew effect, but does not avert a strong relative Matthew effect. This means a widening of existing gaps and a progressive “digital impoverishment” of the weakest sectors compared with the average condition of the population.
This paper, focused on the Italian case, is structured as follows: Sect. 2 presents the data on which subsequent analyses are based; Sect. 3 focuses on the first-level digital divide that produces digital exclusion; and Sect. 4 focuses on digital inequalities—the second-level digital divide—that produce digital marginalisation. An account is given respectively of the indicators and indices proposed, as well as the analytical strategies and results obtained. Section 5 presents the conclusions.
2 Data
The empirical data used here are taken from microdata collected by the Italian National Statistics Institute (ISTAT) in a national representative survey entitled “Aspects of Daily Life” (ADL), which was carried out from 2000 to 2013. Since 2005, the survey has included the harmonised Eurostat (European Statistical Office) form on citizens’ use of ICTs. The annual sample survey of approximately 20,000 households and 50,000 individuals covered the structural and contextual characteristics of the respondents; their digital skills; frequency of use of new technologies; and how and why the Internet was used (communication, work, training, transport, health, e-government, etc.). Our analysis focuses on the 14–74 age segment for analysing the trend in digital disparities from 2001 to 2013.
Although annual, this survey does not have a longitudinal design, given that its annual samples are not panels. For this reason, the structure of the data does not permit the tracking of the performance of each individual over time, but allows us to analyse the trend of categories of persons defined according to sociodemographic characteristics. Thus, in this paper, the microdata are aggregated so that the unit of analysis is not the individual but the sociodemographic category to which he/she belongs. This stratagem allows, through a diachronic study of repeated cross-sectional surveys, to analyse changes over time.
Over this period, analysis of the digital divide has been concerned with monitoring a phenomenon that is becoming increasingly relevant for individual daily life and for society as a whole. At the operational level, the increased number of questions used in the annual ADL survey is symptomatic of the growing complexity of the concept of the digital divide, and the shifting to a paradigm of second-level digital divide. For example, there were only two questions in the 2001 survey form specifically related to the Internet, and they were focused only on access (individual use and family access). In 2013, the Internet section of the form included about 20 complex questions for which each respondent could choose to give more than one answer about network use, e-skills and Internet activities, adopting a theoretical framework based on digital inequalities.
In this paper, taking into account this complexity and relativity, the digital divide is analysed in terms of both exclusion (first level) and marginalisation (second level or digital inequalities). For this purpose, relative indices of digital exclusion and marginalisation are proposed, and multivariate analysis (Cluster Analysis and Multiple Factor Analysis) are applied, in line with the literature which claims that testing the accumulation of advantage hypotheses requires multivariate analysis to understand the phenomenon (De Haan 2004).
3 First-Level Digital Divide: Indicators and Index of Digital Exclusion
Digital exclusion (first-level digital divide) was analysed with reference to the dichotomous distinction between Internet users and non-users.
The first-level digital divide was operationalised using the “frequency of Internet use in the last 12 months” variable, whereby two different types of person were identified:
-
Internet Users: individuals who use the Internet every day (strong users) or at least once a week (weak users);
-
Internet Non-users: individuals who use the Internet less than once a week or who have never used it.
With regard to the last type, individuals who use the Internet less than once a week were included in the group of non-users because their Internet use (less than four times a month) cannot be considered a habit. Furthermore, the percentage of occasional users is quite small and varies from 4.2% in 2001 to 2.4% in 2013.
For the first type, despite the growth of daily users, Eurostat continues to use the parameter of weekly connection to identify “regular” users, in view of the specificity of different sociocultural and territorial contexts which must be taken into account in the comparative analysis. Therefore, it was decided to use this binary classification to measure Digital Exclusion, distinguishing the two levels (strong and weak) in the analysis of second-level digital divide (see Fig. 1).

Source: Based on the ISTAT “Aspects of daily life” database, 2001–2013
Internet users and non-users in Italy (% of persons aged 14–74; 2001–2013).
The trend of these aggregate variables over time describes the diffusion of technologies: Internet users have been increasing by 34%, while non-users have been decreasing.
This first figure might suggest a closing of the digital gap over time, but in reality, these encouraging results do not capture the digital disparities among various categories of persons, depending on their sociodemographic features. For this purpose, it is necessary to break down the variable and to calculate the measurement of digital divide by categories of persons.
3.1 Digital Exclusion: Indices by Categories of Persons
For this purpose, two Digital Exclusion Indices, respectively absolute (DEAI) and relative (DERI), are proposed: they are calculated for each year (2001, 2005, 2009, 2013) and for each category of persons. During the “ICT for an Inclusive Society” Ministerial Conference in Riga (11 June 2006), the European Commission identified the weakest groups in the following segments of the population: older people, people with disabilities, women, lower education groups, unemployed and “less-developed” regions. These are already subject to risk of social relegation, for which ICTs would be able to determine an increase in these gaps (Sassi 2005).
According to the European Commission and on the basis of the variables available, in this study we defined these categories on the basis of gender (male/female), age class (14–19, 20–34, 35–44, 45–54, 55–64, over 64), education (no elementary qualification; low-middle level, upper-middle level; tertiary); professional status (employed, unemployed, student, housewife, retired) and geographical area (Northern, Central, Southern).
DEAI and DERI can be described as follows:
where Eit is the number of non-users of the ith category of persons in year t; nit is the sub-sample size for the ith category of persons in year t; Et is the number of non-users in year t; and nt is the sample size in year t. DEAI varies from 0 to 1 and allows us to quantify the exclusion of each of the categories of persons over time by comparing the proportion of regular users in each of the sociodemographic categories with the others: exclusion is maximum when DEAI equals 1.
On the other hand, DERI varies from 0 to ∞ and permits the measurement of digital exclusion in relative terms, compared with the average level of all categories of persons. When it is equal to 1, it indicates a situation of exclusion of the category quite similar to that of the whole sample; when its value is greater than 1, it indicates that exclusion is more widespread in that category rather than in the overall sample. Conversely, the lower the value (less than 1 and close to 0), the more that category of persons is included.
3.2 Digital Exclusion: Method and Results
The Digital Exclusion Absolute Index (DEAI) for each of the categories of persons over the span of the 13 years in question shows that the trend of exclusion for all categories of subjects has been declining, although with very different rates, as shown in Fig. 2.

Source: Based on the ISTAT “Aspects of daily life” database, 2001–2013
Digital Exclusion Absolute Index by monovariate categories of persons (2001–2013).
This result seems to exclude the existence of the “absolute” Matthew effect in the Italian digital context, because all categories show more extensive digital inclusion, and there is no dynamic by which the rich become increasingly richer and the poor become increasingly poorer.
Figure 2 shows the status quo model of digital inequalities: most of the lines are relatively parallel since the digital gap between many categories of persons remains the same over the time of this study.
As shown in Table 2, average DEAI decreased from 0.77 in 2001 to 0.44 in 2013, and the median fell from 0.78 to 0.41. At the same time, however, the data in Fig. 2 shows that the gaps between the most excluded categories (those with a low level of education and those over the age of 64) and the most included categories (students, graduates and Ph.Ds) persist and appear to have increased over the time period in question. In Table 2, DEAI range, standard deviation and coefficient of variation (CV) increased: in particular, the latter rose from 20.74 in 2001 to 54.00 in 2013. This is a preliminary clue of the existence of the “relative” Matthew effect.
This dynamic is made more evident by Fig. 3, which shows the trend of the Digital Exclusion Relative Index (DERI) for each of the categories of persons over the age of 13 in question. The graph shows that from 2001 to 2013 the distances between the most excluded and the most included continued to increase, as revealed by the coefficients of variation (CV) of the distributions per year, which increased from 20.22 in 2001 to 52.63 in 2013 (Table 3).

Source: Based on the ISTAT “Aspects of daily life” database, 2001–2013
Digital Exclusion Relative Index by monovariate categories of persons (2001–2013).
Furthermore, despite average DERI remaining almost unchanged over time (from 0.99 in 2001 to 1.02 in 2013, as shown in Table 3), Fig. 3 shows that the values of the indices of the “poorest” categories are always greater than 1 (the watershed that identifies the sample mean in that year); while those in the “richest” categories (with values <1) increasingly tend to move away from this threshold value. Thus, in a scenario in which the Internet is spreading among the population in absolute terms, the gaps between rich and poor tend to increase rather than decrease over time.
Thus, while the DEAI trend shown above excluded the existence of the absolute Matthew effect, these results, which were obtained by considering only the base indicator that discriminates between users and non-users, are a clear indication of the existence of relative Matthew effect applied to the digital context on which the subsequent analyses will focus.
If one scrolls through the position of the categories of persons in Fig. 3, from those most excluded to those most included, the usual features that distinguish those at greater risk of social exclusion can be found: for example, the elderly, housewives, the retired/disabled, individuals with a low level of education, residents of Southern Italy and women.
The categories of persons observed take into account only one variable at a time (for example, gender or age or employment status or education), but it is plausible to assume that the cumulative effect of some conditions of disadvantage can accentuate the situations of digital marginalisation of subjects. To that end, 46 more specific sociodemographic categories were studied (see “Appendix”). These were obtained by jointly considering three further explanatory variables of use/non-use of the network—namely age, gender and educational level—and the DERI for the year being analysed was calculated for each of them.
A hierarchical cluster analysis (Centroid method) was applied to the matrix comprising these 46 sociodemographic categories of persons and the DERI indices for 2001, 2005, 2009 and 2013, in order to identify a typology of categories of persons based on levels of digital exclusion/inclusion over time.
Four groups were identified, taking into account the following criteria:
-
the inspection of the dendrogram (Fig. 4), which highlighted different partitions. The partition with three clusters met the criterion of “maximum jump” between the levels of distance for which the aggregation occurred. However, this solution seems insufficient from an informative point of view. On the other hand, the partition with four clusters seemed more appropriate for describing the differences between sociodemographic categories;
Fig. 4 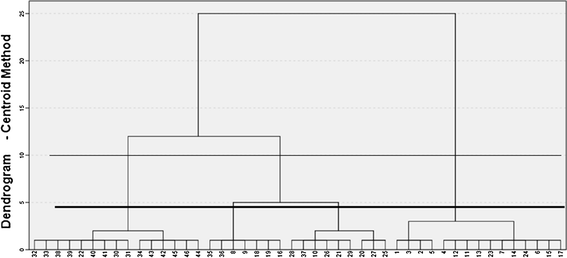
Cluster analysis—Dendrogram. Note: See “Appendix” for the legend
-
the Duda–Hart stopping-rule (Duda et al. 1973) for finding one of the largest Je(2)/Je(1) values that corresponds to a low pseudo-T-squared, which indicates more distinctive clustering.Footnote 6 This condition occurs in relation to four groups (Table 4).
Table 4 Cluster analysis—Duda–Hart stopping rule

The cross-tabulation of the four clusters, obtained with three different algorithms (Centroid, Average Linkage and Ward’s methods), confirms the robustness of the partitioning obtained: the level of overlapping clusters is always 100% (Table 5). Moreover, the values of Eta squared, computed between the DERI indices and the “cluster membership” variable, are always greater than 0.86 (Table 6). This indicates that a considerable proportion of the variance of each relative digital exclusion index is accounted for by the aggregation of the 46 sociodemographic categories in four groups.
The four groups, which were different on the basis of the DERI indices in the years in question (Table 7), can be labelled and described as follows:
-
1.
Increasingly included (15 subject categories): characterised by indices of relative exclusion always less than 1 and decreasing over time (0.65 in 2001 to 0.28 in 2103). These are subjects historically characterised by inclusion: categories with high levels of education, and in working age (20–64 years) or younger (14–19 years), regardless of educational level.
-
2.
Newly included (7 subject categories): characterised by indices of exclusion greater than 1 in 2001 but decreasing over time (1.04 in 2001 to 0.66 in 2013). These categories changed their condition of exclusion in the decade in question compared with the average situation: younger persons with a low level of education, but also adults with a medium–high or high level of education, mainly women.
-
3.
Persistently excluded (9 subject categories of subjects): characterised by indices of exclusion always greater than 1 and a slight increase over time (from 1.16 in 2001 to 1.18 in 2013). These categories maintain a level of exclusion just above the average: young adults with a low level of education and the elderly with medium–high educational qualifications.
-
4.
Increasingly excluded (15 subject categories): characterised by indices of exclusion always greater than 1 and consistently increasing over time (from 1.25 in 2001 to 1.93 in 2013). The prevalent characteristic of these categories is the low level of education, but also a medium–low level if accompanied by an age over 46, or a high level of education if associated with an age over 64.
Figure 5, which represents DERI indices by different types of categories of persons, shows that the gap between those who have an accumulation of conditions at risk of exclusion (low level of education and older age) and conversely those that are in privileged conditions (high level of education and younger age) tends to increase over time. The results show the existence of two opposing groups—increasingly included and increasingly excluded—which move apart rather than come closer. The model of accumulation of advantages and disadvantages typical of the Matthew effect seems to have occurred in its relative version: i.e. a generalised growth of Internet access in which the gaps between rich and poor are widening consistently over time.

Source: Based on the ISTAT “Aspects of daily life” database, 2001–2013
Digital Exclusion Relative Index by typology of subjects (2001–2013).
4 Second-Level Digital Divide: Indicators and Index of Digital Marginality
Digital inequalities (second-level digital divide) were investigated by focusing only on Internet users (weak and strong, leaving out non-users) and considering three years, 2005, 2009 and 2013, because the indicators relating to the skills and uses of the network have been recorded since 2005. The growing interest of statistical sources about these new aspects of the digital divide confirms the continuous transformation of the concept due to the increasing diffusion of ICTs in the population.
According to Eurostat, ISTAT has changed the variables in different surveys over the years to take into consideration the dynamism and nuances of the concept of digital inequalities. The second-level digital divide was investigated following the dimensions of access, digital skills and activities that users perform on the Internet.
4.1 Internet Access
The first aspect was operationalised using the “frequency of Internet use in the last 12 months” variable. Given that we consider Internet users only, this dichotomous variable distinguishes between strong and weak users: the former are individuals who use the Internet every day, the latter are those who use the Internet only once a week. Over time, the share of weak users fell by about 23%, indicating a gradual process of presence of the Internet in habitual media: those who use the Internet do so daily (Table 8).
4.2 Digital Skills
According to functional Eurostat rules, the different variables regarding e-skills identified in the three surveys (2005–2009–2013) were considered (Table 9).
They are detected by asking respondents if they are able to perform some activities related to the use of computers and the Internet.Footnote 7 This approach presents various problems, as discussed above (see Sect. 1), but the principal is the overlap between the domain of e-skills and the domain of Internet use (van Deursen and van Dijk 2010).
We choose to analyse a collection of skills without any distinction between them, because we believe that they are the tools needed to operate the internet regardless of the type of purpose that allows each of them to perform.
Considering the three surveys, this permits us to take account of the relativity of the phenomenon and the changes in the indicators used for the detection of e-skills in different years. It concerns dichotomous variables (yes/no) which were summarised by counting the total number of digital skills for each individual with respect to the maximum number of skills detected in that year. It was decided not to adopt allocation of weights to preserve the replicability of the survey over time and due to the possibility of further changes in the indicators used to detect the possession of e-skills in the population. In addition, although the decision to build a synthetic individual index based merely on adding up the number of skills possessed may at first appear simplistic and limited, the cumulative nature of the skills should not be forgotten (Bracciale and Mingo 2009).
The Digital Skills Individual Index, at time t for the individual ith, can be described as follows:
where n is the sample size in year t; p is the number of digital skills detected in year t; and Sjit is the jth digital skill present in the individual i in year t.
The means of this index decreased over the time (Table 10), but the variability increased (CV 0.297 in 2005, 0.417 in 2009, 0.458 in 2013), marking an increase in the period of the heterogeneity of Internet users concerning the digital skills possessed.
For each year, the synthetic index helped to identify the “Users deprived of digital skills”, i.e. those individuals who have an Index Cit lower than or equal to the value of the first quartile of the distribution for each year in question. This made it possible to always relate any value to the distribution of the reference year in order to simultaneously take into account the changed technological context.
4.3 Internet Activities
Based on the indicators available in the ISTAT dataset, this work considered it appropriate to make a distinction between relational and instrumental activities (Table 11) in order to take into account the dynamism and relative nature of the concept on the one hand, and the “general” reasons that guide network use, on the other.
In relation to these two ‘axes’, the dichotomous variables (yes/no) that detect network uses were summarised by counting the total number of instrumental and relational activities performed by each individual on the Internet related to the maximum number of activities detected in that year. For digital skills, it was decided not to resort to allocation of weights to preserve the replicability of the survey over time.
Two different Digital Activity Individual Indices were calculated (Table 12): the Relational Activities index Rit and the Instrumental Activities index Sit. Both activity indices were related to the maximum number of digital activities detected in the sample, in order to take account of the different number of items in the different years of detection:
where n is the sample size in year t; p and v are the number of relational and instrumental activities detected in year t, respectively; rjit and aiyt are the jth relational digital activity and the yth instrumental digital activity performed in the individual i in year t, respectively.
During the period in question, the mean of the two indices increased over time, while the relative dispersion (CV) decreased slightly: on average, therefore, Internet users in Italy increasingly perform network activities and their heterogeneity with regard to these activities is diminishing (Table 12).
For each of the years in question, with regard to relational/instrumental activities performed on the Internet, marginal users are individuals who have, respectively, indices \(R_{it}\) and \(S_{it}\), which are lower than or equal to the value of the first quartile of each distribution in time t.
4.4 Marginal Users in Italy
The different shares of marginal users (i.e. those that rank in the first quartile of the four indices) with respect to the three areas identified (frequency of Internet use, digital skills and types of activities performed on the Internet) (see Sect. 4.1–4.3) enable the identification of changes in the spread of digital marginalisation for the period in question. Except for instrumental activities (for which there were no major changes), in 2013 compared with 2009 and 2005 the situation appears to have improved significantly, in terms of the decrease in weak users and of the shares of marginal users concerning relational network activities (Fig. 6).

Source: Based on the ISTAT “Aspects of daily life” database, 2005, 2009, 2013
Marginal users in Italy by type of digital marginality (% of people aged 14–74; years 2005, 2009, 2013).
Regard the digital skills, there was an improvement from 2005 to 2013; the 2009 figure should be read carefully given that the Internet skills have not been detected in that year. Figure 6 shows an increase in digital inclusion considering the total sample, but it does not give any information on specific sociodemographic categories. In order to capture the differences among categories of persons, it is necessary to break down indices within these categories. The main purpose of this analysis is to detect whether the relative Matthew effect also exists in the second-level digital divide.
4.5 Digital Inequalities: Indices by Categories of Persons
In order to capture digital inequalities over time among various Internet users, depending on their sociodemographic category as above, four Digital Marginality Relative Indices (DMRIj) were calculated for each aspect of marginality for each year and for each category of persons, using the following formula:
where Mijt is the number of the jth type of marginal user of the ith category of persons in year t; Uit is the size of the sub-sample for the ith class of users in year t; “M” t is the number of marginal users in year t; and Ut is the dimension of users in year t. Also in this case, a value lower than 1 and close to 0 indicates a condition of “lower digital marginality” with respect to the overall sample.
4.6 Digital Inequalities: Method and Results
Based on the results obtained in the analysis of the first-level digital divide in its relative form, for the second-level digital divide we also expect to observe a deepening of digital inequalities among sociodemographic categories, according to a cumulative model of advantages and disadvantages; i.e. the Matthew effect.
Considering the descriptive analysis performed in 2009, which has shown the same trend, the multivariate analysis of digital inequalities, focused on Internet users aggregated in sociodemographic categories and DRMIj indices, regards both years 2005 and 2013, in order to better highlight the changes during this period of about ten years and to make more immediate the interpretation of the results.
The sociodemographic categories were defined based on the level of education (four modalities), age group (six modalities) and gender (two modalities) of respondents. Of the 48 theoretical categories obtained, the empty categories were eliminated, while categories with few numbers lower than 25 were merged into broader categories. For example, Internet users with a low level of education who were not very numerous, especially in 2005, were merged into three age groups (14–34; 35–54; 55–75) and were not broken down by gender. Thus, 34 different sociodemographic categories were obtained (see “Appendix”), which formed the units on which the following analysis was based.
The matrix under analysis is of the type:
where i refers to the units under analysis (34 sociodemographic categories), j to the four DRMIj indices, and k to occasions (the survey years in question—2005 and 2013). This concerns a “data volume” to which a multiway-type approach can be applied, making it possible to outline changes in inter-unit variability on the different “occasions” in question, and trace trajectories of statistical units over time: Multiple Factor Analysis (MFA)Footnote 8 (Escofier and Pagès 1988).
Given the presence of quantitative variables, the analysis was based on a weighted PCA of the X ijk matrix, obtained by comparing the two X ij matrices—one for each year of the survey—with the following objectives:
-
1.
Global or average structural analysis; i.e. the identification of relations among all the variables in question. The aim was to identify whether a common structure of the second-level digital divide exists over time. In this case, the main purpose was to evaluate the changes in different sociodemographic categories in the period in question. These changes can be outlined by projecting the homologous points of each Xk into the common factorial space and tracing their trajectories over time. This analysis enables us to answer the following questions: how did the position of sociodemographic categories change with regard to the second-level relative digital divide from 2005 to 2013? Is the hypothesis concerning the growing relative digital marginalisation of the weakest categories empirically founded?
-
2.
Partial structural analysis, according to each occasion, permits detailed analysis of changes in the structure of the X k sub-matrices. The aim was to identify the pattern of second-level digital divide in each “occasion”. Our questions were: did the structure of relative digital marginalisation change over time? If so, how?
Starting with the partial analysis, in which the algorithm calculates a PCA for each “occasion”, the results show that for each of the two years in question the first two factorial axes explain high percentage variance and that these percentages have increased over time (from 89.63% in 2005 to 96.00% in 2013) (Table 13).
This means that for each occasion, all DRMIj indices are correlated and converge into two factors that synthesise the data.
In particular:
-
1.
The first factor is correlated with all variables being analysed for both occasions (its factor loadings range from 0.30 to 0.86 in 2005 and from 0.76 to 0.97 in 2013; see Table 14). This factor can be interpreted as a synthesised dimension of digital marginalisation, based on the frequency of Internet use, the e-skills and the Internet activities. The increasing factor loadings indicate that the relationship between the various aspects of digital marginality, synthesised by the first factor, become stronger over time.
Table 14 Digital marginalisation partial analysis—loadings of active variables -
2.
The second factor is correlated specifically with the variables concerning a low level of Instrumental and Relational Activities (DMRI2 0.92 in 2005, 0.52 in 2013; DMRI3 −0.40 in 2005, −0.63 in 2013). This factor seems to synthesise only some aspects of digital inequalities, namely those concerning the different types of activities carried out on the Internet.
These results indicate that the structure of second-level digital divide expressed by the DMRIj indices has partly changed: in fact, the first factor explains a percentage of variance increasing over time (from 51.89 to 78.78%), while the second factor loses importance (from 37.74 to 17.22%). This means that the differences in digital marginality among sociodemographic categories, synthesised by the first factor, increased in the period analysed: the gap between categories of persons increased over time. On the other hand, the differences synthesised by the second factor concerning the types of Internet activities diminished (Table 14).
Thus, digital inequalities persist and are amplified, confirming the existence of the relative Matthew effect. At the same time, with the differences between types of Internet activities decreasing, probably because of the spread of “apps” and mobile devices with friendly interfaces, the difference between instrumental and relational activities tends to fade.
The global or average analysis was conducted using a PCA of the entire X matrix, in which each jk column was weighted by its weight (\(1/\sqrt {\uplambda_{1k} }\)) where λ1k was the first eigenvalue of the PCA conducted on group k. This produces common factors or general variables Z of the MFA (Table 15).
For the global analysis, the first two factors also explain a significant share of total variance (86.94%) and can be interpreted by analysing the coordinates, contributions and squared cosines of the occasions and variables in question (Table 16).
Table 16 shows that:
-
1.
The first factor is correlated with all DMRIj indices. For this reason, in the global analysis it can also be interpreted as a synthesised dimension of relative digital marginalisation.
-
a.
The variables that have the higher contributions are those concerning digital skills (respectively 23.67 and 15.02; coord. 0.94 and 0.93). Thus, it is e-skills in particular that mark digital inequality among sociodemographic categories over time. Some scholars have pointed to the importance of skills as key to inclusion in the information society (van Dijk and van Deursen 2014) and highlight the existence of a virtuous circle: the more one is skilled, the more varied the online media diet will be; the more one’s skills increase, the more diversified network uses will be, as well as the outcomes achieved in offline status, which then again influences digital inclusion factors (van Deursen and Helsper 2015).
-
b.
In addition, differences between the two years are highlighted: in 2013, the factor is also strongly correlated with weak use (DMR1 coord = 0.93) and with a low level of relational and instrumental activities (DMRI2 coord = 0.78 and DMRI3 coord = 0.78). On the other hand, in 2005, correlations with these variables were weaker (respectively 0.43; 0.56 and 0.67). These results indicate that in 2013, more than in 2005, digital marginalisation is associated with sporadic network use and a limited number of Internet activities. This result is coherent with the black side of the above-mentioned hypothesis of virtuous circle.
-
a.
-
2.
The second factor represents the distinction among different types of Internet activities: the low level of relational activities (0.74 and 0.54) and that of instrumental activities (−0.70 and −0.52). This distinction among types of activities (relational/instrumental) appears to be mainly a feature of 2005, and it has faded over time: the contributions of the variables in 2013 for the factor are lower than those of the variables in 2005. This means that the type of activities (relational/instrumental) in which the users are engaged online become less important to understand the marginalities than the skills. This findings support the work of Helsper et al. (2016), which showed that skills become more important for the translation of activities into tangible outcomes rather than the activities that people undertake online.
Once the common (global) structure has been identified, it is possible to project the points concerning the different sociodemographic categories and the respective partial coordinates for each year in question onto the first factorial plane. Analysis of these coordinates allows us to determine which sociodemographic categories have had the most pronounced transformations with respect to digital inequalities over time, and to verify the presence of the relative Matthew effect.
Table 17 shows the categories which have a higher intra-inertia (Escofier and Pagès 1988) and therefore are characterised by greater dynamism than the othersFootnote 9: among them we find six categories with a low and medium–low level of education and four categories with a high level of education. The trajectory of each of these sociodemographic categories of subjects outlines the increase or decrease in digital marginalisation or in the level of instrumental/relational Internet activities.
Level of education seems to be the key variable: the categories that showed an increase in marginalisation are characterised by low or medium–low levels of education, with the exception of young people aged between 14 and 19 probably because they are still in education (Table 17). For the categories of persons with a high level of education, there is instead an improvement in the condition of digital inclusion. As noted in other contexts, the differences in the level of education make a decisive contribution to digital marginalisation if other factors, such as age, do not intervene to mitigate inequalities (van Deursen and van Dijk 2014). These trajectories verify the dynamics of impoverishment of the “poor” and the existence of the relative Matthew effect.
With reference to Internet activities, the category that has witnessed the most obvious changes, increasing instrumental activities, is that of young people (Table 17). It could be argued that the youth of about 10 years ago performed less instrumental activities than those of today. On the other hand, for some categories of persons with a high level of education, the dynamics appear to show an increase in relational activities: this means that graduates in 2005 were less orientated towards performing relational-type network activity than those of today. Obviously, the changed socio-technological context clearly affects the choices of use. New applications are being produced which are typical of the “participatory web”—just think of social network sites such as Facebook—and new services are being offered by companies and public and private bodies, such as the possibility to send documents to public administrations or expansion of the e-commerce offer.
5 Conclusions
This paper has focused on the distinction between first-level (Norris 2001; NTIA 1999) and second-level (DiMaggio and Hargittai 2001; DiMaggio et al. 2004) digital divides, and on the differentiation between absolute and relative Matthew effect (Rigney 2010). Using extensive data from official statistical sources harmonised at European level, albeit in the absence of longitudinal data, indicators, indices and analyses have been proposed that permit both capturing the mobility of the concept of exclusion and digital marginalisation, and outlining absolute and relative changes over a period of about a decade. The aggregation of microdata, in which the unit of analysis is not the individual but the sociodemographic category to which he/she belongs, has allowed us to make a diachronic research on digital inequalities.
Although applied to the Italian case, the indices proposed by setting shared indicators used in periodical extensive surveys are easily replicable in other contexts and in new, especially European, lines of research, in which harmonised surveys similar to the one used in this paper are conducted. Thus, it is possible to monitor the existence and persistence of first- and second-level digital divide over time and carry out comparative analyses, as proposed in the first research question. This is one of the most innovative aspects of this work.
However, in terms of problems related to the study, it should be stressed that the aggregation of microdata by categories built on the basis of given criteria involves a simplification of the conditions of subjects (for example, women aged 65 with lower educational qualifications may have very different characteristics on the basis of other variables). It would therefore be better to implement harmonised surveys at European level with longitudinal designs that enable the analysis of individual trajectories over time and more in-depth analysis of digital exclusion, similar to what can be done today with social exclusion based on EU-SILC surveys.
Regarding the second research question, at a substantive level the analysis of ISTAT microdata showed that in the Italian digital context there appears to be a relative-type Matthew effect. In fact, even in the face of a higher level of diffusion of technology over time, that confirms the absence of an absolute Matthew effect, digital exclusion curves appear to draw a model of progressive divergence among social groups. Rarely and only under some conditions, network effects are ameliorative of inequalities, more often they end up exacerbating disparities between various social groups (DiMaggio and Garipp 2012). In this manner, the strength of network effects is stronger for people who start from a situation of advantage in terms of availability of resources. The poor chase those who are richer in cultural and socioeconomic capital, registering increasing distances. Thus, those excluded from the network society are left alone in the “fourth world”, made up of multiple black holes of social exclusion (Castells 2000).
The results of the analysis show that for the first- and second-level digital divide, the gaps between the poorer categories (e.g. those with a low level of education and those over the age of 64) and the richer categories (e.g. students, young people aged between 14 and 19) were on the increase from 2001 to 2013.
The hypothesis guiding this work—that despite the general increase in the spread of technologies there is a strong relative Matthew effect in Italy—is empirically verified by using the relative indices proposed. We found a widening of the existing gaps, and a progressive impoverishment of the weakest sectors of the population. This is another innovative aspect of this analysis.
The Matthew effect could be tested within other contexts to check for hidden digital inequalities among different segments of the population, which are not detectable by the digital divide absolute measurements.
The Internet thus shows itself to be not only an active reproducer of social inequality but also a potential accelerator (Witte and Mannon 2010), which increases the opportunities of empowerment for those who are already in an advantageous position in society and weakens improvements in the quality of life for those already at risk of social exclusion before digital marginalisation (Blank and Groselj 2014; Blank 2013; van Deursen et al. 2015).
This effect is closely linked to the nature of technological innovation itself, which moves the skills bar needed to exploit the mechanisms of empowerment fostered by the Internet higher and higher, and ends up benefiting the “richest”. This therefore concerns the causes of digital inequalities linked to the classic dimensions of social inequalities such as education, race, income, age, marital status and gender (Norris 2001; van Dijk 2005; Warschauer 2003; Wasserman and Richmond-Abbott 2005), as well as to the cultural characteristics of different contexts (Drori and Jang 2003) and individual lifestyle and life stage (Anderson and Tracey 2002).
Digital and social inclusions are related, and “the influence of offline exclusion fields on digital exclusion fields is mediated by access, skills and attitudinal or motivational aspects. On the other hand, the relevance, quality, ownership and sustainability of engagement with different digital resources is said to mediate the influence of engagement on offline exclusion” (Helsper 2012, p. 403). Further research should consider the “third-level digital divide”, regarding the offline outcomes that Internet use produce (Helsper 2012; Helsper et al. 2016, van Deursen and Helsper 2015). In effect, the findings of this research highlight a less central role of the different activities so as to explain the digital marginalities. The digital skills thus become more and more important than the activities carried out by users “to translate engagement with an online activity into a tangible outcome” (Helsper et al. 2015, p. 55).
With the synthetic indices it proposes, this paper did not investigate the causes of these inequalities but set itself the goal of identifying simple and easily comparable measurements of first and second-level digital divide in order to highlight the persistence—and indeed worsening—of inequalities produced by the Matthew effect. These measurements should be useful to show how—contrary to what one might think due to the increasing diffusion of ICTs among the population—inequalities not only continue to exist, but increase among different social groups over time. This empirical evidence is needed to help policy-makers focus on the problem of the progressive impoverishment of part of the population and implement ad hoc policies aimed at reducing the gaps.
Notes
In view of the specificity of sociocultural and territorial contexts that it must take into account in its analyses, Eurostat continues to define regular use as “at least once a week (i.e. every day or almost every day or at least once a week but not every day) on average within the last three months before the survey. Use includes all locations and methods of access and any purpose (private or work/business related)” http://ec.europa.eu/eurostat/web/products-datasets/-/tin00091.
The empirical operationalisation of the concept is determined by certain documents that establish the current regulatory framework (Regulations (EC) Nos 808/2004 and 1006/2009) which govern empirical surveys on ICTs within Europe. This framework serves as a guideline on the items needed to build a useful regional benchmark for comparative analysis which is both longitudinal and transverse.
There might also be a process of closing the gap between “rich” and “poor”, or intermediate combinations in the rate of enrichment and impoverishment. This rare dynamic may happen when the Matthew effect does not occur and when the absolute and relative terms are inverted: in the first case, the rich become poor and the poor become richer; in the second case, both the rich and the poor become richer, but the pace of enrichment of the poor is much faster (Rigney 2010).
In this work, the words “poor” and “rich” are used broadly and do not refer specifically to the economic dimension.
Je(2) is the sum of squared errors in resulting subgroups, while Je(1) is the sum of squared errors in the group that is to be divided.
In 2009 the Internet skills were not detected.
The analysis was conducted using SPAD-TM software.
These are the homologous partial points which are more distant on the first factorial common plane.
References
Ala-Mutka, K. (2011). Mapping digital competence: Towards a conceptual understanding. Seville. ftp://ftp.jrc.es/pub/EURdoc/EURdoc/JRC67075_TN.pdf. Accessed November 3, 2014.
Anderson, B., & Tracey, K. (2002). The impact (or otherwise) of the internet on everyday british life. In B. Wellman & C. Haythornthwaite (Eds.), The internet in everyday life (pp. 139–163). Malden: Blackwell.
Bakardjieva, M. (2005). Internet society. The internet in everyday life. London: Sage.
Bawden, D. (2008). Origins and concepts of digital literacy. In C. Lankshear & M. Knobel (Eds.), Digital literacies: Concepts, policies and practices (pp. 17–32). New York: Peter Lang.
Bentivegna, S. (2009). Disuguaglianze digitali. Le nuove forme di esclusione nella società dell’informazione. Roma-Bari: Laterza.
Blank, G. (2013). Who creates content? Stratification and content creation on the Internet. Information, Communication and Society, 16(4), 590–612. doi:10.1080/1369118X.2013.777758.
Blank, G., & Groselj, D. (2014). Dimensions of Internet use: amount, variety, and types. Information, Communication and Society, 17(4), 417–435. doi:10.1080/1369118X.2014.889189.
Bonfadelli, H. (2002). The internet and knowledge gaps: A theoretical and empirical investigation. European Journal of Communication, 17(1), 65–84. doi:10.1177/0267323102017001607.
Bourdieu, P. (2001). La distinzione. Critica sociale del gusto. Bologna: il Mulino.
Bracciale, R. (2010). Donne nella rete. Disuguaglianze digitali di genere. Milano: FrancoAngeli.
Bracciale, R., & Mingo, I. (2009). La e-inclusion e le competenze digitali: il contesto Europeo e il caso dell’Italia. In I. Mingo (Ed.), Concetti e quantità. Percorsi di statistica sociale (pp. 179–214). Acireale-Roma: Bonanno.
Bracciale, R., & Mingo, I. (2015). Digital divide in time of crisis in Europe: Do the rich get richer, the poor get poorer? In A. Borghini & E. Campo (Eds.), Exploring the crisis: theoretical perspectives and empirical investigation (pp. 41–57). Pisa: Pisa University Press.
Brandtzæg, P. B., Heim, J., & Karahasanović, A. (2011). Understanding the new digital divide—A typology of Internet users in Europe. International Journal of Human-Computer Studies, 69(3), 123–138. doi:10.1016/j.ijhcs.2010.11.004.
Bunz, U., Curry, C., & Voon, W. (2007). Perceived versus actual computer-email-web fluency. Computers in Human Behavior, 23(5), 2321–2344. doi:10.1016/j.chb.2006.03.008.
Castells, M. (2000). End of millennium. The information age: Economy, society, and culture. Oxford: Blackwell.
Chen, W., & Wellman, B. (2004). The global digital divide—within and between countries. It and Society, 1(7), 39–45.
Cruz-Jesus, F., Oliveira, T., & Bacao, F. (2012). Digital divide across the European Union. Information Management, 49(6), 278–291. doi:10.1016/j.im.2012.09.003.
De Haan, J. (2004). A multifaceted dynamic model of the digital divide. It and Society, 1(7), 66–88.
DiMaggio, P., & Garipp, F. (2012). Network effects and social inequality. Annual Review of Sociology, 38, 93–118.
DiMaggio, P., & Hargittai, E. (2001). From the ‘digital divide’ to ‘digital inequality’: Studying Internet use as penetration increases (No. 15). https://www.princeton.edu/~artspol/workpap/WP15%20-%20DiMaggio+Hargittai.pdf. Accessed September 29, 2012.
DiMaggio, P., Hargittai, E., Celeste, C., & Shafer, S. (2004). Digital inequality. From unequal access to differential use. In K. M. Neckerman (Ed.), Social inequality (pp. 549–566). New York: Russell Sage Foundation.
DiPrete, T. A., & Eirich, G. M. (2006). Cumulative advantage as a mechanism for inequality: A review of theoretical and empirical developments. Annual Review of Sociology, 32(1), 271–297. doi:10.1146/annurev.soc.32.061604.123127.
Donat, E., Brandtweiner, R., & Kerschbaum, J. (2009). Attitudes and the digital divide: Attitude measurement as instrument to predict internet usage. Informing Science: The International Journal of an Emerging Transdiscipline, 12, 37–56. http://www.inform.nu/Articles/Vol12/ISJv12p037-056Donat229.pdf. Accessed September 29, 2012.
Drori, G. S., & Jang, Y. S. (2003). The global digital divide a sociological assessment of trends and causes. Social Science Computer Review, 21(2), 144–161. doi:10.1177/0894439303251556.
Duda, R. O., Hart, P. E., & Stork, D. G. (1973). Pattern classification (2nd ed.). New York: Wiley.
Escofier, B., & Pagès, J. (1988). Analyses factorielles simples et multiples. Objectifs, methodes et interpretation. Paris: Dunod.
Ferrari, A. (2012). Digital competence in practice: An analysis of frameworks. Seville. http://ftp.jrc.es/EURdoc/JRC68116.pdf. Accessed November 3, 2014.
Guerrieri, P., & Bentivegna, S. (Eds.). (2011). The economic impact of digital technologies. Cheltenham: Edward Elgar.
Gui, M., & Argentin, G. (2011). Digital skills of internet natives: Different forms of digital literacy in a random sample of northern Italian high school students. New Media and Society, 13(6), 963–980.
Haddon, L. (2004). Information and communication technologies in everyday life: A concise introduction and research guide. Oxford: Berg.
Harambam, J., Aupers, S., & Houtman, D. (2012). The Contentious Gap. From Digital divide to cultural beliefs about online interactions. Information, Communication and Society. doi:10.1080/1369118X.2012.687006.
Hargittai, E. (2002). Second-level digital divide: Differences in People’s Online Skills. First Monday, 7(4), 1–17. http://firstmonday.org/htbin/cgiwrap/bin/ojs/index.php/fm/article/viewArticle/942. Accessed September 29, 2012.
Hargittai, E. (2003). The digital divide and what to do about it. In D. C. Jones (Ed.), New economy handbook (pp. 821–841). San Diego: Academic Press.
Hargittai, E. (2005). Survey measures of web-oriented digital literacy. Social Science Computer Review, 23(3), 371–379.
Hargittai, E. (2008). The digital reproduction of inequality. In D. Grusky (Ed.), Social stratification (pp. 936–944). Boulder: Westview Press.
Hargittai, E., & Hinnant, A. (2008). Digital inequality: Differences in young adults’ use of the internet. Communication Research, 35(5), 602–621.
Hargittai, E., & Hsieh, Y. P. (2013). Digital inequality. In W. H. Dutton (Ed.), The Oxford handbook for internet studies (pp. 129–150). Oxford: Oxford University Press.
Hargittai, E., & Shafer, S. (2006). Differences in actual and perceived online skills: The role of gender. Social Science Quarterly, 87(2), 432–448.
Helsper, E. J. (2012). A corresponding fields model for the links between social and digital exclusion. Communication Theory, 22(4), 403–426.
Helsper, E. J., & Eynon, R. (2013). Distinct skill pathways to digital engagement. European Journal of Communication, 28(6), 696–713.
Helsper, E. J., Eynon, R., & van Deursen, A. J. A. M. (2016). Measuring types of internet use. From digital skills to tangible outcomes project report. http://www.lse.ac.uk/media@lse/research/From-digital-skills-to-tangible-outcomes.aspx. Accessed September 7, 2016.
Helsper, E. J., van Deursen, A. J. A. M., & Eynon, R. (2015). Tangible outcomes of internet use. From digital skills to tangible outcomes project report. www.oii.ox.ac.uk/research/projects/?id=112. Accessed June 20, 2015.
Hunsinger, J., Klastrup, L., & Allen, M. (Eds.). (2010). International handbook of internet research. London, New York: Springer.
ISTAT-FUB. (2015). Internet@Italia 2014. L’uso di Internet da parte di cittadini e imprese.
Kalmus, V., Realo, A., & Siibak, A. (2011). Motives for Internet use and their relationships with personality traits and socio-demographic factors. Trames, 15(4), 385–403. doi:10.3176/tr.2011.4.04.
Katz, J. E., & Rice, R. E. (2002). Social consequences of Internet use. Access, involvement, and interaction. Cambridge: MIT Press.
Kraut, R., Kiesler, S., Boneva, B., Cummings, J., Helgeson, V., & Crawford, A. (2002). Internet paradox revisited. Journal of Social Issues, 58(1), 49–74. doi:10.1111/1540-4560.00248.
Liff, S., & Shepherd, A. (2004). An evolving gender digital divide? OII, Oxford Internet Institute, 2, 1–17. doi:10.2139/ssrn.1308492.
Merton, R. K. (1968). The Matthew effect in science. Science, 159(3810), 56–63. doi:10.1126/science.159.3810.56.
Merton, R. K. (1973). The sociology of science: Theoretical and empirical investigation. Chicago: University of Chicago Press.
Mossberger, K., Tolbert, C., & Stansbury, M. (2003). Virtual inequality. Georgetown: Georgetown University Press.
Norris, P. (2001). Digital divide: Civic engagement, information poverty, and the internet wOrldwide. Cambridge: Cambridge University Press.
NTIA (National Telecommunication and Information Administration Us Department of Commerce). (1999). Falling through the net: Defining the digital divide. http://www.ntia.doc.gov/legacy/ntiahome/fttn99/contents.html. Accessed April 15, 2015.
Ono, H., & Zavodny, M. (2007). Digital inequality: A five country comparison using microdata. Social Science Research, 36(3), 1135–1155. doi:10.1016/j.ssresearch.2006.09.001.
Papacharissi, Z., & Rubin, A. M. (2000). Predictors of internet use. Journal of Broadcasting and Electronic Media, 44(2), 175–196. doi:10.1207/s15506878jobem4402_2.
Prezerakos, G. N., & Polykalas, S. E. (2014). Implications of the financial crisis to the digital divide across European union. In International Conference on Information Society (i-Society 2014). doi:10.13140/2.1.2099.4887.
Rigney, D. (2010). The Matthew effect: How advantage begets further advantage. New York: Columbia University Press. doi:10.7312/rign14948.
Sassi, S. (2005). Cultural differentiation or social segregation? Four approaches to the digital divide. New Media and Society, 7(5), 684–700. doi:10.1177/1461444805056012.
Selwyn, N. (2003). Apart from technology: Understanding people’s non-use of information and communication technologies in everyday life. Technology in Society, 25(1), 99–116. doi:10.1016/S0160-791X(02)00062-3.
Selwyn, N. (2004). Reconsidering political and popular understandings of the digital divide. New Media and Society, 6(3), 341–362. doi:10.1177/1461444804042519.
Sieverding, M., & Koch, S. C. (2009). (Self-)Evaluation of computer competence: How gender matters. Computers and Education, 52(3), 696–701.
van Deursen, A. J. A. M., & Helsper, E. J. (2015). The third-level digital divide: Who benefits most from being online? In L. Robinson, S. R. Cotten, J. Schulz, T. M. Hale, & A. Williams (Eds.), Communication and information technologies annual (pp. 29–52). Emerald Group Publishing Limited, Bingley. doi:10.1108/S2050-206020150000010002.
van Deursen, A. J. A. M., Helsper, E. J., & Eynon, R. (2014). Measuring digital skills. From digital skills to tangible outcomes project report. www.oii.ox.ac.uk/research/projects/?id=112. Accessed June 20, 2015.
van Deursen, A. J. A. M., & van Dijk, J. A. G. M. (2010). Measuring internet skills. International Journal of Human-Computer Interaction, 26(10), 891–916. doi:10.1080/10447318.2010.496338.
van Deursen, A. J. A. M., & van Dijk, J. A. G. M. (2014). The digital divide shifts to differences in usage. New Media and Society, 16, 507–526.
van Deursen, A. J. A. M., van Dijk, J. A. G. M., & Peters, O. (2011). Rethinking Internet skills: The contribution of gender, age, education, Internet experience, and hours online to medium- and content-related Internet skills. Poetics, 39(2), 125–144.
van Deursen, A. J. A. M., van Dijk, J. A. G. M., & Peters, O. (2012). Proposing a survey instrument for measuring operational, formal, information, and strategic internet skills. International Journal of Human-Computer Interaction, 28(12), 827–837.
van Deursen, A. J. A. M., van Dijk, J. A. G. M., & ten Klooster, P. M. (2015). Increasing inequalities in what we do online: A longitudinal cross sectional analysis of Internet activities among the Dutch population (2010 to 2013) over gender, age, education, and income. Telematics and Informatics, 32(2), 259–272. doi:10.1016/j.tele.2014.09.003.
van Dijk, J. A. G. M. (2005). The deepening divide: Inequality in the information society. Thousand Oaks: Sage.
van Dijk, J. A. G. M. (2006). Digital divide research, achievements and shortcomings. Poetics, 34(4–5), 221–235.
van Dijk, J. A. G. M. (2009). One Europe, digitally divided. In A. Chadwick & P. N. Howard (Eds.), Routledge handbook of internet politics (pp. 288–304). London-New York: Routledge.
van Dijk, J. A. G. M., & van Deursen, A. J. A. M. (2014). Digital skills. Unlocking the information society. New York: Palgrave Macmillan.
Vicente, M. R., & López, A. J. (2011). Assessing the regional digital divide across the European Union-27. Telecommunications Policy, 35(3), 220–237. doi:10.1016/j.telpol.2010.12.013.
Warschauer, M. (2003). Technology and social inclusion: Rethinking the digital divide. Cambridge: MIT Press.
Wasserman, I. M., & Richmond-Abbott, M. (2005). Gender and the internet: Causes of variation in access, level, and scope of use. Social Science Quarterly, 86(1), 252–270. doi:10.1111/j.0038-4941.2005.00301.x.
Wellman, B., & Haythornthwaite, C. (Eds.). (2002). The internet in everyday life. Malden: Blackwell.
Witte, J. C., & Mannon, S. E. (2010). The internet and social inequalities. New York-London: Routledge.
Zillien, N., & Hargittai, E. (2009). Digital distinction: Status-specific types of internet usage. Social Science Quarterly, 90(2), 274–291.
Author information
Authors and Affiliations
Corresponding author
Appendix: Sociodemographic Categories
Appendix: Sociodemographic Categories
A: Cluster analysis | |
H * A (20–34) * M | LM * A (14–19) * F |
H * A (20–34) * F | LM * A (20–34) * M |
H * A (35–45) * M | LM * A (20–34) * F |
H * A (35–45) * F | LM * A (35–45) * M |
H * A (46–54) * M | LM * A (35–45) * F |
H * A (46–54) * F | LM * A (46–54) * M |
H * A (55–64) * M | LM * A (46–54) * F |
H * A (55–64) * F | LM * A (55–64) * M |
H * A (64+) * M | LM * A (55–64) * F |
H * A (64+) * F | LM * A (64+) * M |
UM * A (17–19) * M | LM * A (64+) * F |
UM * A (17–19) * F | L * A (14–19) * M |
UM * A (20–34) * M | L * A (14–19) * F |
UM * A (20–34) * F | L * A (20–34) * M |
UM * A (35–45) * M | L * A (20–34) * F |
UM * A (35–45) * F | L * A (35–45) * M |
UM * A (46–54) * M | L * A (35–45) * F |
UM * A (46–54) * F | L * A (46–54) * M |
UM * A (55–64) * M | L * A (46–54) * F |
UM * A (55–64) * F | L * A (55–64) * M |
UM * A (64+) * M | L * A (55–64) * F |
UM * A (64+) * F | L * A (64+) * M |
LM * A (14–19) * M | L * A (64+) * F |
B: Multiple factorial analysis | |
H * A (20–34) * M | UM * A (55–64) * M |
H * A (20–34) * F | UM * A (55–64) * F |
H * A (35–45) * M | UM * A (64+) * MF |
H * A (35–45) * F | LM * A (14–19) * M |
H * A (46–54) * M | LM * A (14–19) * F |
H * A (46–54) * F | LM * A (20–34) * M |
H * A (55–64) * M | LM * A (20–34) * F |
H * A (55–64) * F | LM * A (35–45) * M |
H * A (64+) * MF | LM * A (35–45) * F |
UM * A (17–19) * M | LM * A (46–54) * M |
UM * A (17–19) * F | LM * A (46–54) * F |
UM * A (20–34) * M | LM * A (55–64) * M |
UM * A (20–34) * F | LM * A (55–64) * F |
UM * A (35–45) * M | LM * A (64+) * MF |
UM * A (35–45) * F | L * A (14–34) * MF |
UM * A (46–54) * M | L * A (35–54) * MF |
UM * A (46–54) * F | L * A (55–74) * MF |
Rights and permissions
About this article

Cite this article
Mingo, I., Bracciale, R. The Matthew Effect in the Italian Digital Context: The Progressive Marginalisation of the “Poor”. Soc Indic Res 135, 629–659 (2018). https://doi.org/10.1007/s11205-016-1511-2
Accepted:
Published:
Issue Date:
DOI: https://doi.org/10.1007/s11205-016-1511-2