
Abstracts
Most approaches to patent citation network analysis are based on single-patent direct citation relation, which is an incomplete understanding of the nature of knowledge flow between patent pairs, which are incapable of objectively evaluating patent value. In this paper, four types of patent citation networks (direct citation, indirect citation, coupling and co-citation networks) are combined, filtered and recomposed based on relational algebra. Then, a method based on comprehensive patent citation (CPC) network for patent value evaluation is proposed, and empirical study of optical disk technology related patents has been conducted based on this method. The empirical study was carried out in two steps: observation of network characteristics over the entire process (citation time lag and topological and graphics characteristics), and measurement verification by independent proxies of patent value (patent family and patent duration). Our results show that the CPC network retains the advantages of patent direct citation, and performs better on topological structure, graphics features, centrality distribution, citation lag and sensitivity than a direct citation network; The verified results by the patent family and maintenance show that the proposed method covers more valuable patents than the traditional method.
Introduction
Patents have long been recognized as a very rich data source for studies on innovation and technical changes. There are several advantages to patent data. For example, patents display extremely wide coverage in terms of technologies, assignees and geography; each patent contains detailed information on innovation; patent data are administrative data and are widely available at relatively low cost. Thus patents have become an important measurement for evaluating technical change, technology strategies, and market trends. The use of patents and patent statistics as indicators of technological progress stands for both a long tradition and a controversial discussion about the value of patents as indicators of technological progress (Schmookler 1966; Griliches 1990). The OECD Patent Statistics Manual (OECD 2009) gives a detailed list about patents as statistical indicators of inventive activity, and covers the advantages and disadvantages of patent statistic indictors in depth. The disadvantages include, among others, the fact that not all inventions are patented (Pavitt 1988), and the highly skewed distribution of patent value (Harhoff et al. 1999). It is therefore important to take into account the advantages and disadvantages when compiling and interpreting patent data, as failing to do so may lead to erroneous conclusions.
It is widely acknowledged that the value of an innovation can change (often dramatically) over time. The term “patent value” has several different meanings during the different stages of the innovation value chain (Schumpeter 1939). New technology may come along to supplant the old, rendering the old partially or possibly totally obsolete and hence less valuable. Conversely, complementary technology may be commercialized by further development, rendering the old innovation more valuable than it previously had been; in the meantime, changes in consumer taste in the market also influence the value of technology innovation (Sherry and Teece 2004). In fact, patent value is not carved in stone. We should consider the issue of patent value in the context of the multiple stages in patent evolution.
Patent value research is motivated by a variety of different reasons. The literature on patent value differentiates between reasons driven by strategic needs and those driven by technology management purposes. In terms of strategic needs, patent valuation can be subject to sales, purchase, or licensing transactions, and may boost cooperation between companies, ranging from joint ventures and alliances to acquisitions and mergers. In the area of technology management, patent value evaluation can be used in identifying core patents, and establishing technology early warning and tracking systems. Reitzig (2003) summarizes four factors affecting patent’s economic value from the technological perspective: novelty, inventive activity, disclosure, and breadth (Reitzig 2003; Pitkethly 1997). In this paper, we define patent value as the technological value. The long-term technological value is the importance of a patent as a foundation for subsequent technological inventions .
Currently, patent bibliographic information from the patenting procedure have been followed by researchers to estimate or infer the technological value of patents (von Wartburg et al. 2005). These bibliographic indicators comprise backward citations (Narin et al. 1987), forward citations (Trajtenberg 1990), family size (Harhoff et al. 2003), market value of the corporation (Hall et al. 2005), and claims (Lanjouw and Schankerman 2004). Among these bibliographic patent value indicators, patent citation (also called patent forward citation) is the indicator that has been focused upon most and has been the subject of the most in-depth research. Empirical studies have revealed a positive relationship between “times cited” of patents and the social value of inventions (Trajtenberg 1990). Therefore, one may conclude that more often cited patents seem to generate higher technological value. Thus, by analyzing patent citation information, the patent technological value can be indirectly measured.
The implementation of patent value evaluation by citation analysis is based on the two assumptions: patent citation can be seen as an intellectual debt, which when received by a patent can be seen as an indication of the patent’s importance, impact or even economic value. Similarly, patent citation can also be interpreted as a “paper trail” or technological “footprint” left by knowledge (related to technology) flowing from the inventor/applicant of the cited document to the inventor/applicant of the citing one (Hall et al. 2005). Hall et al. (2005) thought the two aspects were related, with only minor differences in viewing angle, as “clearly there is room to aim for an integrated approach”.
In the past 20 years or so, there have been many criticisms leveled against these two assumptions, especially the two criticisms of whether patent citations really reflect knowledge transfer or accumulation between inter-personal knowledge flows, because patent citations mainly derive from patent examiners, rather than inventors, being ultimately responsible for the citations attached to patent documents (Breschi and Lissoni 2005). However, because of the existence of the inventor’s defensive motivation, an assignee may deliberately choose not to cite the relevant patents of competitors (Chen et al. 2011).
Based on the limitations of the above assumptions, scholars have tried to improve patent citation evaluation by adding identifications for the characteristics of edge between inter-personal knowledge flows. For example, some scholars have divided citations into examiner’s citations and applicant’s citations to test for the effects of evaluation (Alcácer et al. 2009; Emmanuel and Megan 2005). Other scholars developed a co-citation method by taking the text similarity into account (Li et al. 2007), and this method tends to preserve the essential structural components of the corresponding traditional co-citation network. Still other scholars have used bibliographic coupling to identify missing relevant patent citation links, which greatly enhanced the effectiveness of identifying potential competitors (Chen et al. 2011). Further scholars have used indirect patent citation—the length of citation chains—to improve patent valuation, obtaining more precise information about the impact of that patent (Atallah and Rodríguez 2006).
von Wartburg et al. (2005) thought that currently most of studies only used single patent citation information, and only a few studies accounts for longer citation chains and getting more out of the historical citation information (von Wartburg et al. 2005). In fact, the overall relationship among all the patents based citation is extremely rich, For example, direct citation analysis uncovers the explicit knowledge flow; co-citation analysis uncovers the structure of the base knowledge; and bibliographic coupling analysis reveals research subtopics, all these potential information based on citations should be integrated and utilized instead of discarding. The use of multiple citation-based relationships combination to foresee the research fronts has been developed and applied for almost two decade (Glänzel 2012; Zitt and Bassecoulard 1994). However, there is little to study on the evaluation of patent value by using multiple citation-based relationship combinations. This is based on the fact that some scholars have begun to propose methods to effectively combine multiple types of citation, so-called “comprehensive patent citation networks”, in order to facilitate a better understanding of patent citation network.
In this paper, the author constructed a CPC network for patent value estimation by the following three steps: CPC network establishment (aggregating, filtering, recomposing); observation of network characteristics (citation time lag and topological and graphics characteristics); and measurement verification (patent family and patent duration). The first step systematically combines the four types of patent citation networks (direct citation, indirect citation, patent coupling, co-citation). Such a network is a combination of data on real-time patent citing relationships, showcasing a more thorough demonstration of Internet observation and avoiding the limitations of employing single citation relationships. The second step uses an empirical study based on the data of optical disks to observe network characteristics. The last step is measurement verification, in which patent family and patent duration data were verified as patent value proxies, showing comparisons of direct citation networks. Patents with higher indegree in the CPC network can be more sensitive than the patent citation network from the citation time lag perspective, which shows more accurate results covering the triadic patent family and has a long duration time of the patent. Through indicators from CPC and PCI, the effectiveness of CPC is confirmed .
This paper is structured as follows: the second section reviews related literature; the third section proposes a construction method for a CPC network; the fourth section is the empirical study based on data on optical disks; finally, conclusions and prospects are presented.
Literature review
Citation analysis has its origins within bibliometrics. Meyer (2000) studied the similarities and differences between patent citations and paper citations. Scientific publications and patent citations are both widely perceived as measurements of the impact of technology and have similar network structural features (Meyer 2000). This paper applies the citation techniques of scientific publications to patent citation analysis based on similarities between patent citations and paper citations. That said, patent citations are multifaceted and complex, and there are some differences between patent citations and paper citations. Walker (1995) concludes that in a journal article, the author cites those authors that have contributed to the subject of the article, whereas a patent examiner cites previous patents and other works that relate to the application during examination for patentability. In addition, (Webb et al. 2005) noted that patent citation also reflects underlying national differences. Due to the existence of Information Disclosure Statements (IDS), in the United States, applicants have a “duty of candor” to disclose any prior art “material to patentability” of an invention, meaning that a patent filed in the United States generally contains more citations (Alcácer et al. 2009). As such, when adapting bibliometric techniques to patent citation analysis we need to treat these differences with caution.
Direct citation is the most familiar citation-based type. Garfield (1966) explained the law of the indicators of the quantity of direct citation and proposed that direct citation can be used for technical evaluation and technical similarity analysis (Garfield 1966). Direct citation is a dyadic description for the citing–cited relationship, which allows us to observe the patterns and end points of the knowledge flow process. However, both inventors and examiners experience long time lags of almost 7 and 10 years (Alcácer and Gittelman 2006; Hall et al. 2001). This delay undermines the timeliness and reliability of patent value evaluation.
With in-depth research into citation relationships, the citation-based relationships under investigation have gradually expanded. The concept of bibliographic coupling was first proposed by Kessler (1963). Small (1973) presented the concept of co-citation (Small 1973). These two citation-based relationships, which are called similarity-based citation networks, exhibit a similar principle that represents a shared relationship between two patents through citing a common third patent, or being cited by two patents. This is a proxy for what we call “sharedness” between these patents. The sharedness relationship has no time restrictions, and the relationship within patent pairs reflects the network structural features, so similarity-based citation networks can reveal the implicit knowledge flow that direct patent citation cannot acquire.
The concept of indirect citation, previously named “longitudinal coupling,” and related research, can trace their roots back several decades (Small 1997). Patent direct citation networks only take into account the immediate citing–cited relationship within patent pairs and neglect their indirect ties. It is reasonable to assume that the technological foundation of citing patents not only encompasses the most recent developments cited directly, but also draws on basic principles provided by earlier patents. Connections to basic patents are revealed by indirect linkages, which are captured by citation chains (von Wartburg et al. 2005). Furthermore, all citations should not be equal. Patent quality takes into account explicitly not only the number of citations received by a patent, but also the quality of all patents involved in the “chain” of citations starting with that patent (Atallah and Rodríguez 2006).
The above four types of citation-based networks exhibit separately unique pattern, which cover most representative 4 type of subgraphs from the triadic census (all possible traids) prespective, and all citation-based networks come into being through the combination of the above 4 type of traids. So analyzing the 4 type of networks can be more fully reflected the structural characteristics of patent citation network (De Nooy et al. 2011; Small 1997). Currently, most approaches to patent network analysis only analyze single relationships among four types of citations. When the lens is trained on a single relationship, an incomplete understanding of the nature of knowledge flow may result, so that patent value cannot be objectively evaluated. In terms of patent valuation, the purpose of incorporating the above three citation-based indicators into the measurement of patent quality is in essence the same, which is to revise a basic hypothesis of all citations being counted with equal weight, and to leverage the weighting system of direct-citation-based indicators. Taking into account indirect citation factors ensures the weighting system gives greater weight to long-term sustainable patents, while taking into account co-citation and bibliographic factors ensures the weighting system strengthens the influence of “missing links”, which are revealed by filtering citations with a high similarity characteristic.
However, many authors have compared citation approaches, and the above four types of citation-based network separately exhibit unique patterns that cover the four most representative types of subgraphs from the perspective of triad census (all possible triads) (Wasserman and Faust 1994). Furthermore, all citation-based networks come into being through the combination of the above four types of triad (Small 1997; von Wartburg et al. 2005). So analyzing the four types of network can more fully reflect the structural characteristics of patent citation networks (De Nooy et al. 2011; Small 1997). The above comparison of several types of citation shows that no matter which kind of result is more accurate, the single citation analytic technique is inadequate and inefficient.
From the above comparison of several type of citations, the results show that no matter which kind of result is more accurate, the single citation analytic technique was inadequate and inefficient. Thus, the approach of comprehensive patent citation networks, which is similar to the concept of “combined linkage” proposed by Small (1997), can represent the information richness of whole citation chains during the citation formation process, which shortens citation lags within patent pairs and replenishes the implicit knowledge flow from missing links, and a comprehensive analysis can be conducted to help to uncover common antecedents that affect relationships. Hence this analytic method is a suitable approach.
Today comprehensive analysis based on multiple citation relationships is becoming more mainstream, as many authors have compared citation approaches Shibata et al. (2008) drew a comparison of the three types of citation network (co-citation, bibliographic coupling and direct citation) to detect emerging research fronts. The research showed that direct citation could detect large and young emerging clusters earlier than coupling and co-citation, and shows the best performance in detecting a research front, while co-citation showed the worst (Shibata et al. 2008). Boyack and Klavans (2010) compared the performance of clustering in journal citation networks created by direct citation and co-citation. Their results suggested that a network of direct citations had higher content similarity (Boyack and Klavans 2010).
A comprehensive understanding of a multiple-citation-based network structure is important for a better understanding patent citation. And many scholars agree that the combined method based on multiple types citations is an effective method. Chen et al. (2011) identified the missing relevant patent links using combining bibliographic coupling (Chen et al. 2011; Huang et al. 2011); Atallah and Rodríguez (2006) evaluated the quality of the citing patents, not just the number of citations received by a patent (Atallah and Rodríguez 2006); Small (1997) proposed a idea that combining the direct citation link with all forms of the indirect linkage into a single measure, and to establish a weighted scheme for all four type of citation-based relationships (Small 1997; von Wartburg et al. 2005) proposed that single-stage citation analysis is insufficient to reveal specific paths of technological development, to mirror actual developments in a certain technological field, citation analysis should rely on multiple citation relationships (von Wartburg et al. 2005). All these methods attempt to receive a more comprehensive understanding of “real” patent citation networks through combining the other citation-based elements.
However, there are many problems that remain unsolved through the combined approaches mentioned above, which can be summarized by two points. First, why is the combined citation-based network employed as a tool of patent value evaluation? Chen et al. (2011) considered that there may be some missing relevant patents, and analyses of patent citations may be inaccurate due to incomplete information on the relationships among patents; Atallah and Rodríguez (2006) considered that all citations do not have equal value, citations coming from patents of different qualities should be given a different rating, and combining indirect patent citations into patent citation indicators should be proposed to estimate patent value. Like citation time lag, network topological characteristics are also important issues that hinder patent value evaluation effects, as a good patent value indicator should evaluate the latest patents as soon as possible, and new patent value indicators should be streamlined as much as possible. Second, considering how and the extent to which we should combine the different types of citations, there have been many approaches that combined two or more citations from one perspective (Atallah and Rodríguez 2006; Yan and Ding 2012), however the related research is still not full-scale or systematic.
Another difficulty of patent value evaluation from the CPC perspective is that there is no existing fair and equitable standard for verifying patent evaluation. Researchers have created a wide range of indirect measurement methods and proxies. In the these measure approaches, data of renewal and family, which reflect the patents’ temporal and spatial scope of protection, are correlated to the R&D cost of products, which pay for patents. Therefore, these two indicators are frequently used as proxy indicators for patent evaluation. Patents included in the family typically have higher value, as patentees only take on the additional costs and delays of extending protection to other countries if they deem it worthwhile. Renewal data is similar, reflecting the determination of patent holders (de la Potterie and van Zeebroeck 2008); the renewal fee typically increases over time, and, at the end of every period, patent holders must decide whether or not to renew. This paper uses patent renewal data along with patent family data as a proxy for patent value, to verify the measured effects of the CPC network in predicting which patents will be renewed and which belong to triadic patent families, inferring that the CPC network is indeed associated with technological value of patents.
Establishing the CPC network
Basic citation-based relationships
Any network can be described in terms of the proportions in the network of each of the 16 types of triad. This is called a triad census (Wasserman and Faust 1994). Understanding triads and their distribution in the network is important because triads provide the basis for many network structural characteristics. From the triad census, patent citation relationships can be categorized into five types of isomorphic triad: direct citation, indirect citation, coupling, co-citation, and transitive triple. The transitive triple is a special form of triad census that can be combined with any of the four underlying basic citation-based network types, so the transitive triple should not be thought of as a basic citation-based network type in the context of this paper. The basic citation-based network types are shown in Table 1. The relationships between triad census and transitivity are similarities rather than differences. Both sources form the basis of thinking about how patents can be cohesive, but triad census is more suitable for analyzing directed networks. Triad census can subdivide the entire network into 16 unique subgraphs in terms of the proportion of triads, so triad census provides the basis for network structural characteristics. The transitivity measure is the number of transitive triads divided by the number of possible transitive triads irrespective of variance of citation relationship.
Construction of different patent citation networks
Patent citation data are inherently asymmetric in nature. This is due to the time-based character of citation information, whereby only the younger patent is able to cite the elder one, so that the arrow of a patent pair can only point to the younger patent. The relationship of coupling or co-citation is symmetric in dyads. However, when we extend our perspective to triads, as shown in Table 1, we find the symmetric relationships of coupling or co-citation that are outlined in dotted boxes corresponding to the coupling or co-citation columns. The citation networks are subsequently constructed based on the characteristics of the four basic citation relationships:
-
1.
Patent Direct Citation Network (PCI) is constructed by the citing and cited relationship between patents. An arc from vertex i to vertex j denotes that the patent j is cited by the patent i. The patent i is defined as the citing patent, and the patent j is defined as the cited patent. A patent can be both a citing and cited patent from the global network perspective. The adjacency matrix PCI can be defined as:
$${\text{PCI}} = \left\{ {\begin{array}{*{20}c} 1 & {\text{if the patent j is cited by the patent i}} \\ 0 & { {\text{otherwise}}} \\ \end{array} } \right.$$(1)where PCI is an asymmetric m × m matrix, i.e., \(pci_{ij} \ne pci_{ji} ,{\text{m}} = \left| {\text{P}} \right|\), P is the set of patents.
-
2.
Patent Indirect Citation Network (PID) is constructed by patent pairs with inter-generational relationships (unless otherwise stated, the length of path between pairs is defined as 2 in this paper). PID is based on the basic network PCI. The multi-generational relationship between a patent pair can also be defined as PCI[n]. If there is patent k, make \(pci_{ki} pci_{kj} = 1\), then \(pid_{ij}^{\left[ 2 \right]} = \sum _{k = 1}^{N} pci_{ik} pci_{kj}\). The adjacency matrix PID can be defined as (Xiaofan et al. 2012):
$${\text{PID}} = {\text{PCI}}^{{\left[ {\text{n}} \right]}}$$(2)where PID is an asymmetric m × m matrix, i.e., \(pid_{ij} \ne pid_{ji}\)
-
3.
Patent Coupling Network (PCP) Patent coupling occurs when two patents both cite one patent in common. PCP is constructed by the co-occurrence relationship of patent pairs. The construction of a patent coupling network is also based on the basic network’s PCI. If patents i and j both have arcs pointing to patent k, then pci ik pci jk = 1; otherwise, pic ik pci jk = 0. Specifically, the subgraph of PCP consists of three parts: two arcs separately representing patent i citing patent k (i → k) and patent j citing patent k (j → k), and a symmetrical link between the two patents (i−j). These symmetrical links are the focuses of the subgraph of PCP. The adjacency matrix PCP can be defined as by (Yan and Ding 2012):
$${\text{PCP}} = {\text{PCI}} \times {\text{PCI}}^{\text{T}}$$(3)where PCP is a symmetric m × m matrix, i.e., \(pcp_{ij} = pcp_{ji}\)
And the coupling counts of patent i and j is:
$$pcp_{ij} = \mathop \sum \limits_{k = 1}^{N} pci_{ik} pic_{jk}$$(4) -
4.
Patent Co-citation Network (PCO) Co-citation, like coupling, is a similarity measure for patents that makes use of citation relationships, and is defined as the frequency with which two patents are cited together by other patents. PCO reflects the dual relationship of patent pairs. If patents i and j are both cited by patent k, then pci ki pci kj = 1; otherwise, pic ki pci kj = 0. Specifically, the subgraph of PCO consists of three parts: two arcs separately representing patent k citing patent i (k → i) and patent k citing patent j (k → j), and a symmetrical link between the two patents (i−j). These symmetrical links are the focuses of the subgraph of PCO. The adjacency matrix PCO can be transformed from PCI as:
$${\text{PCO}} = {\text{PCI}}^{\text{T}} \times {\text{PCI}}$$(5)where PCO is a symmetric m × m matrix, i.e., \({\text{PCO}}_{ij} = {\text{PCO}}_{ji}\)
And the co-citation counts of patent i and j is:
$$pco_{ij} = \mathop \sum \limits_{k = 1}^{N} pci_{kj} pic_{kj}$$(6)
Multiple citation relationships aggregation (MUCA)
As mentioned above, a single patent direct citation network does not fully reflect the implicit knowledge flowing within patent pairs. Because that implicit knowledge flow is often overlooked in patent citation network analysis, the issue of “missing links” was proposed by Wilson (1995), who found that some relevant information may be missing or simply unused in the patent direct citation network. Therefore, the paper considers combining all types of citation-based networks as far as possible from the triadic perspective to form a MUCA. There are some differences since the network is constructed based on various patent citation types. Accordingly, some processing, such as dichotomization, off-diagonal and asymmetric transformation, is necessary to ensure smooth matrix integration before citation-based network aggregation.
Firstly, it is necessary to dichotomize the PID, PCP, and PCO. Relational algebra provides a relational-combinated nominal dimension for evaluation. This evaluation dimension is only concerned with whether a certain type of relationship exists between patent pairs and how this relationship is combined, and not with the link strength and node frequency of matrix. As such, it will be necessary to do transformations on individual matrix before “reduction” and “combination” strategies can be applied. The process can be executed by the UCINET software (Borgatti et al. 2002): Transform > Dichotomize.
Secondly, the values on the main diagonal of many networks during the matrix transformations process are not very meaningful, and we need to remove the main diagonal and set all those values to zero or one. In the UCINET software, this step can be completed by Transform > Diagonal.
Thirdly, PCI and PID are asymmetric matrix, and PCP and PCO are symmetric matrix. Thus, we need normalize four types of matrix into a uniform asymmetric matrix. The reason for asymmetric transformation is to remove redundant information of the PCP and PCO networks. The asymmetric processing can take advantage of UCINET software functions Transform > Symmetrize > Lower Half or Transform > Symmetrize > Upper Half.
After data processing, PIDp, PCPp, and PCOp can be retrieved. Finally, we integrate the four citation-based networks into the MUCA. The mathematical adjacency matrix of the MUCA can be defined as:
where MUCA is an asymmetric m × m matrix, i.e., \(i > j,{\text{muca}}_{ij} \ne {\text{muca}}_{ji}\).
Filtering of the MUCA network
Through the aggregation of multiple citation relationships, we receive the most complete citation relations set, but the higher number set of relations does not imply higher quality, as too much information may mislead the results of our analysis. It is necessary to filter the MUCA in order to find the implicit knowledge flow, and therefore this paper classifies the MUCA into three levels based on relationship property, strength and overlap characteristics of network relationships.
-
1.
Relational property Newman distinguished four categories of real-world networks in an important review article: social networks (e.g., collaboration networks), information networks (e.g., citation networks), technical networks (e.g., Internet router networks), and biological networks (e.g., protein networks) (Newman 2010). Based on such divisions, patent direct citation is a real relationship, which is collectively established by the judgment of patent applicants and examiners, while PID, PCP, and PCO are “artificial relationships” based on transitivity or co-occurrence relationships. The core difference lies in whether or not relationships based on the citing behavior between “real relationship” and “artificial relationship” are based on objective criteria. A single “real relationship” link constitutes the ability to demonstrate knowledge flowing between patent pairs, However, there is some “noise” in patent pairs of artificial relationships, which is not enough to prove knowledge flow between patent pairs; only when in conjunction with other factors are artificial relationships used to identify knowledge flow. So the relationship property is used as a judgment supplement for identifying knowledge flow (Yoon and Park 2004).
-
2.
Relational strength For artificial relationships, there are two factors that need to be considered: the frequency and link strength of each patent pair, which are the two dimensions of local feature focus (Vinkler 1998). Link strength in particular is used as a method of knowledge flow judgment, and some ties below a certain threshold are filtered out when the link strength of a network has been calculated. Usually it is assumed that the stronger the link strength is, the more knowledge flow there is, showing that relational strength provides us with a second standard for filtering.
-
3.
Relational overlap Most previous studies have made the assumption that there is a single relationship for each patent pair. However, real networks often exhibit more complexity. Relational data, often represented as a multi-graph, can exhibit rich information (De Nooy et al. 2011). Complexity of patent citation networks is characterized by existence of an overlap relationship between the four types of citation networks. For example, there are not only direct citation relationships, but also co-citation relationships between patent pairs. The overlapping features can be used to identify traces of knowledge flow, help us to filter out accidental citations, and avoid some errors caused by artificial relationship networks. “Missing links”, for example, can be identified by overlap relationships.
Multi-layer networks by filtering
Based on the above filtering criteria, MUCA can be divided into four levels:
-
1.
Multi-relations Overlap Level (MOL) As MUCA has aggregated the four types of citation networks into a network, it inevitably shows a large number of redundant ties, which reflects the overlapping of patent pairs from different networks (Liu et al. 2010). In fact, this overlap is a very important structural characteristic of patent citation networks. Firstly, overlapping relations provide further evidence for examination of knowledge flow; secondly, overlapping relations contain features such as transitivity and reciprocity, which may be used to analyze the status of whole network. The MOL network can be defined as follows:
$${\text{MOL}} = \left\{ {\begin{array}{*{20}c} {1,} & {{\text{muca}}_{ij} > 1;} \\ {0, } & {{\text{otherwise}};} \\ \end{array} } \right.$$(8)where MOL is an asymmetric m × m matrix, \(i > j,{\text{mol}}_{ij} \ne {\text{mol}}_{ji}\).
-
2.
Single Real-relation Level (SRL) SRL contains all direct citations except the overlapping relations of MOL, because direct citation is a real relationship indicating knowledge flow between patent pairs based on citing behavior, established by both assignees and examiners, and stands as an independent level. The number of citations at this level will change dramatically over time, enabling new patents to enter the MOL with citations accumulated through a period of time. At the same time, some patents remain in the SRL. The SRL network filtering algorithm is as follows:
$${\text{SRL}} = \left\{ {\begin{array}{*{20}c} {1,} & { {\text{pci}}_{ij } - {\text{mol}}_{ij} > 0;} \\ {0, } & { {\text{otherwise}};} \\ \end{array} } \right.$$(9)where SRL is an asymmetric m × m matrix, \(i > j,{\text{srl}}_{ij} \ne {\text{srl}}_{ji}\).
-
3.
Single Artificial-relation Level with High Strength (SAH) For the artificial relationship, the single relevant relation may not indicate knowledge flow, and thus some auxiliary means are needed to jointly acknowledge knowledge flow existence (Braam et al. 1991). The cited frequency of a patent is an important indicator to acknowledge knowledge flow of patent pairs, so the SAH network is obtained by selecting citations with high link strength from single artificial relationships, i.e. indirect or coupling citations. Relation strength judgment can effectively eliminate the random error caused by relational algebra transformation, as an effective assistant means of judgment. The SAH network contains important “implicit knowledge flow”, so the SAH stands as an independent level.
Two steps are required to obtain the SAH. Take a co-citation relationship as an example:
Step 1 Calculate the co-cited frequency of each basic patent pair, which can be obtained through relational algebra transformation.
$${\text{PCO}} = \left\{ {\begin{array}{*{20}l} {\mathop \sum \limits_{k = 1}^{n} {\text{pci}}_{ki} {\text{pci}}_{kj} ,} \hfill & {i \ne j;} \hfill \\ 0 \hfill & { i = j;} \hfill \\ \end{array} } \right.\quad 1 \le i \le n,1 \le j \le n$$(10)Step 2 Calculate the linkage strength of each patent pair, which can be calculated from the incidence matrix.
$${\text{PCOs}} = \left\{ {\begin{array}{*{20}l} {\frac{{{\text{pco}}_{ij} }}{{{\text{pci}}_{i}^{ind} + {\text{pci}}_{j}^{ind} - {\text{pco}}_{ij} }},} \hfill & {i \ne j;} \hfill \\ {0,} \hfill & {i = j;} \hfill \\ \end{array} \quad } \right.1 \le i \le n,1 \le j \le n$$(11)where \({\text{pco}}_{ij}\) is the co-cited frequency calculated in the previous step, \({\text{pci}}_{i}^{ind}\) is the indegree of patent i and is also the patent i’s cited frequency. The same equations can be applied to analyzing the PCP and PID. The linkage strengths of patent pairs of the artificial relationships form the new asymmetrical matrix of PIDs, PCPs, and PCOs. Patent pairs below a certain threshold are filtered out and the remaining patent pairs comprise the PIDh, PCPh, and PCOh. We take the matrix average density α, β, γ as the thresholds for the PIDs, PCPs, and PCOs respectively, which is the input of the next step.
$${\text{PID}}h = \left\{ {\begin{array}{*{20}c} {1, } & {{\text{pid}}s_{ij} \ge\upalpha} \\ {0, } & {\text{otherwise}} \\ \end{array} } \right.$$(12)$${\text{PCP}}h = \left\{ {\begin{array}{*{20}c} {1, } & {{\text{pcp}}s_{ij} \ge\upbeta} \\ {0,} & {\text{otherwise}} \\ \end{array} } \right.$$(13)$${\text{PCO}}h = \left\{ {\begin{array}{*{20}c} {1, } & {{\text{pco}}s_{ij} \ge\upgamma} \\ {0,} & {\text{otherwise}} \\ \end{array} } \right.$$(14)SAH can be integrated by relational matrix of the PIDh, PCPh, PCOh.
$${\text{SAH}} = \left\{ {\begin{array}{*{20}c} {1,} & {{\text{pid}}\left( {\text{h}} \right)_{ij} + {\text{pcp}}\left( {\text{h}} \right)_{ij} + {\text{pco}}\left( {\text{h}} \right)_{ij} = 1} \\ {0,} & {\text{otherwise}} \\ \end{array} } \right.$$(15)where SAH is an asymmetric m × m matrix, \(i > j,{\text{sah}}_{ij} \ne {\text{sah}}_{ji}\).
-
4.
Single Artificial-relation with Low Strength (SAL) SAL and SAH have similar algorithms, which are separated by the threshold.
$${\text{PID}}l = \left\{ {\begin{array}{*{20}c} {1, } & {{\text{pid}}s_{ij} < \alpha } \\ {0, } & {\text{otherwise}} \\ \end{array} } \right.$$(16)$${\text{PCP}}l = \left\{ {\begin{array}{*{20}c} {1, } & {{\text{pcp}}s_{ij} < \beta } \\ {0,} & {\text{otherwise}} \\ \end{array} } \right.$$(17)$${\text{PCO}}l = \left\{ {\begin{array}{*{20}c} {1,} & {{\text{pco}}s_{ij} <\upgamma} \\ {0,} & {\text{otherwise}} \\ \end{array} } \right.$$(18)On an artificial level, the SAL is prone to generate more random errors, so those relationships are filtered out. SAL is defined as:
$${\text{SAL}} = \left\{ {\begin{array}{*{20}c} {1,} & { {\text{pid}}\left( {\text{h}} \right)_{ij} + {\text{pcp}}\left( {\text{h}} \right)_{ij} + {\text{pco}}\left( {\text{h}} \right)_{ij} = 1} \\ {0, } & {\text{otherwise}} \\ \end{array} } \right.$$(19)where SAL is an asymmetric m × m matrix, \(i > j,{\text{sal}}_{ij} \ne {\text{sal}}_{ji}\).
Constructing the CPC network
The aim of this paper is to recover as much structure as possible from a patent direct citation network. Through taking into account more systematic structural features, we can achieve better evaluation effects. It is perhaps best to combine all three citation relations into a single combined measured by relational algebra. Unlike the other combined approaches, the CPC network does not use weighting methods, seeing as citations come from different networks with independent feature types. In addition, patent value evaluation does not mean that the more citations are considered, the better, so we should choose patent pairs which reflect knowledge flow, and use those patent pairs after filtering the value of the patents’ value.Based on the previous standards, we integrate the MOL and SRL with SAH into the construction of the CPC.
A similar algorithm can be obtained using relational combination between MUCA and SAL. This can be obtained by the following equation:
where CPC is an asymmetric m × m matrix, \(i > j,{\text{sal}}_{ij} \ne {\text{sal}}_{ji}\).
Flowcharts are divided into two layers and four steps. The upper layer shows the matrix transformation process, and the lower layer shows the graphic changes. Four steps are organized by the order of CPC network construction: (1) matrix transformation; (2) aggregation; (3) multi-layer networks by filtering; (4) the CPC network establishment.
Observations of CPC network characteristics
Data
In order to demonstrate the feasibility of the research methodology, this paper focuses on optical disk technology. Developments in the optical disk field have occurred at a rapid pace over the last half-century. Many new optical disk formats (i.e. CD (1982), DVD (1995), UDO (2003), UMD (2004), Hi-MD (2004), BD (2006), HD DVD (2006)) have been produced, and thus far the optical disk has experienced four generations of technological changes. Enormous changes in optical disk technology make it easier for us to identify the influence of citations. For this paper, the author created a digital optical disk patent dataset to observe the proposed CPC network. United States Patent Classification (USPC) categories are used to represent different patent technology fields and the optical disk technology currently, classified under the main classification of USPC 720. So we retrieved the USPC 720 data, which come from the USCITES dataset (Sampat 2011) from 01/01/2000 to 12/31/2010, to establish the dataset of optical disk patent data. The USCITES dataset is a US patent citations dataset which is organized by a citing-cited list format, so this study took only patent citation on the citing side into account. The data coverage includes all U.S. patent citations in utility patents issued from 1/1/2000 to 12/31/2010. As a result, there are 1426 patents and 2474 references collected in the USPC 720 technology category Fig. 1.

Overall roadmap of CPC network construction
Topological properties
-
1.
Network sparse matrix As we all know, the overall citation network is sparsely linked, using scarcity patterns recognition, it is easier to find the features of four types of citation-based relationships, and sparse matrix figures can sketch out the basic outline of the networks as shown in Fig. 2.
Fig. 2 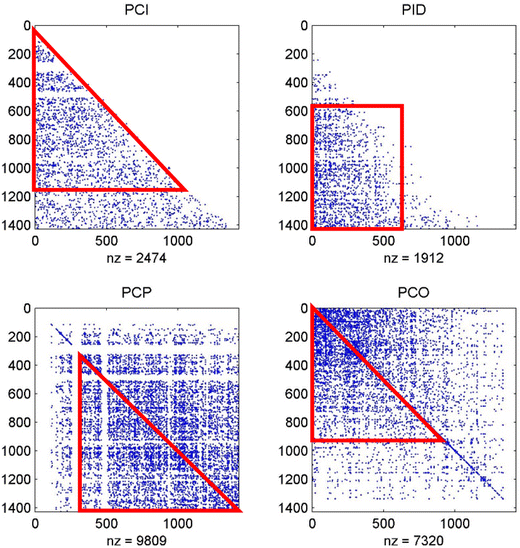
Sparse matrix figures of the four basic citation-based network types
Sparse matrix figures are constructed using a PCI matrix. A PCI matrix illustrates the relationship between citing and cited patents, particularly showing citing patents in the rows, and cited references in the columns. 1–1400 (the total number of patents is 1426) illustrates the arrangement of the patent number (patents in the USA are arranged by time, therefore their numbers also represent their order by time). Direct observation shows the PCI (between rows 1–1200, columns 0–1200) is more concentrated. This shows that direct citation provides better evaluation for remote patents, but not recent patents (especially for the most recent 200 patents). For PID, the patents are more concentrated within rows 600–1400, columns 0–600, reflecting the indirect relationship have a longer patent citation time lag, due to PID requiring 2-step length links. The PCP and PCO networks are symmetrical networks, however this study requires PCI and PID networks to be combined, therefore we only consider cells of which lower triangular matrix. For PCP, the patents are more concentrated within rows 400–1400 and columns 400–1400, which shows that PCP contains the more recent patent pairs. This is evidenced by (Glänzel and Czerwon 1996): “bibliographic coupling links can provide snapshots of early stages of a specialty’s evolution”. For PCO, the patents are more concentrated within rows 0–1000, columns 0–1000, which shows that PCO contains the earlier, more similar patent pairs.
-
2.
Topological measurement Network topological analysis employs various statistical measures to characterize the topology of the citation networks (Li et al. 2007).
Network size (N, M) and density (\(\Delta\)): network size mainly indicates the number of nodes and number of links. From Table 2, we can observe that PCI, MUCA and CPC contain the maximum number of patents, which explains that three kinds of network have good network representativeness for patent analysis. A good patent evaluation indicator usually shows advantage in representation and time distribution. However, PIDp, PCPp and PCOp only contain 2/3 of the patent numbers, which means that they are not suitable for patent analysis, as many patents and ties have been missed by using PIDp, PCPp and PCOp. The number of nodes shows that PCI, MUCA, and CPC all contain the largest subset of nodes, with 1426 patents. However PIDp, PCPp and PCOp, with PCI reduced by approximately 1/3. MOL has multiple relationships, and SAH is a high strength of correlation network. Therefore, they only contain 1/3 of the PCI network nodes. Observing the SAL network, we find that it contains a large number of ties with low association strength, which increases the risk of errors. Hence, it is necessary to exclude SAL relationships.
Table 2 Topological measures of different citation-based networks Network density: The density of a network is directly related to its numbers of nodes and links: it corresponds to the ratio of the numbers of existing to possible links. The latter is derived by considering a fully connected network contains the same number of nodes. \(\Delta = \frac{\text{M}}{{{\text{N(N}} - 1 )}}\). Overall, the maximum network density among all types of networks is 0.006, which means that the optical disk citation network is a sparse network. The density of the four types of basic citation network can be sorted as (PCOp > PCPp > PIDp > PCI); the order of four networks divided by filtering standards is (MOL > SAL > SAH > SRL); and the PCI (0.0012) and CPC (0.0018) have similar network densities.
Average path length, L: the average value of the shortest path length between any pair of nodes in the network. A short average path length means that technology will move to different parts of the graph more quickly. \(\text{L} = \frac{1}{{\frac{1}{2}N\left( {N + 1} \right)}}\sum {_{i \ge j} d_{ij} }\). Average path length can be used as a criterion to judge the extent of the closeness of patent pairs between different networks. A high L value shows a low probability of network knowledge flow among the patent pairs, while conversely a low L value shows a high probability of network knowledge flow. The MOL has the lowest value for L, which shows that the MOL is a dense network and the patent pairs are dependent.
Clustering coefficient, C: a network’s clustering coefficient is the average of each node’s clustering coefficient. A node’s clustering coefficient is the ratio of the number of edges between the node’s neighbors to the number of possible edges between those neighbors. \({\text{C}}_{i} = \frac{{2E_{i} }}{{k_{i} \left( {k_{i} - 1} \right)}} = \frac{1}{{k_{i} \left( {k_{i} - 1} \right)}}\sum {_{j,k = 1}^{N} a_{ij} a_{jk} a_{ki} }\). Compared with a CPC network of the same size, this CPC network has a high clustering coefficient. This is because of the fact that CPC integrates the explicit citations (from PCI) and implicit citations (from PIDp, PCPp and PCOp) into a more compact citation network.
In summary, compared with the PCI network, the CPC network has significant advantages in density, average path length and clustering coefficient by integrating the multi types of citation relations.
-
3.
Degree distribution Table 3 shows the descriptive statistics of patent number and indegree of the different patent citation networks.
Table 3 Indegree descriptive statistics of different citation-based networks The indegree distribution shows the probability distribution of the number of citations that one patent may receive. In the log–log graph, the two degree distributions show a straight line pattern, which means that they also follow the power law distribution. But when observing in detail, we find that the CPC network has the better goodness of fit (the higher R2 and the lower SSE) under the log–log coordinates; the PCI network presents a strong tail-swaying phenomenon, reflecting the instability of that network. In contrast, the CPC network exhibits more steadiness in the convergence of tail. The power law distribution takes the form of \(P\left( k \right) \sim k^{ - \gamma }\), where P(k) is the probability that a patent has exactly k links. The power law exponent γ and correlation coefficient r of the two degree distributions are shown in Table 4.
Table 4 Indegree distribution comparison of the PCI and CPC networks

Citation lag
The evaluation effects of citations are highly related in terms of time. For a better understanding of citation evaluation effects from the point of view of timeliness, the citation lag is calculated. There are two ways to look at citation lag: backwards and forwards (Hall et al. 2001). Because backward citation lags can reflect technologies dependent on prior art, this paper uses backward citation lags to discover the aging characteristics of the CPC network. The backward lags focus on the time difference between the application or grant year of the citing patent and that of the cited patents. We can observe in Table 5 that the average citation lag of the PCI network is 45.88 months, meaning that on average, it takes an issued patent 45.88 months to be cited as a reference. The citation lag of the PIDp network is 68.34 months, which means that establishing the indirect relationship of a patent pair requires more time, and the establishing relationships between patent pairs of the PCPp and PCOp networks required nearly 20 months. The average citation lag of the CPC network is 39.48 months, 7 months less than the PCI network. The shrink of the citation lag represents that the CPC network is more suitable for evaluating recent patent Fig. 3.

Indegree distribution comparison of the PCI and CPC networks
Graphic features
The above node degree based measures already assist us in understanding the some basic topological features of networks, however, some other structural features cannot simply be identified by the above node degree based measures, such as interconnectivity of nodes in a graph. So it is necessary to observe in detail with the help of high-order topological indicators (assortative coefficients) and graphic features in order to understand the overall structural features of networks (Newman 2001). Figure 4 clearly shows the structural features of the different citation-based networks. In the map of PCI, there is a clear division of the patents into two clusters, a core cluster is located in the center of the map and a peripheral cluster scattered around the core cluster. The core cluster and the peripheral clusters are almost completely separated from each other. However, it seems that the peripheral cluster is densely collected and cannot be divided. In the map of PCPp, PCOp, there is a clear boundary between several clusters, and the situation of the dispersed clusters accords with the multistage history of optical disk development. The optical disk technology branch shows the trend of development, no single branch can play in the entire technology network globally, and the whole network should present a diversified technological trend.

Comparison of graphic features of multiple citation-based networks
In the map of MUCA, which is an aggregation of multiple citation relationships, the amount of patent information is too large to identify the structural features of the graph. From the structural perspective, a network too dense and or too sparse, which can justified by assortative coefficient, is no good for unveiling the structural features and is not suitable for evaluation. A network with an excessively high assortative coefficient would conceal the diversity of technological innovation, underestimating the impact of the new generation of technologies; a network with an excessively low assortative coefficient shows that the fragmentation of the network is not conducive to the dissemination of knowledge. The assortative coefficient of CPC is 0.4811, does not show an excessive centralized preference, and indicates that the whole network consists of 5 clusters with good distinction, with every cluster representing a branch of optical disk development.
Measurement verification
In order to compare the patent valuation effect of the PCI network and the CPC network, patent family (triadic) and patent maintenance indicators of the optical disk dataset are used to evaluate the scope and precision of the PCI network and the CPC network. The purpose of establishing a triadic patent family indicator is to develop statistics that would improve the quality and international comparability of the technology output indicator (Dernis and Khan 2004), and this indicator tends to reflect the current and potential patents’ technological value at the patent filing phrase. Previous literature has confirmed that there are connections between the value of patent protection and the value of patented ideas (Lanjouw et al. 1998), and patent duration tends to reflect a patent’s technological value during the post-granting phases, so we chose these variables as the proxies for patent valuation to test for the effects of different patent citation indicators.
A patent family is defined as a set of patents taken in various countries to protect a same invention, i.e. related patents are regrouped into a single record to derive a unique patent family. In this paper, we select the OECD “Triadic” Patent Families (TPF) dataset as one of the proxies for patent evaluation (Dernis and Khan 2004). This dataset consists of a set of patents filed granted by the European Patent Office (EPO), the Japan Patent Office (JPO) and the United States Patent and Trademark Office (USPTO) that share one or more priority applications. The second proxy of patent valuation selected is the U.S. Patent Grant Maintenance fees dataset (USPTO 2013). These two indicators separately reflect the renewal and the geographical scope of patents, and both are proxies frequently used for patent evaluation.
Empirical test for TPF
In comparison with traditional indicators based on patent filings with a single patent office, the triadic patent families cover a homogeneous set of inventions as the most important inventions deemed to be protected by a patent by the EPO, JPO and USPTO. Therefore, one patent with a triadic patent family reflects current and potential technological value. This paper takes the OECD Triadic Patent Families (TPF) dataset as its patent family data source, retrieving 1426 optical disk technology patents containing 425 patents with TPF from the TPF database.
Comparison of TPF Coverage
From the TPF coverage, there are 894 patents with indegrees (citation frequencies >1) containing 283 TPF patents at the PCI network. After constructing the CPC network by aggregating the PCI network with the links of the artificial networks that have strong link strength, the patent number of the CPC network with at least 1 indegree is raised to 986, and the number of TPF patents contained also rises, reaching 315. The number of total TPF patents grows from 66 to 74 % after taking the artificial networks into account.
Comparison of Logistic Regression
Logistic regression is useful when predicting a binary outcome from a set of continuous predictor variables. Our approach is to test whether the indegree distributional differences between the PCI network and the CPC network make a significant contribution to the triadic patent family. To do this, we estimate the following model:
where Y i is equal to 1 if the patent X i has a triadic patent family, and 0 if the patent X i has no triadic patent family. X i is the indegree of the patent, which can come from the PCI network or the CPC network; ɛ i is the intercept of the function. In the logistic regression, the indegree of patents in the PCI network or the CPC network is regarded as the predictor variable, and the existence of a triadic patent family (a dichotomous variable) is regarded as the response variable, which is the proxy of indication of patent value Table 6.
From the logistic regression results in Table 7, the first thing we see is the p value for the regression coefficients; the CPC indicator is positive and significant (0.0164*), but the PCI indicator is not statistically significant (0.0675). As such, the CPC indicator makes a significant contribution to the equation. Then we take a step further to compare the goodness of fit of both models using the AIC (Akaike information criterion), which is a measure of goodness of fit that takes the number of fitted parameters into account. The PCI model has an AIC of 1236.1, while the AIC of the CPC model drops to 1233.7, indicating an increase in model fit of the CPC model. These regression comparisons suggest a statistically and qualitatively significant relationship between the CPC indicator and whether a patent has a triadic patent family, providing information on whether a patent has a triadic patent family above and beyond what we can infer from the PCI indicator. These results are consistent with Yoon’s comments (Yoon and Park 2004). The scope of analysis and the richness of potential information are limited because citation indicators take only counts of citations into account, ignoring the internal relationship between patents; in terms of triadic patent families, the PCI indicator is insufficient.
TPF range comparison of high indegree patents
In the PCI network, the indegree represents the number of times a patent is cited by other patents, and equates to the bibliometric concept of “citation frequency”, but no corresponding bibliometric concept exists in the CPC network, so the article selects the indegree of different networks as indicators of comparison.
During the process of patent evaluation, it is usually assumed that patents with high indegree are more important, and then those important patents are filtered out by setting a threshold in order to identify patents with high value. Therefore, the key to determining a patent evaluation method lies in whether the high indegree patents obtained by the new network method show good representativeness. As shown in Table 7, there are 39 patents with TPF in the top 11 % of the PCI network ranked by indegree distribution, and there are 43 patents with TPF in the top 10 % patents of the CPC network. When the ranking expanded to the top 20 %, it still maintained a similar ratio in both networks. It is clear that a high indegree in the CPC network contains broader TPF coverage than the PCI network. As a result, the CPC network has an advantage in patent evaluation over the PCI network within the TPF Table 8.
Empirical test for MFE
Generally, patents represent the legal right to exclude others from claiming the rights to an innovation. If patentees want to maintain this protection, they must pay periodic renewal fees in order to keep their patents in force. The renewal data directly reflects the incentives underlying the application and renewal processes. This explains that the more valuable an invention, the longer its patent will remain active. Therefore, we can use the renewal data to evaluate the value of patents. This paper takes the U.S. Patent Grant Maintenance Fee Events File (MFE) as the source of patent renewal data. We collected data from the MFE and compared it with the original optical disk technology patent data, and as a result there are 1426 patents. In the USPTO there are three patent maintenance fees that are required during the life of patent in order to maintain the validity of that patent. These fees are due at 3½, 7½ and 11½ years from the patent’s granting, and this is used to identify the patent renewal term. The paper assumes that a patent is worth paying the renewal fees for at 7½ and 11½ years from when the patent is granted (Lanjouw et al. 1998) Table 9.
Comparison of MFE Coverage
Looking at duration of patent renewal, the whole MFE data of optical disk patents have 833 patents with 3½ years, including 483 patents with 7½ years and 110 patents with 11½ years. The PCI network has 371 patents with 3½ years, and has 414 patents with 7½ years, and 109 patents with 11½ years. The CPC network has advantage in patent duration on 7½ years, which means that the CPC network has broader range at the longer renewal patent level.
MFE range comparison of high indegree patents
The author takes MFE data as a proxy of patent valuation in order to check the measure effect of the different network. Due to there being no existing fair and equitable standard for verification of patent evaluation, this paper takes MFE data as a proxy for patent valuation, as MFE data reflect patents’ temporal scope of protection are correlated to the R&D cost of products.
It is generally recognized that a highly cited patent is more important, so researchers take it for granted that a patent with higher indegree of the PCI network should have a longer duration. However, by comparison as per Table 10, we have found that the results do not conform to this assumption. We can learn from Table 10 that the top high-indegree patents in the CPC network (indegree interval is 9–53) accounted for 10.24 %, covering 93 long-term renewal patents (7½ and 11½ years); in contrast, the top high-indegree patents in the PCI network only cover 15 long-term renewal patents (7½ and 11½ years). The top 20 % high-indegree patents of the PCI network cover only 7 % of long-term renewal patents, while the top 19 % high-indegree patents of the CPC network cover 27 % of long-term renewal patents. Thus the CPC network shows a fourfold increase over the PCI network in precision of predicting which patents have a longer duration. Hence single citation analyses are insufficient for revealing patent value.
Overall, our findings on MFE data are mixed. From comparison of MFE coverage, there appears to be no difference between the two networks. However, when we give an insight into the specific indegree interval, the response to renewal term of the CPC model seems to be more sensitive than that of the PCI model. One possible explanation for these findings is that CPC integrates the explicit and implicit knowledge flows into a more compact citation network, so that the indegree of the CPC model can be more responsive to the renewal term of patents. In fact, sensitivity of the model might be more important when the volume of data is large.
Conclusions and limitations
In this paper, four single patent citation networks—direct citation, indirect citation, coupling and co-citation networks—were combined, filtered and recomposed by relational algebra, and then a method based on the comprehensive patent citation (CPC) network for patent evaluation was proposed. Empirical research into optical disk technology related patents was carried out according to this method, showing that the CPC network maintains the advantages of direct citation, which shows better performance in topological structure, graphic features, centrality distribution and citation time lag. According to these descriptive statistics, we find that the approach of comprehensive patent citation can go well beyond simple patent counts and traditional citation analysis as a means to reveal information on the complex, interrelated and cumulative processes of patent technological value, pointing to the specific citation based information reflect different aspects of patent value, and single citation analyses are insufficient for revealing the patent value.
The results confirm that the number of citations a patent application receives in subsequent patent applications is strongly associated with the technological value of the patent (Harhoff et al. 1999; Trajtenberg 1990). Firstly, we examined the topological properties and degree distribution of the PCI network and the CPC network. The measures for citation networks display the non-uniformity feature of citation. The results are concordant with those of Li et al. (2007). Then we rechecked the issue of “citation lag,” as proposed by Hall et al. (2001), by comparing sparse matrix figures and citation lag statistics of different networks. The average citation lag is very long, which undermines the timeliness and reliability of patent value evaluation. We also validated the issue of “missing links,” proposed by Chen et al. (2011) and by Wilson (1995), by comparing the coverages of two patent quality indicators. The above examinations reinforce the idea of incorporating the multiplex citation network to fill the gaps left by the single patent citation network.
Futhermore, we find that the indegree coefficient significance of the CPC network has a slight advantage over that of the PCI network, and that the indegree of the CPC model can be more responsive to the renewal term of patents. In fact, sensitivity of the model might be more important than goodness of fit of full samples when the volume of data is large. This finding shows that links missed out of the patent direct citation network may contain some important information, and it is necessary to improve the current direct citation analysis approach. By using the approach of establishing the CPC network as described in this paper, patent citation analysis can be applied more appropriately to the future research.
There are many directions with regard to the CPC network that could be developed further. In this paper, the author only compared the characteristics of the CPC network with the PCI network, and not other networks mentioned above (i.e. PIDp, PCPp and PCOp); more detailed comparisons need to be studied in depth, followed up by understanding the whole citation network. Furthermore, in terms of selection of citation data, family-level patent citation may be more suitable for patent technological valuation. However, due to the USCITES dataset not providing family-level citation data, it is difficult for this study to adopt family-level citation data to improve the model. In the future, we will take a step further to test for family-level citations using a more complete dataset. Meanwhile, all matrix transformation, processing, and integration in the paper is based on binary matrixes, ignoring the weight features of different types of network, which also may cause imprecision in patent evaluation. These issues need to be studied in depth.
References
Alcácer, J., & Gittelman, M. (2006). Patent citations as a measure of knowledge flows: The influence of examiner citations. Review of Economics and Statistics, 88(4), 774–779.
Alcácer, J., Gittelman, M., & Sampat, B. (2009). Applicant and examiner citations in U.S. patents: An overview and analysis. Research Policy, 38(2), 415–427.
Atallah, G., & Rodríguez, G. (2006). Indirect patent citations. Scientometrics, 67(3), 437–465.
Borgatti, S. P., Everett, M. G., & Freeman, L. C. (2002). Ucinet for Windows: Software for social network analysis. Harvard, MA: Analytic Technologies.
Boyack, K. W., & Klavans, R. (2010). Co-citation analysis, bibliographic coupling, and direct citation: Which citation approach represents the research front most accurately? Journal of the American Society for Information Science and Technology, 61(12), 2389–2404.
Braam, R. R., Moed, H. F., & van Raan, A. F. J. (1991). Mapping of science by combined co-citation and word analysis. I. Structural aspects. Journal of the American Society for Information Science, 42, 233–266.
Breschi, S., & Lissoni, F. (2005). Knowledge networks from patent data: Methodological issues and research targets (613-643), Handbook of quantitative science and technology research. Netherlands: Springer.
Chen, D., Huang, M., Hsieh, H., & Lin, C. (2011). Identifying missing relevant patent citation links by using bibliographic coupling in LED illuminating technology. Journal of Informetrics, 5(3), 400–412.
de la Potterie, B. V., & van Zeebroeck, N. (2008). A brief history of space and time: The scope-year index as a patent value indicator based on families and renewals. Scientometrics, 75(2), 319–338.
De Nooy, W., Mrvar, A., & Batagelj, V. (2011). Exploratory social network analysis with Pajek (Vol. 27). London UK: Cambridge University Press.
Dernis, H., & Khan, M. (2004). Triadic patent families methodology. In: OECD Science, Technology and Industry Working Papers.
Emmanuel, D., & Megan, M. (2005). How well do patent citations measure flows of technology? Evidence from French innovation surveys. Economics of Innovation and New Technology, 14(5), 375–393.
Garfield, E. (1966). Patent citation indexing and notions of novelty similarity and relevance. Journal of Chemical Documentation, 6(2), 536–542.
Glänzel, W. (2012). Bibliometric methods for detecting and analysing emerging research topics. El Profesional de la Informacion, 2(21), 194–201.
Glänzel, W., & Czerwon, H. J. (1996). A new methodological approach to bibliographic coupling and its application to the national, regional and institutional level. Scientometrics, 37(2), 195–221.
Griliches, Z. (1990). Patent statistics as economic indicators: A survey. Journal of Economic Literature, 28(4), 1661–1707.
Hall, B. H., Jaffe, A. B., & Trajtenberg, M. (2001). The NBER patent citation data file: Lessons, insights and methodological tools (No. w8498). National Bureau of Economic Research.
Hall, B. H., Jaffe, A., & Trajtenberg, M. (2005). Market value and patent citations. RAND Journal of Economics, 36(1), 16–38.
Harhoff, D., Narin, F., Scherer, F. M., & Vopel, K. (1999). Citation frequency and the value of patented inventions. The Review of Economics and Statistics, 81(3), 511–515.
Harhoff, D., Scherer, F. M., & Vopel, K. (2003). Citations, family size, opposition and the value of patent rights. Research Policy, 32(8), 1343–1363.
Huang, M., Chen, D., & Dong, H. (2011). Identify technology main paths by adding missing citations using bibliographic coupling and co-citation methods in photovoltaics. Paper presented at the Technology Management in the Energy Smart World (PICMET), 2011 Proceedings of PICMET’11.
Kessler, M. M. (1963). Bibliographic coupling between scientific papers. American Documentation, 14(1), 10–25.
Lanjouw, J. O., Pakes, A., & Putnam, J. (1998). How to count patents and value intellectual property: The uses of patent renewal and application data. The Journal of Industrial Economics, 46(4), 405–432.
Lanjouw, J. O., & Schankerman, M. (2004). Patent quality and research productivity: Measuring innovation with multiple indicators*. The Economic Journal, 114(495), 441–465.
Li, X., Chen, H., Huang, Z., & Roco, M. C. (2007). Patent citation network in nanotechnology (1976-2004). Journal of Nanoparticle Research, 9(3), 337–352.
Liu, X., Yu, S., Janssens, F., Glänzel, W., Moreau, Y., & De Moor, B. (2010). Weighted hybrid clustering by combining text mining and bibliometrics on a large-scale journal database. Journal of the American Society for Information Science and Technology, 61(6), 1105–1119.
Meyer, M. (2000). What is special about patent citations? differences between scientific and patent citations. Scientometrics, 49(1), 93–123.
Narin, F., Noma, E., & Perry, R. (1987). Patents as indicators of corporate technological strength. Research Policy, 16(2–4), 143–155.
Newman, M. E. J. (2001). Clustering and preferential attachment in growing networks. Physical Review E, 64(2), 25102.
Newman, M. (2010). Networks: An introduction. Oxford: Oxford University Press.
OECD. (2009). OECD Patent Statistics Manual. Paris: Organisation for Economic Co-operation and Development.
Pavitt, K. (1988). Uses and abuses of patent statistics. In A. F. J. van Raan (Ed.), Handbook of quantitative studies of science and technology (pp. 509–536). Amsterdam: Elsevier.
Pitkethly, R. (1997). The valuation of patents: A review of patent valuation methods with consideration of option based methods and the potential for further research. Paper presented at the Judge Institute Working Paper, http://users.ox.ac.uk/~mast0140/EJWP0599.
Reitzig, M. (2003). What determines patent value?: Insights from the semiconductor industry. Research Policy, 32(1), 13–26.
Sampat, B. (2011, 2011-08-30). USPTO patent and citation data, 2013, from http://thedata.harvard.edu/dvn/dv/boffindata/faces/study/StudyPage.xhtml?globalId=hdl:1902.1/16412.
Schmookler, J. (1966). Invention and economic growth. US: Harvard University Press.
Schumpeter, J. A. (1939). Business cycles (Vol. 1). London UK: Cambridge University Press.
Sherry, E. F., & Teece, D. J. (2004). Royalties, evolving patent rights, and the value of innovation. Research Policy, 33(2), 179–191.
Shibata, N., Kajikawa, Y., Takeda, Y., & Matsushima, K. (2008). Detecting emerging research fronts based on topological measures in citation networks of scientific publications. Technovation, 28(11), 758–775.
Small, H. (1973). Co-citation in the scientific literature: A new measure of the relationship between two documents. Journal of the American Society for Information Science, 24(4), 265–269.
Small, H. (1997). Update on science mapping: Creating large document spaces. Scientometrics, 38(2), 275–293.
Trajtenberg, M. (1990). A penny for your quotes—patent citations and the value of innovations. Rand Journal of Economics, 21(1), 172–187.
USPTO. (2013). U.S. patent grant maintenance fee events file 2013/08/06, from http://www.google.com/googlebooks/uspto-patents-maintenance-fees.html.
Vinkler, P. (1998). Comparative investigation of frequency and strength of motives toward referencing. The reference threshold model. Scientometrics, 43(1), 107–127.
von Wartburg, I., Teichert, T., & Rost, K. (2005). Inventive progress measured by multi-stage patent citation analysis. Research Policy, 34(10), 1591–1607.
Walker, R. D. (1995). Patents as scientific and technical literature. Scarecrow Press.
Wasserman, S., & Faust, K. (1994). Social network analysis: Methods and applications. London UK: Cambridge University Press.
Webb, C., Dernis, H., Harhoff, D., & Hoisl, K. (2005). Analysing European and International Patent Citations. OECD Science, Technology and Industry Working Papers.
Wilson, P. (1995). Unused relevant information in research and development. Journal of the American Society for Information Science, 46(1), 45–51.
Xiaofan, W., Xiang, L., & Guanrong, C. (2012). Network Science: An Introduction. Beijing: Higher Education Press.
Yan, E., & Ding, Y. (2012). Scholarly network similarities: How bibliographic coupling networks, citation networks, cocitation networks, topical networks, coauthorship networks, and coword networks relate to each other. Journal of the American Society for Information Science and Technology, 63(7), 1313–1326.
Yoon, B., & Park, Y. (2004). A text-mining-based patent network: Analytical tool for high-technology trend. Journal of High Technology Management Research, 15(1), 37–50.
Zitt, M., & Bassecoulard, E. (1994). Development of a method for detection and trend analysis of research fronts built by lexical or cocitation analysis. Scientometrics, 30(1), 333–351.
Acknowledgments
We are indebted to Mao Jin for helpful discussions and several constructive proposals. This research is supported by National Natural Science Foundations of China (NSFC Grant Nos. 71273196; 71403256 and 71303023), and this research was also supported by National Key Technology R&D Program of China (Grant No. 2013BAH21B00).
Author information
Authors and Affiliations
Corresponding author
Rights and permissions
About this article

Cite this article
Yang, GC., Li, G., Li, CY. et al. Using the comprehensive patent citation network (CPC) to evaluate patent value. Scientometrics 105, 1319–1346 (2015). https://doi.org/10.1007/s11192-015-1763-7
Received:
Published:
Issue Date:
DOI: https://doi.org/10.1007/s11192-015-1763-7