
Abstract
Reading strategy instruction has been an important area in educational psychology for decades, however, research has primarily focused on its influence on learning outcomes rather than learning processes; reading pure texts rather than illustrated texts; and immediate effect rather than retention effect. This study used an eye-tracker to investigate the immediate and delayed effects of text–diagram reading instruction on reading comprehension and learning processes in illustrated text reading. Fourth-grade students with high (N = 66) and low reading ability (N = 66) were randomly assigned to one of three groups: a text–diagram group who received text–diagram instruction which emphasized diagram decoding and integration of relevant textual and pictorial information, a placebo group who received instruction which emphasized comprehension monitoring, and a control group which received no reading instruction. All participants read four illustrated science texts for a baseline check, instructional example, immediate testing, and delayed testing. The results showed that the effect of text–diagram instruction was more evident in the immediate test than the delayed test. The eye-movement pattern showed that the students who received text–diagram reading instruction spent significantly more reading time on illustrations, made more integrative transitions between text and illustrations, and spent a higher proportion of total reading time on illustrations in immediate and delayed reading situations than the other groups. Overall, this study developed an effective text–diagram instruction method to promote reading comprehension, identified the reading processes underlying the effect of text–diagram strategy instruction, and depicted the changing appearances of reading instruction intervention over time.
Introduction
Many children require instructions to develop good reading skills (Cain, Oakhill, & Lemmon, 2004). Substantial evidence indicates that reading strategies aid reading comprehension, helping children to read by training their adaptation to timing demands of novel knowledge (Cain, Oakhill, Barnes, & Bryant, 2001; Clark, Schoepf, & Hatch, 2018; Förster, Kawohl, & Souvignier, 2018; Reed & Lynn, 2016). Further, empirical studies use solely text-based materials, although most informative texts (e.g., scientific articles) include words and pictures. Numerous previous studies on text-based reading have indicated that performance improves when articles have text and pictures (Ainsworth, 2006; Butcher, 2014). This was dubbed the multimedia effect (Mayer, 2009). However, many children do not know how to integrate text and illustrations (Jian, 2019; Jian & Ko, 2017; Hannus & Hyönä, 1999; Mason, Tornatora, & Pluchino, 2013), and do not appear to benefit from the addition of diagrams to scientific articles without prior scientific literacy (Reid & Beveridge, 1986). Thus, children need tuition focused on decoding diagrams and linking relevant information in texts and diagrams.
Scheiter, Schubert, Gerjets, and Stalbovs (2015) found that teaching ninth-grade students to decode diagrams and link text–diagrams did not improve reading comprehension. However, some studies have found that text–diagram instruction improves the reading comprehension of fourth and sixth-grade students regardless of ability (Jian, 2018a, 2019). The reading instructions developed for all of these studies was based on the cognitive theory of multimedia learning (CTML) (Mayer, 2009), and emphasized the importance of reading diagrams and integrating relevant information between texts and diagrams. Notwithstanding, scientific evidence has met with mixed response and there is merit in further study on the influence of text–diagram instruction on reading comprehension. In sum, previous empirical research has investigated the influence of text–diagram instruction on reading comprehension through learning outcomes (Jian, 2018a; Scheiter et al., 2015) but has rarely focused on reading processes and real-time processing behavior. Eye-tracking technology is well-suited to examine reading processes (Kim, Vorstius, & Radach, 2018; Rayner, 1998) based on the eye-mind assumption (Just & Carpenter, 1980) that posits that the area where a reader’s eyes fixate is where information is likely to actively be processed.
Besides, understanding the short- and long-term effects of reading instruction on reading comprehension is also important (Förster et al., 2018), as we need to know how reading strategies are used post-acquisition to check if they were retained. Thus, this study uses immediate and delayed tests to investigate text–diagram instruction effects on reading comprehension, the learning processes underlying illustrated text reading, and changes in processes from immediate to delayed reading situations.
Theoretical Frames and Challenges in Learning Illustrated Texts
This study was grounded in the CTML (Mayer, 2009), a well-established theoretical framework used to develop empirical studies (Jian, 2018a; Mason, Pluchino, & Tornatora, 2013; Schüler, 2017) or design instructional interventions for text–diagram integration (Jian, 2019; Renkl & Scheiter, 2017; Scheiter et al., 2015). The CTML represents the information-processing system that underlies learning of multimedia materials (e.g., illustrated texts). It is based on cognitive demands—that is, selection, organization, and integration of the representations iteratively to the learner’s mind. Comprehension of an illustrated text requires readers to first identify the most salient pieces of information within each set of words and diagrams; then, group these pieces together into larger propositions; and finally integrate propositions and readers’ prior knowledge to establish a coherent mental model.
Adding multiple representations in the texts adds new comprehension challenges, especially for young readers. Readers must have good representational competence and apply multiple literacy skills to process these texts (cf. review paper, Guo, Zhang, Wright, & McTigue, 2020). Representational competence refers to a set of skills for the recognition, interpretation, transformation, and coordination of external representations used in texts (Kozma, 2003). It may not be easy for young readers whose reading and cognitive abilities are still developing to try to meet such cognitive demands (Coleman, McTigue, & Dantzler, 2018; Renkl & Scheiter, 2017). Eye-tracking studies have shown that children’s attention is focused on text sections as opposed to diagrams during illustrated text reading, and children seldom integrate the relevant information from illustrations and texts (Jian, 2018a; Hannus & Hyönä, 1999). One potential explanation for this phenomenon is that children’s cognitive capacity is underdeveloped and only pays attention to limited information over brief time periods.
Although many studies (Jian & Wu, 2015; Eitel, 2016; Johnson & Mayer, 2012; Schüler, 2017) using undergraduates as participants confirmed the theory of CTML (Mayer, 2009), the findings were less conclusive if CTML was extended to non-adult readers. McTigue (2009) explored the question of whether CTML applied to middle-school students. She asked sixth-grade students to read two science texts with either no illustrations (control), illustrations of the cycle with labels for each part (parts), illustrations of the cycle with labels for each major process (steps), or illustrations showing the labels for each part and each major process (parts and steps). The results showed that the students did not benefit from diagrams for both the texts, and did not replicate the findings of studies with adult readers as participants.
Promoting reading comprehension of illustrated texts
Strategic prompts and strategy training are major interventions that promote illustrated text comprehension (Renkl & Scheiter, 2017; Van Meter, Cameron, & Waters, 2017). Strategic prompts are process-oriented and involve deployment of prompts throughout experimentation. Self-explanation prompts are frequently studied regarding illustrated text reading (Van Meter et al., 2017), and usually require answering “why” questions (Berthold, Eysink, & Renkl, 2009) or explaining a specific relationship (van der Meij & de Jong, 2011; Van Meter et al., 2017).
Bartholomé and Bromme (2009) prompted their undergraduate students by presenting written instructions for processing text and pictures for five minutes during the learning phase. Unexpectedly, it did not improve reading comprehension. Bartholomé and Bromme argued that conflicts between the prompt approach and learners’ original strategies caused this, as their resolution consumes cognitive resources and impedes learning. This was regarded as speculative because no process data were collected. Moreover, the duration of this intervention was too short to demonstrate whether these effects may be based on an alternative explanation. Following up on this, the present study used an eye-tracker to record learners’ reading processes.
As for strategy training, it is preparatory-oriented, and involves teaching reading strategies prior to experimentation, denoting that if students acquire effective reading strategies anticipatedly they could read independently. Unlike text–only reading strategies, strategies for illustrated text have been developed only in few studies (Jian, 2018a; Scheiter et al., 2015). Based on CTML (Mayer, 2009) and many empirical studies (e.g., using self-explanations to learn illustrated content, Schlag & Ploetzner, 2011; how to read a diagram, Eitel, Scheiter, & Schüler, 2013; and shifting attention from text to diagrams, Hegarty & Just, 1993), Scheiter et al. (2015) developed a seven-step strategy for illustrated text reading comprehension. Initially, the experimental group received text–diagram reading strategies, and the control group received a placebo training involving the same amount of cognitive engagement. The ninth-grade students subsequently read an illustrated biology article and completed a test. Unexpectedly, no effect was observed regarding the taught strategies, and the reasons were hypothesized: first, maybe the provided practice time was inadequate to acquire a new strategy; second, students may have had prior reading habits that were difficult to alter, and the study was brief. Thus, they may have read the experimental material only based on prior strategies. Unfortunately, this could not be confirmed, as the study did not measure any online processing data. Thus, our study sought to address this question by using eye-tracking to record online reading behavior pre- and post-reading instruction.
Alternatively, the findings of Scheiter et al. (2015) could be interpreted as evidence that the nine-step reading strategy exceeds the upper limit of human working memory, which suggests that learning all these steps in such a short time may be too demanding. In a simplified model, a recent study (Jian, 2018a) developed a three-step text–diagram strategy where relevant information in the text and diagrams was identified and integrated into a coherent mental model. This helped to improve fourth-grade students’ reading comprehension regardless of reading ability.
Overall, strategic prompts and strategy training emphasize the need to guide readers to connect relevant text and pictures. However, the effects of strategic interventions using prompts and instructions on the comprehension of illustrated text remain unclear. This may be attributed to age, number of reading strategy steps, and intervention duration, all of which are considered in the present study.
Eye movement research on how text–diagram instruction changes reading processes
So far, only two studies (Jian, 2018b, 2019) seem to have applied eye-tracking technology to investigate the influence of text–diagram instruction on reading processes. Jian (2018b) investigated whether reading instruction influences learning outcomes and the cognitive processes involved in reading illustrated scientific texts. Investigations showed that the instruction group had better reading comprehension, spent twice the time reading the illustrations, made more saccades between text and illustration than the control group, and their eye movements were also different.
Jian (2019) investigated the effectiveness of reading processes using the signaling principle. This involves highlighting relevant elements of text and illustrations with signals, to improve learning outcomes (Van Gog, 2014), for sixth-grade students with or without text–diagram reading instruction. It showed that the signaling principle (Richter, Schieter, & Eitel, 2016; Van Gog, 2014) could not be extended to children without reading instruction. However, when they received reading instructions and learned the signaling principle, the teaching group had better test performance, different eye movement patterns, and made more saccades between text–diagram than the label group. Further, approximately 80% of the teaching group looked at the corresponding illustrations when they read the words “Diagram 1” and “Diagram 2,” whereas less than 50% did so in the label group.
These studies show that text–diagram reading instruction influences not only learning outcomes but also reading processes. However, three reasons to conduct an additional study persist. First, only the immediate effects of these reading instructions were measured, and delayed effects were left unattended. In immediate testing, learners rely on more superficial representations of the materials, whereas delayed testing relies on mental models (Arndt, Schüler, & Scheiter, 2015). Second, the control groups did not receive any instruction, so the results could not totally exclude a possible placebo effect. Therefore, this study added a placebo group that received reading instruction but not text–diagram integration. Third, a one-page article of 400 words and two illustrations were used as reading materials. This study investigated whether the effect of text–diagram instruction could be replicated on longer articles of 2–3 pages, over 700 words and 4–5 illustrations.
Present study and research hypotheses
The present study used an eye-tracker to investigate the immediate and delayed effects of text–diagram reading instruction on reading comprehension and learning processes for illustrated text reading, and whether these effects were moderated by reading ability. To determine reading instruction effects on the comprehension of illustrated texts, the text–diagram strategies developed for the experimental group in this study were based on CTML (Mayer, 2009) and prior empirical studies (Schüler, 2017; Scheiter & Eite, 2015). They also highlighted the instructions of selecting/organizing/integrating text–diagram elements and decoding diagram information. Moreover, some principles of general reading instruction were applied, such as including an adequate intervention time; introducing teacher modeling; providing students with a new article to apply the learned strategy; and providing reminders for participants to use the instructed strategies when reading the experimental material (Bartholomé & Bromme, 2009; Scheiter et al., 2015).
There were three research questions in this study: The first research question was whether text–diagram reading instruction had a positive effect on reading comprehension. Corroborating with earlier findings (Jian, 2018a), it was expected that reading comprehension performance would be better in the text–diagram instruction group compared to the other groups on the immediate test (Hypothesis 1a); and the effect on the immediate test was expected to be more pronounced than on the delayed test (Hypothesis 1b), due to previous research showing that the effect of reading instruction was more evident on the immediate test than on the delayed test (Manoli, Papadopoulou, & Metallidou, 2016; Torgesen et al., 2001).
The second research question was whether text–diagram reading instruction affected reading processes. Based on the design suggested by CTML (Mayer, 2009), the text–diagram group received reading instruction for decoding diagrams and integrating relevant text–diagram information. This group was expected to have longer eye-tracking fixation durations on scientific illustrations, more saccades between text–diagram, and spend a higher total-time proportion paying attention to scientific illustrations than the other two groups (Hypothesis 2).
The third research question related to the changes in reading processes over time. Participants were tested before, during, immediately after, and 1 month after the intervention. Previous research found that the scores of the immediate tests were higher than the delayed tests, whether for reading research (Manoli et al., 2016; Torgesen et al., 2001) or written proofs in mathematics (Roy, Inglis, & Alcock, 2017). This study predicted that the intervention effect on reading processes would be diminished between the immediate and delayed testing stages (Hypothesis 3). In other words, the reading patterns of the delayed stage would be nearer to those of the original, compared to those revealed before the intervention, in the immediate testing stage.
Methods
Participants and design
In this study, 132 fourth-grade students were recruited with parental consent from an elementary school in Taiwan (Mage = 10.27 years, SD = 0.28 years). Using the standard reading comprehension test (internal consistency reliability was .82, retest reliability was .94) (Ko, 2006), 66 participants were found to have high-reading ability (standard T score above 58, range 58–69, M = 61.5, SD = 3.26) and 66 had a low reading ability (standard T score below 55, range 38–54, M = 49.39, SD = 4.61). The T score was used to distinguish reading ability levels to ensure that there were an equal number of participants between the two groups. The study used a three (reading strategy instruction [text–illustration integration] vs. comprehension monitoring vs. no reading instruction]) × two (reading ability [high vs. low]) between subjects’ design. All high- and low-ability participants were randomly assigned to one of the three groups, totaling 22 participants in each group.
Materials
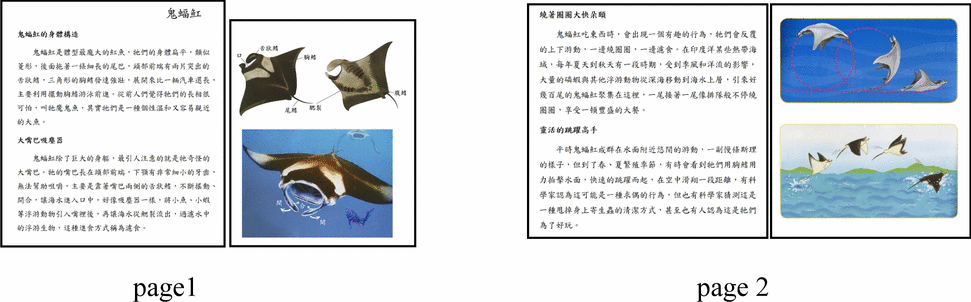
Four illustrated biology texts and four reading comprehension tests were used. The four biology texts introduced the structures and functions of a certain animals as is customary in biology texts (Brandstetter, Sandmann, & Florian, 2017; Cheng & Gilbert, 2014; Kragten et al., 2015). They were modified from scientific magazines (Young Newton, 2015, 2016; Young Scientist, 2015, 2016). The first article described the body structure and functions of a manta ray, the process of filter feeding and explained possible reasons for a manta ray’s behavior when jumping out of the water. This article had 588 words, two pages, and four illustrations (including: the body structure of a manta ray, the mouth of a manta ray and the processes of filter feeding). The first article measured participants’ baseline reading patterns. The second article was designed to provide an example of the reading strategies. It described the body structure and functions of a turtle, explaining why these body characteristics make it swim deep and far, and the reproduction process. This article had 331 words, two pages, and three illustrations (including: the body structure of a turtle, and the reproduction process of mating, laying eggs, and hatching young turtles). The third article measured immediate reading behavior after reading instruction. It described the body structure and functions of a dolphin; the process of suckling; skin structure and its adaptation for swimming and the echolocation system. This article had 772 words, three pages, and five illustrations (including: the body structure of a dolphin, skin structure, changes while swimming, and echolocation). The fourth article measured delayed reading behavior approximately 1 month after receiving instruction. It described the body structure and functions of a mantis, the process of hunting, and how mantises threaten their natural enemies. This article had 707 words, two pages, and four illustrations (including: the body structure of a mantis, and the hunting process).
To assess learning outcomes of the reading materials for three different instruction interventions, tests were created for dolphin and mantis articles. Each article had ten multiple-choice questions and two essay questions.
All materials and tests were assessed for difficulty and readability by three experts—a professor in reading psychology, a Ph.D. candidate in science education who had taught science courses in elementary schools for several years, and a current elementary school science teacher with a master’s degree in science education. Moreover, all multiple-choice questions underwent a pilot study (N = 120) and item analysis (including distractor analysis, item difficulty and discrimination) to ensure items quality in the formal reading tests. The internal consistencies (Cronbach’s alphas) of the articles’ reading tests were .63 (for the dolphin article) and .54 (for the mantis article). The test–retest reliability of the immediate and delayed tests of the dolphin article was .66, p < .001. As for the essay questions in the reading tests, two independent inter-rater agreements were measured using Cohen’s kappa coefficient (.63–.91 for the three reading tests) and inconsistent scores were discussed by raters to reach consensus.
Apparatus
Eye movements were recorded using the Eyelink 1000 (SR Research, Canada) eye-tracker system at a sampling rate of 1000 Hz. A chin-and-forehead rest was used to prevent apparent head movement. The movement of the right eye was tracked. The reading materials and tests were presented on a 24-in computer screen with a resolution of 1920 × 1200 pixels. The participants were asked to place themselves at 65 cm from the monitor and their eyes were leveled horizontally and vertically at 46° and 32°, respectively.
Procedure
Individually, students participated in this study at their elementary school. The experimentation consisted of three stages (Fig. 1). The first stage involved a standardized reading comprehension test (Ko, 2006) to select suitable participants. The second stage began after approximately 2 weeks. It was an eye movement experiment followed by an immediate test. The participants then read an illustrated scientific text and their eye movements were recorded to ensure that the baseline reading behaviors for the three groups were similar. The participants received one of the two reading instructions or no instruction. Then, the participants were told to learn the three reading steps and to apply them to two experimental texts. The participants in all groups had equal training time of 20 min.

The experimental procedure
The text–diagram integration instructions consisted of the following: first, “Take an overall look at the picture and speculate what the article intends to communicate.” Second, “Please read the sentences carefully and find information from the illustrations, then please imagine putting the sentence content into the respective illustrations and observe the illustrations carefully, for example, the shapes, sizes, relative positions, and relationships between components. Then, connect the information between the text and illustrations.” Finally, “Check how well you understand this article by yourself. Please look at the illustrations and recall the text content to test your reading comprehension and memory. If you have something you cannot say or clearly remember, please go back to the specific sentences to reread them.”
The comprehension monitoring instructions consisted of the following: first, “Please read the article and evaluate how much you comprehend. A score of 3 indicates you totally understand, 2 that you partially understand, and 1 that you do not understand the article content. Which score would you give yourself?” Second, “Please find where and what information you cannot understand in the article and try to use the reading strategies that you previously learned to resolve these misunderstandings.” Finally, “Check how well you understand this article by yourself. Please look at the illustrations and recall the text content to test your reading comprehension and memory. If you have something you cannot say or clearly remember, please go back to the specific sentences to reread them.”
The control group instructions consisted of: “I will give you an article to read. After you finish reading, please tell me what information you read in the article.” Then, the experimenter asked two questions: “What information was in the article?” and “What reading strategies did you adopt when your reading comprehension suffered?” In this group, the experimenter did not teach reading strategies to the participants but asked them which strategies they used. The participants were asked these two questions continuously until 20 min had elapsed, as this was equivalent to the time spent by the other two groups with different instructional interventions.
Using the practice scientific article, a research assistant taught participants individually how to use each strategy. Then, participants practiced these strategies using additional sentence(s) in the same article. If participants failed to use any reading strategy, the research assistant provided further instruction until they mastered all strategies.
Then, participants were instructed to use the strategies when reading another illustrated biology text (immediate test). All participants were informed that they would answer questions after reading. Excluding the reading instructions, the control group followed the same procedures, including being informed that they would answer questions after reading. Participants took approximately 60–70 min to complete this intervention.
A month later, there were two tests that were done in the delayed phase. Participants firstly completed the dolphin reading test again (delayed test) and were instructed to read another illustrated biology text without reading instructions to evaluate the retention of acquiring reading strategies and transfer these to the reading of a new learning material. Participants took approximately 30 min to complete the third experimental procedure.
Data selection and measures of eye movements
The effective sample included 113 participants (text–diagram group, n = 38; comprehension monitoring group, n = 39; control group, n = 36), as data from 19 participants were discarded owing to unsuccessful eye-tracker recordings (2), calibrations (7), apparent drift (3), and distractions during the experiment (7). As the second intervention time was longer, some participants (especially low reading ability ones) became distracted during the eye movement experiment. Further, participants who did not read the article completely, pressed the key to end the trial, or had more than one paragraph in the experimental article indicating no eye fixation were excluded.
The areas of interest (AOIs) defined in this study were the texts and pictures in the illustrated scientific text. Several eye movement indicators were used in this study: total fixation duration (i.e., the sum of all fixation durations located in AOIs), where higher total fixation duration reflected greater cognitive effort processing (Just & Carpenter, 1980); the proportion of total fixation durations (i.e., fixation duration in specific AOIs divided by total fixation duration), reflecting attention distribution on specific regions; and the number of saccades between text and illustration (i.e., the total saccades from text to illustration and from illustration to text), reflecting efforts to integrate text with illustration (Mason et al., 2013).
Results
Learning outcomes
To answer the first research question: whether text–diagram reading instruction had a positive effect on reading comprehension, ANOVAs were conducted with instruction groups (text–diagram, comprehension monitoring, and control) and reading ability (high and low) as independent variables, and the reading tests scores (immediate, delayed, and a new tests) as dependent variables. The descriptive values are shown in Table 1.
Immediate test
In the immediate multiple-choice questions, the results revealed main effects on the instruction groups, F(2, 107) = 4.65, p < .05, η2 = .08, and on reading ability, F(1, 107) = 27.69, p < .001, η2 = .21, but no interaction between instruction groups and reading ability, p > .05. Post hoc comparisons demonstrated that the text–diagram group had significantly higher scores on the immediate multiple-choice test than the other two groups, and high-ability students also significantly outperformed low-ability students, ps < .05. In the immediate essay questions, the results revealed a marginal main effect on the instruction groups, F(2, 107) = 2.51, p = .08, η2 = .05, and a significant effect on reading ability, indicating the high-ability students outperformed low-ability students, F(1, 107) = 23.76, p < .001, η2 = .18, and no interaction effect, p > .05.
Delayed test
In the delayed multiple-choice test, the results revealed a marginal impact on the instruction groups, F(2, 107) = 2.75, p = .06, η2 = .05, a significant effect on reading ability, F(1, 107) = 19.07, p < .001, η2 = .15, but no interaction effect. Post hoc analyses revealed that the text–diagram group significantly outperformed the comprehension monitoring group; the text–diagram group marginally outperformed the control group, and high-ability students outperformed low-ability students. In the delayed essay questions, the results revealed no significant effect on the instruction groups, a noticeable effect on reading ability, F(1, 107) = 22.08, p < .001, η2 = .17, and an interaction effect that was marginally significant, F(2, 107) = 2.62, p = .07, η2 = .05. The results of simple main effects revealed that low-ability students showed a main effect on the instruction groups, F(2, 43) = 3.28, p < .05, η2 = .14, indicating that the text–diagram outperformed the control group; however, for the high-ability students, who were in the three groups, there were no significant differences on the scores of the delayed essay questions, p > .05. In addition, the high-ability students significantly outperformed the low-ability students not only in the control groups, p < .001, but also in the comprehension monitoring instruction groups, p < .01.
A new test
One month later, the participants were asked to read a new science article without instruction interventions and complete a new test. In the multiple-choice questions, the results revealed a main effect on reading ability, F(1, 106) = 15.77, p < .001, η2 = .13, indicating that high-ability students outperformed the low-ability students; however, no main effect was evident for the instruction groups nor interaction of reading ability and instruction groups, ps > .05. The scores on the essay questions showed similar patterns: there was a main effect on reading ability, F(1, 106) = 22.93, p < .001, η2 = .18, indicating that high-ability students outperformed the low-ability students; however, there were neither interaction nor main effects on the instruction group, p s > .05.
Eye movement analysis
To answer the second research question: whether text–diagram reading instruction affected reading processes, ANOVAs were conducted with instruction groups (text–diagram, comprehension monitoring, and control) and reading ability (high and low) as independent variables, and the eye movement indicators (total fixation duration of the article, texts and diagrams; proportion of total duration of the texts and diagrams, and the numbers of saccades between texts and diagrams) as dependent variables. As eye movement indicators had different units (e.g., fixation durations, proportion of total fixation durations, and number of saccades between text and diagrams), the original values were converted into Z-scores to facilitate description (Fig. 2). Moreover, no interaction on reading ability or eye movement indicators were found, indicating that the high and low groups had similar processes of changing eye movement patterns over time. Therefore, the data of all participants were combined, as shown in Fig. 2.

The changing processes of eye movement patterns over time. Note The manta ray article was a baseline comparison for the three groups (text–diagram integration, comprehension-monitoring, and control) before instructions intervention. The turtle article was the sample article used by instructions intervention. The dolphin article readers immediately read it independently after the instructions. The mantis article was being read after 1 month later of instructions intervention
First, to confirm that all participants randomly assigned to one of the three groups (text–diagram, comprehension monitoring, and control) had similar reading patterns before reading instruction interventions, one-way ANOVAs were conducted to analyze the eye movement for the data when the participants were reading the first article (the manta ray). The results indicated that there was no main effect on instruction groups with regard to total fixation duration for the article, texts and diagrams; the proportion of total duration of attention paid to the texts and diagrams; and the numbers of saccades between texts and diagrams, ps > .05. The descriptive values are shown in Table 2. The results showed that the three groups did not differ significantly on the reading patterns before the intervention using instructions.
Second, to answer the question of whether text–diagram reading instruction affected reading processes at the moment of receiving the reading instruction, and whether reading ability mediated this effect, 3 × 2 ANOVAs were conducted to analyze eye movement data for the participants reading the second (turtle) article. The descriptive values are shown in Table 3. The results showed that there were main effects on the instruction group for the total fixation duration of the article, F(2, 107) = 14.53, p < .001, η2 = .21, total fixation duration of attention to the diagrams, F(2, 107) = 47.32, p < .001, η2 = .47, proportion of total fixations on the texts, F(2, 107) = 34.34, p < .001, η2 = .39, proportion of total fixations on the diagrams, F(2, 107) = 47.32, p < .001, η2 = .47, and the numbers of saccades between texts and diagrams, F(2, 107) = 54.28, p < .001, η2 = .51; however neither main effects on reading ability nor interaction effects were observed on the five eye movement indicators, ps > .05. Post hoc comparisons demonstrated that the text–diagram integration group had longer total fixation durations on reading the whole article and diagrams sections, higher proportion of total fixation durations on diagrams, lower proportion of total fixation durations on texts, and similar numbers of saccades between texts and diagrams than the other both groups, ps < .001; however, this was not the case for total fixation durations of texts sections, ps > .05.
Third, to answer whether text–diagram reading instruction affected reading processes after receiving the reading instruction and immediately reading an article, and whether reading ability mediated this effect, 3 × 2 ANOVAs were conducted to analyze eye movement data when reading the third (dolphin) article. The descriptive values are shown in Table 3. The results showed that there were main effects evident for the instruction groups on total fixation duration of the article, F(2, 107) = 7.38, p < .01, η2 = .12, total fixation duration of the diagrams, F(2, 107) = 23.03, p < .001, η2 = .30, proportion of total fixations on the texts, F(2, 107) = 17.27, p < .001, η2 = .24, proportion of total fixations on the diagrams, F(2, 107) = 23.03, p < .001, η2 = .30, and the numbers of saccades between texts and diagrams, F(2, 107) = 25.67, p < .001, η2 = .32; however, neither the main effects of reading ability nor interaction effects were observed on the five eye movement indicators, ps > .05. Post hoc comparisons demonstrated that the text–diagram integration group had longer total fixation durations when reading the whole article and diagrams sections, higher proportion of total fixation durations on diagrams, lower proportion of total fixation durations on texts, and similar numbers of saccades between texts and diagrams than the other both groups, ps < .05; however, this was not the case for total fixation durations of texts sections, ps > .05.
Fourth, to answer whether text–diagram reading instruction affected reading processes after receiving the reading instruction 1 month later, and whether reading ability mediated this effect, 3 × 2 ANOVAs were conducted to analyze eye movements data of the reading of article four (Mantis). The descriptive values are shown in Table 3. The results showed that there were main effects for the instruction groups on total fixation duration of the diagrams, F(2, 106) = 10.56, p < .001, η2 = .17, proportion of total fixations on the texts, F(2, 106) = 8.00, p < .01, η2 = .13, proportion of total fixations on the diagrams, F(2, 106) = 10.56, p < .001, η2 = .17, and the numbers of saccades between texts and diagrams, F(2, 106) = 12.03, p < .001, η2 = .19; however, neither main effects on reading ability nor interaction effects were observed for the five eye movement indicators, ps > .05. Post hoc comparisons demonstrated that the text–diagram integration group had longer total fixation durations when reading the diagrams sections, a higher proportion of total fixation durations on diagrams, a lower proportion of total fixation durations on texts, and similar numbers of saccades between texts and diagrams than the other both groups, ps < .01; however, this was not the case for the total fixation durations on the whole article and texts sections, ps > .05.
Discussion and conclusion
This study investigated the immediate and delayed effects of text–diagram reading instruction on the reading comprehension and learning processes for illustrated text reading. Prior studies focused on the effect of text–diagram instruction on learning outcomes (Jian, 2018a; Scheiter et al., 2015) as opposed to learning processes. This study used an eye-tracker to identify the reading processes that may underlie recent findings on the effect of text–diagram integration instruction. In addition, as reading ability is important and influences reading processes (Jian & Ko, 2017; Hannus & Hyönä, 1999), it was included to examine whether reading ability moderated instruction effects. Corroborating with prior research, and measuring the immediate effect of reading instruction (Jian, 2018a, b), the delayed effect of the intervention was measured, as readers may rely on different and more superficial representations when reading articles (Arndt et al., 2015). To control the possibility of a placebo effect, as raised by an earlier study (Jian, 2018b), this study included a control group that received different instructions.
Corroborating the CTML assumptions (Mayer, 2009), the results confirmed Hypothesis 1a and showed that there was better reading comprehension in the group that received text–diagram instruction. The effect of text–diagram instruction on learning outcomes replicates recent findings (Jian, 2018a, b), which showed that text–diagram instruction facilitated reading comprehension, evident in immediate testing for high- and low-ability readers. Additionally, the results of this study also confirmed Hypothesis 1b, which showed that the effect of text–diagram reading instruction was more significant on the immediate test than on the delayed test. It replicated the findings of previous reading instruction research (Manoli et al., 2016; Torgesen et al., 2001). An inspiring finding of this study was that even after 1 month, the intervention of text–diagram instruction was still effective for the low-ability young readers. The scores on multiple-choice questions were better for those readers who received text–diagram instruction than the control group readers. It was evident from the eye-tracking patterns that readers who received the instructions, which emphasized diagram decoding and text–diagram integration, inspected pictures to formulate an impression, which supported their understanding of the corresponding text (Eitel, Scheiter, & Schüler, 2012; Lindner, Eitel, Strobel, & Köller, 2017). This supports the view that connecting text and illustrations in multimedia learning is crucial to constructing a good mental model (Mayer, 2009).
Eye movement data identified the reading processes that may underlie the impact of text–diagram instruction (Scheiter et al., 2015). Figure 2 depicts the changing appearance of reading processes over time. Before instruction, all groups (text–diagram, comprehension monitoring, and control) had similar reading processes; their total fixation duration on the article, text, and diagram, total reading time proportion, and number of saccades between text–diagram were similar while reading the first (manta ray) article. Nevertheless, in the moment of and after of receiving the instructional interventions, there is evidence that the text–diagram group changed their strategies and reflected on their reading processes. They spent more time reading the second and third (turtle and dolphin) articles and diagrams sections; spent a higher total reading time proportion on the diagrams and made many saccades between text–diagram than the other two groups. These results confirmed Hypothesis 2a. Interestingly, text–diagram instruction did not change the reading processes on the texts section. The result of this study somewhat differed from the research of Scheiter et al. (2015) who used middle-school students as participants. Their study found that the students were likely to use their original strategies to read illustrated texts instead of a newly taught reading strategy. Scheiter et al. considered that middle-school students may have numerous existing reading strategies that could not be easily changed in a short period of reading training. Contrastingly, young readers may more easily accept the reading strategies taught to them and apply them when reading new articles. This speculation was supported by the evidence in the results of this study, which showed that the students who received text–diagram integration instruction used different reading patterns when compared to the other two groups, even when tested 1 month after the instructional intervention.
In addition, it was found that although readers seemed to have formulated a criterion for the time needed to comprehend an article and maintained that time across articles, their comprehension of the articles was different. Figure 2 indicated that readers had similar Z-scores for total fixation duration and numbers of fixations on the first article (before intervention) and fourth article (1 month after the intervention). However, although the text–diagram group performed well even after 1 month, they still devoted more cognitive effort and time to apply the learned strategies when reading the fourth article. The instruction effect somewhat diminished over time (confirming Hypothesis 3), however, the differences in eye movements between the text–diagram group and the other two groups were somewhat smaller on the delayed test and, crucially, they were statistically significant. The results of this study not only replicated the previous research concerned learning outcomes of immediate tests and delayed tests (Manoli et al., 2016; Roy et al., 2017; Torgesen et al., 2001), but also examined the reading processes over time by comparing the results of immediate and delayed tests.
Contributions and limitations
Overall, this study provided both theoretical and instructional contributions to the field. In terms of theoretical aspects, this study confirmed that the CTML (Mayer, 2009) could be generalize to explain young readers’ learning process when doing illustrated text reading, if they received well-designed reading strategy instructions. This study also identified how these young readers selected, organized, and integrated the textual and pictorial representations, using eye movement data. This study provided an effective text–diagram reading instruction intervention for young readers, which differed from the abundant text-only reading strategies which had previously been developed. Furthermore, the text–diagram integration instruction developed in this study corresponded to the purpose of reading to learn novel knowledge (Cain et al., 2001; Clark et al., 2018; Förster et al., 2018; Reed & Lynn, 2016), and provided evidence that the positive effect can last up to 1 month after the instruction.
However, some limitations remain a concern for future research: First, the internal consistency of the reading tests was not very high in this study. Although a pilot study before the formal experiment was executed, the item analysis (including distractor analysis, item difficulty and discrimination), to ensure the quality of the items, future research needs to verify the internal consistency of the reading tests by revising the test items several times until certainty can be ascertained. Second, the effect of the text–diagram instruction of this study can be tested to verify if it works in classroom-based interventions. Third, further research could explore other subject areas to examine the reading instruction effects on reading comprehension and reading processes in other disciplines.
References
Ainsworth, S. (2006). DeFT: A conceptual framework for considering learning with multiple representations. Learning and Instruction, 16, 183–198.
Arndt, J., Schüler, A., & Scheiter, K. (2015). Text–picture integration: How delayed testing moderates recognition of pictorial information in multimedia learning. Applied Cognitive Psychology, 29, 702–712. https://doi.org/10.1002/acp.3154.
Bartholomé, T., & Bromme, R. (2009). Coherence formation when learning from text and pictures: What kind of support for whom? Journal of Educational Psychology, 101(2), 282–293. https://doi.org/10.1037/a0014312.
Berthold, K., Eysink, T. H., & Renkl, A. (2009). Assisting self-explanation prompts are more effective than open prompts when learning with multiple representations. Instructional Science, 37(4), 345–363. https://doi.org/10.1007/s11251-008-9051-z.
Brandstetter, M., Sandmann, A., & Florian, C. (2017). Understanding pictorial information in biology: Students’ cognitive activities and visual reading strategies. International Journal of Science Education, 39(9), 1218–1237. https://doi.org/10.1080/09500693.2017.1320454.
Butcher, K. R. (2014). The multimedia principle. In R. E. Mayer (Ed.), The Cambridge handbook of multimedia learning (2nd ed., pp. 174–205). New York, NY: Cambridge University Press.
Cain, K., Oakhill, J. V., Barnes, M. A., & Bryant, P. E. (2001). Comprehension skill, inference-making ability, and their relation to knowledge. Memory & Cognition, 29, 850–859.
Cain, K., Oakhill, J., & Lemmon, K. (2004). Individual differences in the inference of word meanings from context: The influence of reading comprehension, vocabulary knowledge, and memory capacity. Journal of Educational Psychology, 96(4), 671–681. https://doi.org/10.1037/0022-0663.96.4.671.
Cheng, M. W., & Gilbert, J. K. (2014). Students’ visualization of diagrams representing the human circulatory system: The use of spatial isomorphism and representational conventions. International Journal of Science Education, 37(1), 136–161. https://doi.org/10.1080/09500693.2014.969359.
Clark, S. K., Schoepf, S., & Hatch, L. (2018). Exploring the use of personalized professional development to enhance teacher knowledge and reading instruction in the upper elementary grades. Journal of Research in Reading, 41, 30–47. https://doi.org/10.1111/1467-9817.12130.
Coleman, J. M., McTigue, E. M., & Dantzler, J. A. (2018). What makes a diagram easy or hard? The impact of diagram design on fourth-grade students’ comprehension of science texts. The Elementary School Journal, 119(1), 122–151.
Eitel, A. (2016). How repeated studying and testing affects multimedia learning: Evidence for adaptation to task demands. Learning and Instruction, 41, 70–84. https://doi.org/10.1016/j.learninstruc.2015.10.003.
Eitel, A., Scheiter, K., & Schüler, A. (2012). The time course of information extraction from instructional diagrams. Perceptual and Motor Skills, 115, 677–701. https://doi.org/10.2466/22.23.PMS.115.6.677-701.
Eitel, A., Scheiter, K., & Schüler, A. (2013). How inspecting a picture affects processing of text in multimedia learning. Applied Cognitive Psychology, 27(4), 451–461. https://doi.org/10.1002/acp.2922.
Förster, N., Kawohl, E., & Souvignier, E. (2018). Short- and long-term effects of assessment-based differentiated reading instruction in general education on reading fluency and reading comprehension. Learning & Instruction, 56, 98–109. https://doi.org/10.1016/j.learninstruc.2018.04.009.
Guo, D., Zhang, S., Wright, K. L., & McTigue, E. M. (2020). Do you get the picture? A meta-analysis of the effect of graphics on reading comprehension. Educational Psychology Review, 32, 627–656. https://doi.org/10.1177/2332858420901696.
Hannus, M., & Hyönä, J. (1999). Utilization of illustrations during learning of science textbook passages among low- and high-ability children. Contemporary Educational Psychology, 24, 95–123. https://doi.org/10.1006/ceps.1998.0987.
Hegarty, M., & Just, M. A. (1993). Constructing mental models of machines from text and diagrams. Journal of Memory and Language, 32(6), 717–742. https://doi.org/10.1006/jmla.1993.1036.
Jian, Y. C. (2018a). Teaching fourth-grade students to read biological illustrations and integrate to text information: An empirical experiment. Research in Science Education, 12, 13. https://doi.org/10.1007/s11165-018-9778-8.
Jian, Y. C. (2018b). Reading instructions influence cognitive processes of illustrated text reading not subject perception: An eye-tracking study. Frontiers in Psychology, 9, 2263. https://doi.org/10.3389/fpsyg.2018.02263.
Jian, Y. C. (2019). Reading instructions facilitate signaling effect on science text for young readers: an eye-movement study. International Journal of Science and Mathematics Education, 17, 503–522. https://doi.org/10.1007/s10763-018-9878-y.
Jian, Y. C., & Ko, H. W. (2017). Influences of text difficulty and reading ability on learning illustrated science texts for children: An eye movement study. Computers and Education, 113, 263–279. https://doi.org/10.1016/j.compedu.2017.06.002.
Jian, Y. C., & Wu, C. J. (2015). Using eye tracking to investigate semantic and spatial representations of scientific diagrams during text-diagram integration. Journal of Science Education and Technology, 24(1), 43–55. https://doi.org/10.1007/s10956-014-9519-3.
Johnson, C. I., & Mayer, R. E. (2012). An eye movement analysis of the spatial contiguity effect in multimedia learning. Journal of Experimental Psychology: Applied, 18(2), 178–191. https://doi.org/10.1037/a0026923.
Just, M. A., & Carpenter, P. A. (1980). A theory of reading: From eye fixations to comprehension. Psychological Review, 87, 329–354.
Kim, Y.-S. G., Vorstius, C., & Radach, R. (2018). Does online comprehension monitoring make a unique contribution to reading comprehension in beginning readers? Evidence from eye movements. Scientific Studies of Reading, 22(5), 367–383. https://doi.org/10.1080/10888438.2018.1457680.
Ko, H. W. (2006). 閱讀理解測驗 (Reading comprehension test). Psychological Testing, 46, 1–11.
Kozma, R. (2003). The material features of multiple representations and their cognitive and social affordances for science understanding. Learning and Instruction, 13(2), 205–226. https://doi.org/10.1016/S0959-4752(02)00021-X.
Kragten, M., Admiraal, W., & Rijlaarsdam, G. (2015). Students’ learning activities while studying biological process diagrams. International Journal of Science Education, 37(12), 1915–1937. https://doi.org/10.1080/09500693.2015.1057775.
Lindner, M. A., Eitel, A., Strobel, B., & Köller, O. (2017). Identifying processes underlying the multimedia effect in testing: An eye-movement analysis. Learning & Instruction, 47, 91–102. https://doi.org/10.1016/j.learninstruc.2016.10.007.
Manoli, P., Papadopoulou, M., & Metallidou, P. (2016). Investigating the immediate and delayed effects of multiple-reading strategy instruction in primary EFL classrooms. System, 56, 54–65. https://doi.org/10.1016/j.system.2015.11.003.
Mason, L., Pluchino, P., & Tornatora, M. C. (2013a). Effects of picture labeling on science text processing and learning: Evidence from eye movements. Reading Research Quarterly, 48(2), 199–214. https://doi.org/10.1002/rrq.41.
Mason, L., Tornatora, M. C., & Pluchino, P. (2013b). Do fourth graders integrate text and picture in processing and learning from an illustrated science text? Evidence from eye-movement patterns. Computers & Education, 60(1), 95–109. https://doi.org/10.1016/j.compedu.2012.07.011.
Mayer, R. E. (2009). Multimedia learning (2nd ed.). New York, NY: Cambridge University Press. https://doi.org/10.1017/CBO9780511811678.
McTigue, E. M. (2009). Does multimedia learning theory extend to middle-school students? Contemporary Educational Psychology, 34(2), 143–153. https://doi.org/10.1016/j.cedpsych.2008.12.003.
Rayner, K. (1998). Eye movements in reading and information processing: 20 years of research. Psychological Bulletin, 124(3), 372–422. https://doi.org/10.1037/0033-2909.124.3.372.
Reed, D. K., & Lynn, D. (2016). The effects of an inference-making strategy taught with and without goal setting. Learning Disability Quarterly, 39(3), 133–145. https://doi.org/10.1177/0731948715615557.
Reid, D. J., & Beveridge, M. (1986). Effects of text illustration on children’s learning of a school science topic. The British Journal of Educational Psychology, 56(3), 294–303. https://doi.org/10.1111/j.2044-8279.1986.tb03042.x.
Renkl, A., & Scheiter, K. (2017). Studying visual displays: How to instructionally support learning. Educational Psychology Review, 29(3), 599–621. https://doi.org/10.1007/s10648-015-9340-4.
Richter, J., Scheiter, K., & Eitel, A. (2016). Signaling text–picture relations in multimedia learning: A comprehensive meta-analysis. Educational Research Review, 17, 19–36. https://doi.org/10.1016/j.edurev.2015.12.003.
Roy, S., Inglis, M., & Alcock, L. (2017). Multimedia resources designed to support learning from written proofs: An eye-movement study. Educational Studies in Mathematics, 96(2), 249–266. https://doi.org/10.1007/s10649-017-9754-7.
Scheiter, K., & Eitel, A. (2015). Signals foster multimedia learning by supporting integration of highlighted text and diagram elements. Learning and Instruction, 36, 11–26. https://doi.org/10.1016/j.learninstruc.2014.11.002.
Scheiter, K., Schubert, C., Gerjets, P., & Stalbovs, K. (2015). Does a strategy training foster students’ ability to learn from multimedia? Journal of Experimental Education, 83(2), 266–289. https://doi.org/10.1080/00220973.2013.876603.
Schlag, S., & Ploetzner, R. (2011). Supporting learning from illustrated texts: conceptualizing and evaluating a learning strategy. Instructional Science, 39, 921–937. https://doi.org/10.1007/s11251-010-9160-3.
Schüler, A. (2017). Investigating gaze behavior during processing of inconsistent text–picture information: Evidence for text–picture integration. Learning & Instruction, 49, 218–231. https://doi.org/10.1016/j.learninstruc.2017.03.001.
Torgesen, J. K., Alexander, A. W., Wagner, R. K., Rashotte, C. A., Voeller, K. K. S., & Conway, T. (2001). Intensive remedial instruction for children with severe reading disabilities: Immediate and long-term outcomes from two instructional approaches. Journal of learning disabilities, 34(1), 33–58. https://doi.org/10.1177/002221940103400104.
van der Meij, J., & de Jong, T. (2011). The effects of directive self-explanation prompts to support active processing of multiple representations in a simulation-based learning environment. Journal of Computer Assisted learning, 27, 411–423. https://doi.org/10.1111/j.1365-2729.2011.00411.x.
Van Gog, T. (2014). The signaling (or cueing) principle in multimedia learning. In R. E. Mayer (Ed.), The Cambridge handbook of multimedia learning (2nd ed., pp. 263–278). New York, NY: Cambridge University Press.
Van Meter, P. N., Cameron, C., & Waters, J. R. (2017). Effects of response prompts and diagram comprehension ability on text and diagram learning in a college biology course. Learning & Instruction, 49, 188–198.
Young Newton. (2015). 海豚 (Dolphin). Young Newton, 133, 10–26.
Young Newton. (2016). 鬼蝠魟 (Manta ray). Young Newton, 141, 40–58.
Young Scientist. (2015). 革龜 (Turtle). Young Scientist, 7, 52–59.
Young Scientist. (2016). Mantis (螳螂). Young Scientist, 20, 50–57.
Acknowledgements
This research was supported by the Grants MOST 108-2636-H-003-003- and 109-2636-H-003-003-from the Ministry of Science and Technology in Taiwan., and “Higher Education Deep Cultivation Project” of National Taiwan Normal University (NTNU), sponsored by the Ministry of Education, Taiwan.
Author information
Authors and Affiliations
Corresponding author
Additional information
Publisher's Note
Springer Nature remains neutral with regard to jurisdictional claims in published maps and institutional affiliations.
Appendices
Appendix 1: The four reading materials used in this study. Black lines indicated interests of areas (AOIs) of texts and diagrams used in analysis but not be seen by the participants
-
(1)
Manta ray (baseline article)
-
(2)
Turtle (intervention article)
-
(3)
Dolphin (immediate and delayed article)
-
(4)
Mantis (a new article 1 month later)


Appendix 2: English version of the reading materials (in Chinese)
Giant oceanic manta rays (the first article)
Body structure of giant oceanic manta rays
The giant oceanic manta ray (Manta birostris) is the largest ray recorded till date. They have flattened bodies that are shaped like a diamond with a long tail. The front of their head contains two protruding horn-shaped fins. The pectoral fins are triangular in shape and are well developed. When fully extended, the giant oceanic manta ray is even longer than a car. They propel themselves forward by waving the pectoral fin. In the past, people felt that these rays looked terrifying and called them “devil fishes”. In reality, they are gentle and friendly creatures.
Large-mouthed vacuum cleaners
In addition to their huge bodies, the large mouth located at the front of their head is also noticeable. Their lower jaw contains teeth that are so small that they cannot be used for mastication. Their mouth acts like a vacuum cleaner—the horn-shaped fins at both ends of their mouth move and close continuously so that the seawater enters the mouth. This causes small fishes, shrimps, and other zooplanktons to enter their mouth before seawater flows out of the gills and the planktons are filtered. This form of feeding is known as filter-feeding.
Feasting around in circles
Giant oceanic manta rays exhibit an interesting behavior when feeding: They repeatedly swim up and down and filter-feed in circles. In the tropical belt in the Indian Ocean, the effects of monsoon winds and oceanic currents in the period from summer to autumn cause large numbers of krill and other zooplanktons to migrate from the ocean depths to the surface. This attracts hundreds of giant oceanic manta rays who continuously swim in circles to enjoy a feast.
Agile jumpers
Normally, giant oceanic manta rays swim slowly on the sea surface in groups. However, during the breeding season, in spring and summer, they can sometimes be seen using their pectoral fins to hit the water surface and rapidly leap up and glide for some distance in the air. Some scientists believe that this may be a form of courtship behavior while other scientists speculate that this is a way of removing parasites on their body. Some people even believed that they do this for fun.
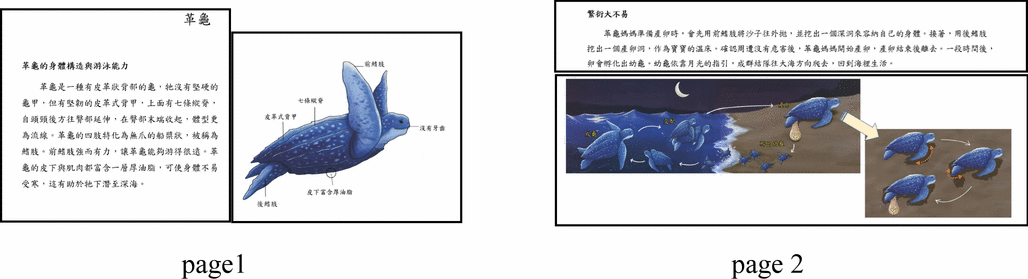
Leatherback sea turtles (the second article)
Body structure and swimming capabilities of leatherback sea turtles
Leatherback sea turtles (Dermochelys coriacea) are turtles that do not possess hard shells but possess a tough leather carapace with seven longitudinal ridges that extend from the back of the head to the caudal margin, making their body streamlined. The four limbs of the leatherback sea turtle are clawless and oar-shaped, and are known as flippers. The front flippers are powerful and enable these turtles to swim long distances. The subcutaneous tissues and muscles of the leatherback sea turtle contains a layer of fat, which insulates their body and enables them to dive to ocean depths.
Difficult reproduction
When a female leatherback sea turtle spawns, it uses its front flippers to push sand outwards to excavate a deep nest to fit its body. Following this, the rear flippers are used to dig a spawning hole for eggs to incubate. After confirming that there is no danger nearby, the female starts to spawn and leaves the nest after spawning. After a period of time, the eggs hatch and the hatchlings form groups that crawl towards the sea, guided by the moonlight.
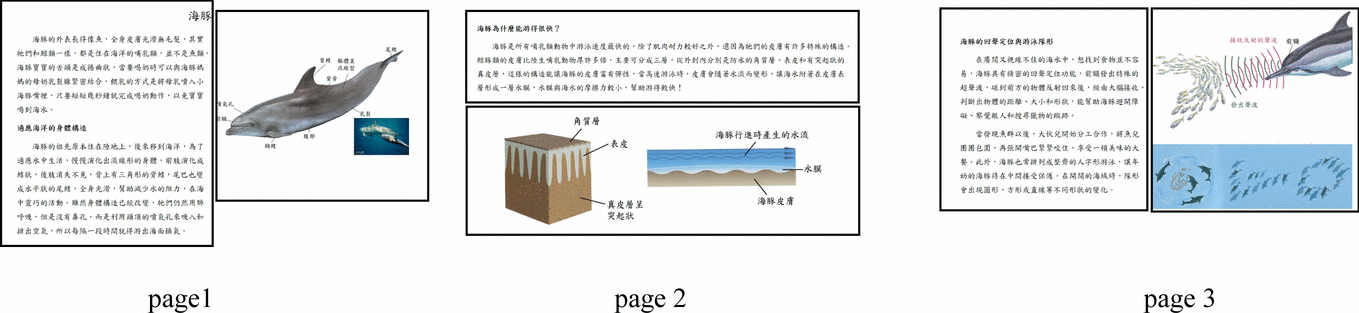
Dolphins (the third article)
Dolphins look like fishes and have smooth and hairless skin throughout their body. However, like cetaceans, they are mammals, not fishes. The tongue of a dolphin calf is curled. When feeding, the tongue can tightly bind to the mammary slits in female dolphins and milk is sprayed into the mouth of the calf. Feeding is completed in several minutes to prevent calves from drinking seawater.
Body structure that is adapted to the ocean
The ancestors of dolphins are terrestrial animals that moved into the ocean. In order to adapt to living in water, they evolved a streamlined body, flippers as front limbs, a triangular dorsal fin at the back, horizontal caudal fins as rear limbs, and smooth body to reduce water resistance and move nimbly in the sea. Although their body structure has changed, they use lungs to breathe but do not have nostrils. Instead, they use blowholes on their heads for inhalation and exhalation. Therefore, dolphins need to swim to the surface for gaseous exchange every now and then.
What enables dolphins to swim very fast?
Dolphins have the fastest swimming speeds among mammals. In addition to high muscle endurance, their skin also possesses many unique characteristics. Dolphin skin is many times thicker than terrestrial animals and is divided into three layers, namely (from outer to inner), a waterproof stratum corneum, epidermis, and a dermis layer with protrusions. This structure enables dolphin skin to be elastic. When swimming at high speeds, the skin deforms with the flow of water so that seawater attaches to the skin surface to form a water film. The friction between the water film and seawater is lower, which enables dolphins to swim faster!
Echolocation and swimming formation of dolphins
It is not easy to find food in the vast expanse of seawater that has poor visibility. Hence, dolphins possess precise echolocation in which the forehead emits unique ultrasonic waves that are reflected from objects in front. These reflected waves are received by the brain to determine the distance, size, and shape of the object. This enables dolphins to avoid obstacles, perceive enemies, and search for prey.
When dolphins discover a school of fish, they show division of labor by encircling the school of fish before using their mouths to bite the prey and enjoy a sumptuous meal. In addition, dolphins often form neat Y-shaped swimming pods so that calves are protected in the center. In vast oceans, pods appear circular, square, or linear.
Praying mantises (the fourth article)
Omnidirectional vision
The connection between the head and thorax of the praying mantis is extremely flexible, enabling the head to make a 180-degree rotation. This enables it to monitor changes in its surroundings, which is very advantageous in a savage environment.
However, its eyes are different. A pair of compound eyes is found at both sides of the head. These are composed of many hexagonal ommatidia that cannot be moved in any direction. However, these compound eyes are abnormally large and there is partial overlap in their field of vision. Therefore, the praying mantis is one of very few insects with stereoscopic vision that can accurately calculate the position of the target. In addition, the praying mantis also possesses lenses that can change color—during daytime, the color of the compound eyes is usually close to that of the body; at night, the pigments in the eye will concentrate at the outermost layer of the eye and turn deep black. This enables them to fly, feed, and survive in the dark. In addition, praying mantises also have three simple eyes. Although they do not contribute to stereoscopic vision, they are extremely sensitive to light intensity and can react to shadows and brightness in the environment.
Prey and natural enemies of the praying mantis
Although praying mantises are shy by nature and rarely attack with fanfare, the pair of raptorial legs in the thorax and their track record of capturing prey makes it live up to its name of an insect ninja. This pair of raptorial legs is the most important weapon for capturing prey and is usually in front of the thorax. If a prey accidentally enters this region, the praying mantis requires only a very short time to rapidly spring out both legs and press down hard to capture the prey. Once the prey struggles and resists, the spikes on the legs respond akin to teeth occlusion so that the prey is unable to escape.
Generally, praying mantises feed on insects such as crickets, bees, and butterflies. However, small animals that can be handled such as geckos, frogs, or even small praying mantises are also fed on. Although praying mantises are professional assassins, they have many natural enemies, such as birds and lizards. When approached by these predators, they lift their raptorial legs and open their wings to scare the enemy off.
Appendix 3: The sample questions for the reading tests
Examples of the multiple choice questions
-
1.
Which of the following is not a physical characteristic that enables dolphins to move nimbly in the water?
-
(1)
Smooth body
-
(2)
Triangular dorsal fin
-
(3)
Short pectoral fin
-
(1)
-
2.
Which part of the dolphin emits sound waves?
-
(1)
Pectoral fin
-
(2)
Mouth
-
(3)
Forehead
-
(1)
-
3.
Why do praying mantises possess stereoscopic vision?
-
(1)
There is partial overlap in the visual field of both eyes
-
(2)
The eyes contain several hexagonal ommatidia
-
(3)
The eyes can move in any direction
-
(1)
-
4.
In the praying mantis, which body part has a large range of motion?
-
(1)
Head
-
(2)
Eyes
-
(3)
Head and eyes
-
(1)
Examples of the essay questions
-
1.
What enables dolphins to swim very fast? Please list three reasons
-
2.
What is the difference between the compound eye and simple eye in the praying mantis?
Rights and permissions
About this article

Cite this article
Jian, YC. The immediate and delayed effects of text–diagram reading instruction on reading comprehension and learning processes: evidence from eye movements. Read Writ 34, 727–752 (2021). https://doi.org/10.1007/s11145-020-10089-3
Published:
Issue Date:
DOI: https://doi.org/10.1007/s11145-020-10089-3