
Abstract
This paper presents an Exploratory Spatial Data Analysis and Spatial Econometric modeling of the 2011 National Constituent Assembly elections (NCA) in Tunisia. By using electoral data at delegation level of the six main political parties (Ennahda, Congress of the Republic, Ettakatol, the Democratic Progressive Party, the Petition and the Democratie Modernist Pole), we show that geographical proximity matters in Tunisia’s voting behavior. The results overwhelmingly support the spatial Durbin model, including spatially weighted independent variables, as the best model to explain the voting phenomenon. Employing LeSage and Pace’s approach, we find that the largest direct and indirect effects are associated with age cohort and level of educational attainment. Voters who live in poorer neighborhoods are more likely to support the Petition list. Our results also show that younger voters are more likely to vote Ennahda, while older voters with high educational attainment are more likely to support Ettakatol and the Democratie Modernist Pole parties. Men are more likely to support Congress of the Republic than women voters.
1 Introduction
After more than 23 years of one-party dictatorship, Tunisia held a multi-party National Constituent Assembly (NCA) election in 2011. This first democratic election was conducted under the supervision of the National Democratic Institute (NDI) as well as 45 short-term international observers and two long-term observers who witnessed the process before, on and after the election day.Footnote 1 The High Independent Authority (ISIE)Footnote 2 was created to manage these elections and to guarantee they would be free and democratic.Footnote 3
On October 15, the ISIE announced that a total of 4,439,527 voters (54 % of total eligible voters in Tunisia and abroad) had chosen their polling station. The ISIE announced the final election results on November 14 in Tunis. The new assembly has 217 members (or seats), elected by direct universal suffrage on closed list proportional representation (PR) system. From a total of 1,517 lists (54.6 % as political parties, 43.3 % independent candidates, and 2.4 % by coalitions), the Islamist Party Ennahdha (Renaissance Movement Ennahdha) obtained the highest number of seats in the NCA, with a total of 89, while the Liberal Congress of the Republic (CPR) received 29, and Al Aridha Al Chaabia (henceforth the Petition) 26. Ettakatol received a total of 20 seats, and the Democratic Progressive Party (PDP) received 16 seats. The female participation represents 27 % of the NCA seats (59 seats of which 40 for Ennahdha), and 46 % of registered voters.
Voting results are widely interpreted by national and international politicians, and the debate is mostly pronounced on the emergence of Islamist and secularism forces as well as the future role of Islam and sharia law in Tunisia. Little attention has been given to the geographical and economic dimensions of elections, except some works such as Gana et al. (2012) and Reith (2013). Gana et al. (2012) use an exploratory analysis by combining a sociological and a territorial approach, to show that Tunisian vote presents a strong territorial dimension. Reith (2013) uses the Generalized Spatial Two-Stage Least Squares Regression to test how the three theoretical hypothesis: ‘youth bulge’, ‘demographic disparities’, and the ‘role of digital media’ can explain the revolution and the success of Islamist party in Tunisian elections. According to the ‘youth bulge’ theory, based on the work of Thomas Robert Malthus, a large youth cohort aged 15–29 (which is the case for the majority of Arab countries) probably had the unintended effect of altering the regional military balance and can explain revolutions (LaGraffe 2012). In addition, the ‘demographic disparities’ which includes different kinds of inequality (poverty, unemployment, gender, and so on) can also explain the revolutionary event (Korotayev and Zinkina 2011). The most recent theory is the role of digital media. Despite the fact that the old regimes of Ben Ali and Moubarek blocked websites and intimidated bloggers disseminating information against the regime, the media network has played a major role in the ‘Arab Spring’.
Despite that the work of Gana et al. (2012) analyses the spatial dimension of Tunisian elections, it does not considers the spatial spillover process among administrative units and it also does not build a rigorous econometric model to deal with spatial clustering of voter turnout in NCA elections. The paper of Reith (2013) seeks to identify the main causes of the revolution and not to analyse the spatial dimension of Tunisian elections. Our paper presents an extension to these works in which we use the Exploratory Spatial Data Analysis (ESDA) and the spatial econometric methods to examine the determinants of voting patterns across small administrative units in Tunisia (delegation) and to show how social interactions and geographical proximity matter. Indeed, as showed by Johnston et al. (2004); Darmofal (2006) and Mészáros et al. (2007) the neighbourhood effects were among the strongest influences on party choice. Notably, social network, place identities and geographical proximity have a powerful influence on voters such that one network or local place member’s decision is highly dependent by its neighbors. Therefore, it is important to consider spatial effects in voting patterns because if such effects exist but are not accounted in the model, parameter estimates may be biased and inconsistent (Anselin 1988).
The remainder of this article is organized as follows: Section 2 offers some theoretical and empirical background. Section 3 outlines the major causes of Tunisian revolution. Data and estimation approaches are presented in Sect. 4. Section 5 presents the empirical results and Sect. 6 concludes.
2 Relevant literature review
There is a growing body of literature which suggests that voting patterns are not independent from space (Cutts and Webber 2010; Flint 2001; Gimpel et al. 2008; Johnston et al. 2000, 2004, 2005; Kim et al. 2003; Shin and Agnew 2007; Tapiador and Mezo 2009). Such relationship can results from people interacting and social network that occur in places. Indeed, people are influenced by those they discuss politics within their social networks, and more particularly those living in the same neighborhood. It is generally assumed, that those who live together talk together, those who vote together live together and those who live together act like each other (Johnston et al. 2004; Pattie and Johnston 2004). In the literature reviews, the relationship between space and election outcomes is considered at two different levels: the individual level and the aggregated level.
In an individual-level (or micro-level), most studies have accepted that voters are influenced by their social and geographical environments (Cox 1969; Pattie and Johnston 2004) as well as their own individual situations such as age, sex, marital status, income, ethnic background (Bühlmann and Freitag 2006; Knight and Marsh 2002). In his pioneer study of ‘the voting decision in a spatial context’, Cox (1969) introduced the concept of the neighbourhood effect to define a new subdiscipline of electoral geography, also called the Cox’s theories. Cox concludes that “individuals are somehow affected in their voting behavior by the information and cues dominant in their area of residence” Cox (1969, p. 97). He showed that social interactions within an environment influence individual choice. In addition, the local conditions and the face-to-face social interactions influence what individuals learn and know about politics. In the same vein, Leigh (2005) showed that contextual and spatial effects matter in voting pattern. More specifically, voters who live in richer neighborhoods are more likely to be right-wing, while those in more ethnically diverse or unequal neighborhoods are more likely to be left-wing. He added that “a voter dwelling in a neighborhood with few poor people may have less inclination to support anti-poverty policies than if the same voter lived in a less affluent area” (Leigh 2005, p. 266).
In an aggregate-level (or marco-level), some recent works stress the spatial clustering and the spatial diffusion of turnout and believe that voting behavior varies across places because of the different local political and economic conditions (local contextual effects). Others have also argued that turnout is affected by geographical proximity of one place to another (contagious diffusion) (Vilalta 2004). Using a sample of US metropolitan areas, Sauerzopf and Swanstrom (1999) concluded that different places create different political attitudes and electoral behaviours. Darmofal (2006) examined the macro turnout for each presidential election in the US from 1828 through 2000 by using spatial econometric models. He showed that turnout rates in each presidential election have a strong global spatial structuring.
Some interesting works propose an alternative approach that combines the two levels (individual level and the aggregate level) into one model (called multilevel or hierarchical model) for explaining voting behavior (e.g. Van Egmond et al. 1998; Bühlmann and Freitag 2006). The hierarchical model offers explanations on how contextual effects translate into individual behavior. Van Egmond et al. (1998) showed that the addition of contextual characteristics from a significant improvement to an individual level model predicting electoral participation. They combined survey data to consider the individual characteristics on electoral participation and aggregate data on the context of an election to estimate the influence of contextual characteristics.
3 Tunisian context
Since the mid-1980s, Tunisia has followed neo-liberal economic policies characterized by privatization and economic opening. This approach has reinforced the inequality in economic performance and employment opportunities between coastal and interior regions. As a matter of fact, more than 90 % of the total employment is still generated in the coastal part of the country. Moreover, regional disparities in unemployment rate were also significant in Tunisia. Non-coastal areas had the highest unemployment rate (18.5 %), (even exceeding 22.6 % in the governorate of Jendouba, Al Kef, Kasserine and Gafsa) as opposed to 13.1 % in the coastal areas (Amara and Ayadi 2013). In addition, the social situation in Tunisia has dramatically worsened in recent years due to the rise of the informal sector, the pandemic growth of corruption and the failure or inability of the formal sector to guarantee the desired level of employment. These social and spatial inequalities among the country’s regions were fuelling social unrest, thereby leading to the Tunisian revolution.
According to the National Institute of Statistics (INS), the head count poverty rate declined from 32.4 % in 2000, to 23.3 % in 2005 and then to 15.5 % in 2010. Despite this decline, inequality remains high in Tunisia as shown by the Gini coefficient, which rose from 39.3 % in 2000 to 42.1 % in 2005.Footnote 4 In addition, the decline in poverty rate at national level has masked huge differences between regions. The poverty rate is at 32.3 % in Center West, 25.7 % in North West and 21.5 % in South West, compared to 15.5 % at the national level in 2010. The Center East (8 %), the Greater Tunis (9.1 %) and the North East (10.3 %) have the smallest poverty rates.Footnote 5 The western regions of Tunisia are also the poorest in terms of basic infrastructures (health, sanitation, water, transport) and human capital availability, which presents one of the barriers to local and international investors.
Furthermore the spatial and social inequalities, poverty, migration and unemployment, other factors may explain the Tunisian revolution such as corruption and patronage, internet and newspapers censorship, the lack of freedom and expression, and the feeling of dissatisfaction. Indeed, corruption in Tunisia becomes a structured and hierarchical organisation that affects most private and public sectors. In addition, access to any information about the Tunisian political system (via websites, newspapers, books...) was almost impossible. The spatial and social inequalities and the oppressive regime have led the feeling of dissatisfaction of young people seeking dignity and social and economic security (see Ayeb 2011 and Mabrouk 2011 for more details about the main causes of the Tunisian revolution).
4 Data and methods
4.1 Data
To carry out the analysis on the NCA elections, we used three databases: (i) the Tunisian election final results published by the ISIE;Footnote 6(ii) the socioeconomic data of 2004 general census of the Tunisian population published by the INS; and (iii) the 2005 national survey of household consumption.Footnote 7
The ISIE dataset provided information on 51.7 % of the total number of potential votes at different levels (electoral district, delegation and governorate). Among the 8,289,900 eligible voters in both Tunisia and abroad, only 4,308,800 people voted. In order to provide equitable representation, the ISIE retained 33 constituencies (or electoral districts) where 27 constituencies in Tunisia and six out of the country. Notably, each governorate is represented by one electoral district, except the three governorates of Tunis, Nabeul and Sfax, whose population is more than 630,000 inhabitants and each, is divided into two electoral districts. The electoral districts are divided into 7,213 polling stations covering all the Tunisian territory to facilitate the voting process. Mobile teams were also introduced to facilitate registration in rural areas. Among the districts, one seat is assigned for each 60,000 inhabitants and one additional seat is also assigned when the remainder of inhabitant goes beyond 30,000. Furthermore, and in order to avoid penalizing governorates with low population density, mainly those in the south of Tunisia, two additional seats are allocated to governorates where the number of inhabitants is less than 270,000 and an additional seat is given to governorates where the number of inhabitants ranges between 270,000 and 500,000.
According to the official statistics announced by the ISIE on October 14th, 11,686 candidates appeared on 1,517 lists (655 independent lists, 828 party lists and 34 coalition lists) in the 27 electoral districts in Tunisia. The non-valid and blank ballots represent respectively 3.6 and 2.3 % of the total votes. Ennahdha ranked first among political parties with 1,500,649 votes (89 seats), CPR, the Petition and Ettakatol follow respectively the second, third and fourth positions. Our analysis is based on these parties, to which we added the Democratie Progressive Party (PDP) with 16 seats and the Democratie Modernist Pole (PDM) with five seats (see Table 1 for more details).
The second dataset used is the 2004 general Census of the Tunisian population. The Census offers detailed information about socioeconomic variables, including the educational attainment level, the age groups, urbanization and many others. The Census presents information at different levels: individual level, delegation level and governorate level. We use in addition the 2005 National survey of household consumption with 12,318 Households. The detailed information on the 2005 survey allows the estimation of poverty rate by delegation, which the Census cannot provide such information. For the spatial analysis, the 2004 census, the 2005 survey and the ISIE dataset were blended together at the delegation level. Hence, for each political party our analysis takes the votes aggregated in spatial or administrative units (delegation) as the basic units for analysis in the absence of detailed individual data for votes.
Table 2 displays the descriptive statistics of the key variables used in our empirical analysis. We can see that there is substantial variation in the turnout rate: the standard deviation is 12.425 %. Figure 1 shows that the governorate of Siliana in the Northwest (see Tunisia map in Appendix Fig. 6), exhibits the lowest levels of participation (10 %). The coastal (Sfax, Sousse, Nabeul and Tunis) and Southwest governorates exhibit the highest levels of participation (between 60 and 79 %). Figure 1 indicates also that the fraction of invalid ballots which varies between 0.5 and 11 % is particularly concentrated in the Northwest region, characterized by a high rate of illiteracy. There are, however, considerable geographic variations in voter turnout. As Fig. 2 shows, the vote share exhibits a clear pattern of extreme spatial clustering whatever the political party.
4.2 Methods
Two different approaches to spatial analysis are used in this study, Exploratory Spatial Data Analysis (ESDA) and spatial econometric models. The ESDA focuses on techniques describing spatial distributions (spatial trends), discovering patterns of spatial association (spatial clustering), and identifying spatial outliers (spatial outliers) (Anselin et al. 2007). Spatial econometrics methodology deals with the effects of spatial dependence and spatial heterogeneity in regression analysis.
4.2.1 Exploratory spatial data analysis (ESDA)
The use of the ESDA aims to learn more about the spatial clustering of 2011 Tunisian elections. We can identify the spatial structure by applying global and local tests of spatial autocorrelation. Three tests will be considered for the ESDA analysis (see Anselin 1995; 1996 for more details and mathematical formulas): The first one is the Global Moran’s \(I\) test which measures similarity or dissimilarity in a variable across neighboring spatial units (delegations in our case) (Moran 1948; 1950). A significant positive global Moran indicates positive spatial autocorrelation (neighboring delegations share similar vote shares) while a significant negative global Moran indicates negative spatial autocorrelation (neighboring delegations have dissimilar vote shares). The second test is the Moran scatterplot that gives a visual illustration of the local spatial association and identifies their kind. The Moran scatterplot depicts four different quadrants corresponding to four types of local spatial association between each locality and its neighbours: High-High quadrant (H-H) displays delegations with high values (above the average of the variable) surrounded by delegations with high values; Low-Low quadrant (L-L) displays the delegations with low values (below the average of the variable) surrounded by delegations with low values; Low-High quadrant (L-H) displays the delegations with low values surrounded by delegations with high values; and High-Low quadrant (H-L) displays the delegations with high value surrounded by delegations with low values. The third used test is the Local Indicator of Spatial Association (LISA) (or Local Moran’s \(I_i\)) that gives an indication of significant spatial clustering of similar values around each delegation. The LISA is the most used indicator to measure the local spatial association (clustering) of turnout rates. LISA satisfies two conditions: (i) for each observation \(i\), LISA gives an indication on significant clustering of type H-H or L-L; and (ii) the sum of the \(I_i\) is proportional to the global indicator (Moran’s \(I\)) of spatial association (Anselin 1995).

Turnout, invalid ballots and blank ballots

Choropleth Map of voting
4.2.2 Spatial econometric models: SAR, SEM and SDM specifications
Two main problems are likely to occur when using classical methods to deal with geographical data. First, most area data show some spatial dependence, making the classical methods inappropriate. Second, it is difficult to assume stationarity in any process operating over real geographical spaces (Unwin and Unwin 1998). Spatial econometric models come in three basic varieties, the spatial autoregressive model (SAR), the spatial error model (SEM), and the spatial Durbin model (SDM) (see LeSage and Pace 2009 which provided an extensive introduction to the spatial econometric models).
We start with the standard linear regression model between a dependent variable \(y_i\) (the vote share of each political party) and a set of \(k\) independent variables (poverty rate, the number of political parties, urbanization rate, sex ratio, education, and the age groups):
where (\(i=1,...,N\)), refers to spatial unit (delegation), and \(\varepsilon _i\) are independently and identically distributed (i.i.d) error terms for all \(i\), with zero mean and variance \(\sigma ^{2}\). If we do not consider spatial autocorrelation, the \(\delta =[\alpha \beta ]^{{\prime }}\) vector can be estimated using Ordinary Least Squares (OLS) method.
The most well-known spatial model is the SAR model which assumes the existence of a spatial dependence in the dependent variable. The SAR model can be specified as follows:
where \(Y=(y_1 ,...,y_N )^{{\prime }}\), \(\rho \) is the spatial autoregressive parameter and \(W\) represents a weights matrix defined by the delegation’s neighborhood such that its element \(w_{ij}\) is equal to one when delegation \(i\) is a neighbor to delegation \(j\) and zero otherwise.
A second type of spatial dependence involves correlation across the error terms. In fact, the spatial autocorrelation can arise because nearby locations have unobserved common factors. This formulation is referred to the spatial error model or SEM model written as:
where \(\lambda \) is the coefficient of the spatially correlated errors and \(\mu \) is a Gaussian spatial white noise.
The third type of spatial model is the spatial Durbin model (SDM) which includes both the spatially lagged dependent and independent variables. It can be interpreted as a SAR model augmented by spatially lagged explanatory variables.Footnote 8
The endogeneity in the SDM model makes the interpretations of the estimates richer and more complicated. Specifically, the SDM model allows us to separate the direct impact (within a delegation) of an independent variable on the dependent variable from the indirect (to/from neighboring delegations) impact (LeSage and Pace 2009). Thus, a change in the exploratory variable in delegation (observation) \(i\) will not only exert a direct effect on the vote share level of this delegation, but also an indirect effect on vote share levels in other delegations \(j\ne i\) (see LeSage and Pace 2009 for mathematical demonstration). LeSage and Pace show in addition that the direct impact includes the effect of feedback loops where observation \(i\) affects observation \(j\) and observation \(j\) also affect observation \(i\) as well as longer paths might go from observation \(i\) to \(j\) and back to \(i\).
5 Results
This section is divided into two parts. The first part presents the results of the ESDA analysis. The second presents the results of the non-spatial and spatial econometric models.
5.1 ESDA results
Table 3 presents the results of Moran’s \(I\) computed for the share of the delegation vote for each political party, using different orders of neighbors: first-order neighbors (\(W^{1}\)), second-order neighbors (\(W^{2}\)), and so on (see Getis and Aldstadt 2010 for more details on spatial weight matrices). The aim of using several different forms is to test whether our conclusions are sensitive to the choice of the spatial matrix. As Table 3 shows, the global Moran’s \(I\) is positive and significant at the 1 % level for all political party. The strong positive and significant Moran’s \(I\) confirms the spatial clustering observed in Fig. 2, and implies that voting behavior in Tunisia is spatially clustered. The results shown in Table 3 indicate that the strength of the spatial association decreased for all parties as the number of neighbors increased. Such results are in accordance with Tobler’s first law of geography: ‘everything is related to everything else, but near things are more related than distant things’ (Anselin 1988, p. 8).
Figure 3 displays the scatterplot box for the six parties. For each scatterplot box, the four quadrants represent different types of association between the vote share (\(y_i\)) at a given delegation (\(i\)) and its spatial lag (the weighted average of the vote share in the surrounding delegations (\(Wy_i\)).Footnote 9 The upper right (H-H) and lower left (L-L) quadrants represent positive spatial association. At the first scatterplot box (Ennahdha party), more than 37 % of the delegations (98 out of 264) fall in the upper right quadrant (H-H associations), and almost 12 % of associations fall in the lower left quadrant (31 out of 264). The proportions of H-H associations for the other parties are as follows: PDP (31 %, 81 delegations among 264), Ettakatol (29 %, 76 delegations in H-H quadrant), CPR (27 %, 72 delegations), Petition (25 %) and PDM with 21 %. Except for the last two parties, this pattern suggests a spatial cluster of delegations with positive spatial autocorrelation (with more that 25 % of delegations in the H-H quadrant). Note that neither the global Moran’s \(I\), nor the Moran scatterplot are able to detect the local patterns of association (hot spots). Local Moran’s (\(I_i\)), can be used as a more appropriate local indicators to test the local instabilities in overall spatial association (Anselin 1995).

Moran scatterplot for the six political parties
Figure 4 presents the significant values of the four quadrants of the Moran scatterplot (using a significance level of p-value = 0.01 and 999 permutations). The significant H-H associations exhibit a spatial cluster of delegations with hight vote shares above the national average, while the significant L-L associations correspond to a spatial cluster of delegations with low vote shares below the national average. The most striking result obtained from Fig. 4 is that all delegations of Sidi Bouzid, where the revolution was born, are H-H votes for the Petition list. In addition, these delegations are usually L-L for the other parties (except for PDM list). Further, the delegations of Kairouan and the Western delegations of Sfax are also H-H for the Petition list. The spatial clustering of votes for the Petition list, especially in Sidi Bouzid, may be explained by at least the two following key reasons: the first is that his founder and leader Mohamed Hechmi Hamdi (journalist, media entrepreneur and politician) was born in Sidi Bouzid, and the second resides in the fact that he used his ownership of the popular London-based Al-Mustakillah satellite TV station for the election campaign. The Petition’s leader has also promised Tunisian people a free medical care for everyone and unemployment benefit payment of 200 Tunisian Dinars in return for community service.Footnote 10 His promises have mainly affected the poorest part of the population (more specifically the center Western regions like Sidi Bouzid and Kairouan). The relation between the spatial clustering of Petition votes and poverty rate is clearly observed and confirmed by Fig. 5.

Local Moran’s significance map of poverty rate and Petition vote-share
Contrary to Petition, most of L-L delegations for Ennahdha, CPR and the PDP are located in Sidi-Bouzid, while H-H delegations are to be found in Nabeul, Kebilli for the CPR, and in the Northwest (Beja and jendouba) for the PDP party (Fig. 4). Hotspot clusters of high voter turnouts for Ennahdha (the first map of Fig. 4) are observed in several delegations, more specifically those with high population density, including the Southeastern region, Sfax (Sfax city), Kairouan (Kairouan city), Bizerte (El Alia and Ghar El Melh) and the most popular neighborhoods in Great TunisFootnote 11 (Cité Ettadhamen in Ariana, Douar Hicher in Manouba, Sidi Hcine in Tunis and Fouchana in Ben Arous). Examining the distribution of the votes for the CPR, we can see that it is performed best in the southwestern governorate of Kebili and Nabeul in the north east of Tunisia. The reason for the CPR’s spatial clustering is mainly due to the fact that the CPR’s leader Monsef Marzouki was born in Grombalia (a delegation in Nabeul) and his father is from the Mrazig tribe based in Douz (a delegation in Kebili). The votes for both Ettakatol and PDM are almost concentrated in the same governorates of Great Tunis, and more particularly in the Northeast of Tunis and Ariana.
5.2 Estimation results
Before turning to spatial econometric models, we start with a non-spatial linear regression model and then we test whether the model needs to be extended to consider the spatial effects. We estimated two different models: in the first one (a) the vote share (\(y_i\)) is calculated based on the total number of votes carried out in each delegation, while in the second model (b), \(y_i\) is calculated based on the total number of votes for the six parties in each delegation. Indeed, although the presence of other parties in the NCA is restricted they can affect the voter turnout of the six principal parties at the local level. To capture the political competition at the delegation level, we introduce the variable “number of political parties by delegation” (Nbparties) as an independent variable in model (a) (for model (b) the number of political parties is the same for all delegations). Cox (1999) argued that proportional representation (PR) elections produce more parties which give voters a wider range of choice and more mobilization. However, same research shows that turnout tends to decline when there are more parties (Blais and Aarts 2006). The negative relationship between the number of parties and turnout can be explained by the fact that the presence of multiple parties provides the existence of coalition governments which will diminish voter incentives to turn out to vote (Grofman and Selb 2011).
As mentioned earlier, applying OLS to spatial data may induce inefficient results due to possible spatial dependence. To test the existence of the spatial autocorrelation in our data, we apply the Lagrange Multiplier (LM) test statistics as well as these robust forms to test for a missing spatially lagged dependent variable (LM lag and Robust LM lag) or error dependence (LM error and Robust LM error) (Anselin 1988; Anselin et al. 1996). Both tests are based on the residuals of the OLS model and follow a chi-squared distribution with one degree of freedom (Anselin et al. 1996). As shown in Table 4, both the hypothesis of no spatially autocorrelated error term and the hypothesis of no spatially lagged dependent variable must be rejected at 1 % significance (p-value \(<0.01\) for LM error and LM lag). The robust forms of LM error and LM lag are also significant at 5 % significance (except for CPR and Ettakatol). This indicates that the OLS model is not appropriate and must be rejected in favour of the spatial models, in particular, the SDM model.Footnote 12 Our arguments in favour of the SDM are based on the recent studies of Elhorst (2010) and LeSage and Pace (2009). Elhorst (2010) argues that if the OLS model is rejected in favour of both model (SAR and SEM), then the spatial Durbin model should be estimated. In addition, the SDM model produces unbiased coefficient estimates also if the true data-generation process is a SAR or SEM model. Appendix Tables 6 and 7 show the results of the SAR and SEM models, respectively.
The hypothesis (H: \(\rho = 0\)) that the SDM model can be simplified to the SLX (spatial lag of \(X\)) model that supposes independence between delegation’s vote share, but includes spatially lagged exploratory variables must be rejected at 1 % significance whatever the political party. In addition, the hypothesis that the SDM model can be simplified to the SAR model (H : \(\theta = 0\)) must be rejected (the LR tests with 12 degree of freedom are significant for most parties (Appendix Table 8)). The spatial autoregressive parameter is positive and significant whatever political party (it varies between 0.265 for the PDP and 0.672 for the Petition), which confirms the spatial clustering of votes (Appendix Table 8).
As mentioned above, correct interpretation of the SDM estimated parameters require that we consider both direct and indirect (or spatial spillover) effects. For each of our independent variables (the vote share of each political party), we follow LeSage and Pace (2009, Chap. 2) and calculate the scalar summary measures of direct, indirect and total effects. The estimation results, based on maximum likelihood estimates of the SDM model, are presented in Table 5 for model (a) and Appendix Table 9 for model (b).
The results in Table 5 (model (a)) indicate that the relationship between poverty rate (Headcount variable) and vote share is positive and significant only for the Petition list. The positive and significant direct effect suggests that poor voters within each delegation support more Petition list, who has presented the most generous anti-poverty program. The significant indirect effect of poverty rate provided strong evidence to support our argument that spatial spillovers matter. More specifically, a one-unit increase in the poverty rate in surrounding delegations was associated with an increase in the Petition’s vote share of roughly 0.37 pp. Surprisingly, the relationship between the poverty rate and Petition’s vote share within a delegation (direct effect) was much weaker than the spatial spillover effect. The direct effect is only about 63 % as strong as the spatial spillover effect. A total effect (direct effect + indirect effect) of the poverty rate on Petition’s vote share is positive, suggesting that, every one-unit increase in poverty rate is associated with an increase in Petition’s vote share of roughly 0.6 pp across the contiguous delegations.
The direct effects of the number of political parties for the CPR, PDP and PDM are negative and significant. This finding coincides with those of Jackman (1987) and Blais and Carty (1990) with respect of the impact of multipartyism: the greater the number of parties, the lower the turnout. In addition, for those parties both indirect and total effects are negative and significant. The number of political parties has a positive and statistically significant direct impact on the Petition’s vote share, which means that if the number of political parties by delegation is increased by one the vote share for the Petition list would on average be 0.1 pp higher. There are no significant effects (direct, indirect and total) of the number of political parties on Ennahdha’s vote share. These results are interesting in that they show that Tunisian voters did not find it easy to differentiate the large number of political parties, and they prefer in this context to support the Petition list that promises to them universal health care, free transportation and monthly unemployment benefits. In addition, during the electoral campaign, parties such as the PDP and the PDM have given less attention to socio-economic justice and political rights during their electoral campaign. Their political discourses are more focused on warning voters of the ramifications of Ennahdha’s possible electoral success for the future of civil liberties, notably women’s rights (Aghrout 2014).
The direct, indirect and total effects of the urbanization variable confirm the ESDA results that the vote shares for both PDP and Petition parties are more concentrated in the rural areas, while the votes for Ennahdha are more localized in urban areas, more specifically the most popular areas (such as the three delegations of Great Tunis: Douar Hicher, Cité Ettadhamen, and Fouchana).
In our study, we control for gender distribution by including sex ratio (male-female ratio). Indeed, women played a crucial role in the December 2010–January 2011 uprising in real and the virtual space (protesters, bloggers, and opposition politicians). To support women efforts, the Tunisian transitional government passed a new law on April 11, 2011 that mandated parties have equal numbers of men and women on the electoral lists (the so-called ‘zipper rule’). However, despite this ‘gender parity’ law, only 7 % of the electoral lists were headed by women. Our results show that sex ratio has a positive and significant direct effect on turnout outcomes for the CPR and Ettakatol. Since, for those parties, a higher proportion of men in the population can be associated with higher vote shares. This could be due to the fact both parties have not applied parity at the heads of lists. Ettakatol, for example, have four lists among 33 presided by women, while the CPR presented one woman at the head of its 33 lists. The direct effect is negative for the Petition, Ennahdha and the PDM but not significant.
As to age groups, we find that older people (except those who are 60 and older) are more likely to vote than their younger counterparts. More specifically, the 20–29 age group has a significant negative direct impact on voter turnout for Ettakatol and the PDM. This effect was not significant for the other parties. The vote shares for Ettakatol and the PDM increased amongst those aged between 30 and 38 and those aged between 50 and 59. The results show also that a higher share of the age group 50–59 years in population is positively associated with higher support for the PDP party at 1 % significance level. This positive relationship between turnout age the 50–59 age group can be explained by the fact that people in this age cohort have less career-pressures and leisure time after their children have left the home, which increase their interest in politics.
According to a large body of empirical research on voting behaviour, education is the single most important influence on individual turnout. More specifically, scholars support the conclusion that educated people have a higher tendency to vote than the less-educated (Milligan et al. 2004; Pelkonen 2012). However, the results in Table 5 show that this relationship is not the same across political parties and educational groups (primary, secondary and university degree). The share of the less-educated (primary) population by delegation has a negative and significant direct effect on the vote share of the CPR and Ettakatol parties while positive relations are predominant for the other parties (Ennahdha, PDP and PDM). For the second group, the direct effect remains significantly positive for Ennahdha, while it is negative for the PDM and positive for the CPR party. The direct effect for the best-educated group (university degree) is positive and significant at 1 % level for the three secular parties: Ettakatol, the PDP and the PDM. The results for the secular parties are consistent with previous findings in the electoral behavior that educated people have a higher tendency to vote than the less-educated. For the Islamist party Ennahdha this relationship is not confirmed in our case. An increase of one-unit in the share of population with university degree at the delegation level was associated with a decrease of roughly 0.5 pp in the vote share of Ennahdha.
We also find a strong spatial spillover effect of education on voting, whatever political party. In most cases, more than half of the total effect appears to be accounted for by the spatial spillover across neighboring delegations. Education generates positive externalities between delegations in the form of enhanced political behavior. This is consistent with some previous studies such as Milligan et al. (2004) that have shown that ‘education benefits a representative democracy both by increasing the quantity of citizens’ involvement in the electoral process (increased probability of voting) as well as the quality of their involvement (increased information on candidates and political parties)’.
The difference between the parameter estimates (Appendix Table 8) and the direct impact estimates (Table 5) represents feedback effects that arise as a result of impacts passing through neighboring delegations and back to the delegation itself. The feedback effects are small whatever the independent variable and not likely of economic significance, except for the Petition list which has a high spatial concentration of votes.
6 Conclusion
Although literature and empirical studies suggest that voting behaviors are not independent from space, only a few studies have focused on developing countries, in particular Arab countries. This is due primarily to the paucity of data on voting, and secondly to the dominance of a single political party for a long time in most Arab countries. This paper has sought to take explicit account of spatial dependence in vote share of the six main political parties in Tunisia at the 2011 National Constituent Assembly elections. Regardless of the political party, the exploratory spatial data analyses clearly show that the vote shares are strongly concentrated at the national and local level in Tunisia. More specifically, the highest vote shares for Petition list are observed at the delegations of Sidi Bouzid, Kairouan and the Western delegations of Sfax. High voter turnouts for Ennahdha party are observed in several delegations with high population density, including the Southeast region, Sfax city, Kairouan, and at the most popular neighborhoods in Great Tunis. The results of robust LM tests showed clear evidence that spatial issues should be taken into account and that OLS model must be rejected in favor of the spatial models, more specifically the spatial Durbin model. The econometrics results of the spatial Durbin model show that vote turnouts are strongly related to age cohort and level of educational attainment. While vote turnouts of Petition list are mostly affected by poverty rate. The results also show older voters with high educational attainment are more likely to support Ettakatol and the Democratie Modernist Pole parties. Furthermore, we find that men, unlike women, are more likely to support Congress of the Republic.
Notes
National Democratic Institute: Final report on the National Constituent Assembly Elections.
Instance Supérieure Indépendante pour les Elections.
Decree-law 27 (18 April 2011) establishes the ISIE, including its membership and responsibilities (see the electoral law for more details).
AfDB African Development Bank (AfDB) Group, 2012 ‘Tunisia: Economic and Social Challenges Beyond the Revolution’.
INS, “Mesure de la pauvreté et des inégalités en Tunisie 2000–2010 ” (http://www.ins.tn).
Data available on www.isie.tn.
The 2004 census and the 2005 national survey of household consumption are available on www.ins.nat.tn.
By imposing certain restrictions to the SDM model, we can get the SEM and SAR specifications. In particular, if \(\theta = 0\) the SDM reduces to the SAR model. If the restriction \(\theta =-\rho \delta \) is imposed, the SDM is a simplified representation of SEM model.
We use the first-order neighbors matrix for the Moran scatterplot and local Moran’s significance map. Complete results with higher order neighbor weights are available upon request from the authors.
Ofcom Broadcast Bulletin, Issue 204, 23 April 2012.
Fig. 4 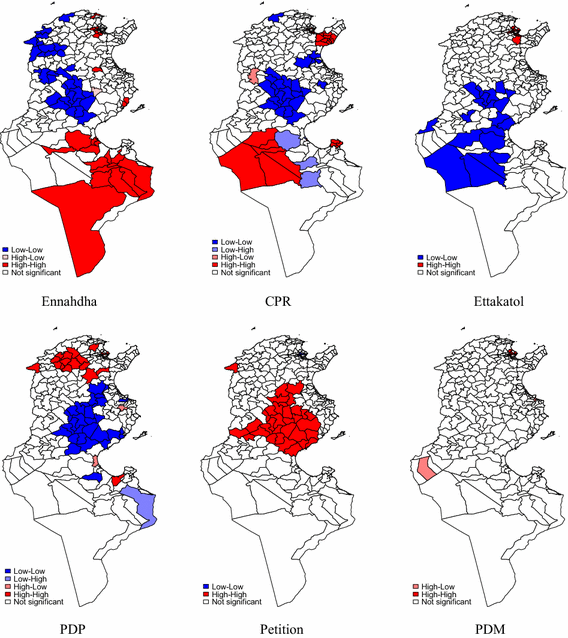
Local Moran’s significance map of vote-share
Great Tunis is composed of the following four governorates: Tunis (the capital), Ariana, Ben Arous and Manouba.
Although the OLS results are not included in this paper, they are available from the authors upon request.
Table 4 Model specification tests: spatial error or spatial lag

References
Aghrout, A.: The National Constituent Assembly election in Tunisia, October 2011. Elect. Stud. 34, 294–299 (2014)
Amara, M., Ayadi, M.: The local geographies of welfare in Tunisia: does neighbourhood matter? Int. J. Soc. Welf. 22(1), 90–103 (2013)
Anselin, L.: Spatial Econometrics: Methods and Models, vol. 4. Springer, Berlin (1988)
Anselin, L.: Local indicators of spatial association-LISA. Geogr. Anal. 27(2), 93–115 (1995)
Anselin, L., Bera, A.K., Florax, R., Yoon, M.J.: Simple diagnostic tests for spatial dependence. Reg. Sci. Urban Econ. 26(1), 77–104 (1996)
Anselin, L.: The Moran scatterplot as an ESDA tool to assess local instability in spatial association. In: Fischer, H.S.M., Unwin, D. (eds.) Spatial Analytical Perspectives on GIS, pp. 111–125. Taylor & Francis, London (1996)
Anselin, L., Sridharan, S., Gholston, S.: Using exploratory spatial data analysis to le-verage social indicator databases: the discovery of interesting patterns. Soc. Indic. Res. 82(2), 287–309 (2007)
Ayeb, H.: Social and political geography of the Tunisian revolution: the alfa grass revolution. Rev. Afr. Polit. Econ. 38(129), 467–479 (2011)
Blais, A., Carty, R.K.: Does proportional representation foster voter turnout? Eur. J. Polit. Res. 18, 167–181 (1990)
Blais, A., Aarts, K.: Electoral systems and turnout. Acta Politica 41(2), 180–196 (2006)
Bühlmann, M., Freitag, M.: Individual and contextual determinants of electoral partici-pation. Swiss Polit. Sci. Rev. 12(4), 13–47 (2006)
Cox, K.R.: The voting decision in a spatial context. Prog. Geogr. 1(1), 81–117 (1969)
Cox, G.: Electoral rules and electoral coordination. Annu. Rev. Polit. Sci. 2(1), 145–161 (1999)
Cutts, D., Webber, D.: Voting patterns, party spending and relative location in England and Wales. Reg. Stud. 44(6), 735–760 (2010)
Darmofal, D.: The political geography of macro-level turnout in American political deve-lopment. Polit. Geogr. 25(2), 123–150 (2006)
Elhorst, J.P.: Applied spatial econometrics: raising the bar. Spat. Econ. Anal. 5(1), 9–28 (2010)
Flint, C.: A timespace for electoral geography: economic restructuring, political agency and the rise of the nazi party. Polit. Geogr. 20(3), 301–329 (2001)
Gana, A., Van Hamme, G., Ben Rebah, M.: Géographie électorale et disparités socio-territoriales : les enseignements des élections pour l’assemblée constituante en Tunisie. L’Espace Politique. Revue en ligne de géographie politique et de géopolitique (18) (2012)
Getis, A., Aldstadt, J.: Constructing the spatial weights matrix using a local statistic. Perspect. Spat. Data Anal. 147–163 (2010)
Gimpel, J., Karnes, K., McTague, J., Pearson-Merkowitz, S.: Distance-decay in the poli-tical geography of friends-and-neighbors voting. Polit. Geogr. 27(2), 231–252 (2008)
Grofman, B., Selb, P.: Turnout and the (effective) number of parties at the national and district levels: a puzzle-solving approach. Party polit. 17(1), 93–117 (2011)
Jackman, R.W.: Political institutions and voter turnout in the industrial democracies. Am. Polit. Sci. Rev. 81, 405–423 (1987)
Johnston, R., Pattie, C., Dorling, D., MacAllister, I., Tunstall, H., Rossiter, D.: Local context, retrospective economic evaluations, and voting: the 1997 general election in England and Wales. Polit. Behav. 22(2), 121–143 (2000)
Johnston, R., Jones, K., Sarker, R., Propper, C., Burgess, S., Bolster, A.: Party support and the neighbourhood effect: spatial polarisation of the British electorate, 1991–2001. Polit. Geogr. 23(4), 367–402 (2004)
Johnston, R.J., Propper, C., Burgess, S., Sarker, R., Bolster, A., Jones, K.: Spatial scale and the neighbourhood effect: multinomial models of voting at two recent British general elections. Br. J. Polit. Sci. 35(3), 487–514 (2005)
Kim, J., Elliott, E., Wang, D.: A spatial analysis of county-level outcomes in US presi-dential elections: 1988–2000. Elect. Stud. 22(4), 741–761 (2003)
Knight, K., Marsh, M.: Varieties of election studies. Elect. Stud. 21(2), 169–187 (2002)
Korotayev, A., Zinkina, J.V.: Egyptian revolution: a demographic structural analysis. Entelequia: revista interdisciplinar (13), 139–169 (2011)
LaGraffe, D.: The youth bulge in Egypt: an intersection of demographics, security, and the Arab Spring. J. Strat. Secur. 5(2), 65–80 (2012)
Leigh, A.: Economic voting and electoral behavior: how do individual, local, and national factors affect the partisan choice? Econ. Polit. 17(2), 265–296 (2005)
LeSage, J., Pace, R.K.: Introduction to Spatial Econometrics, vol. 196. Chapman & Hall/CRC, Boca Raton (2009)
Mabrouk, M.: A revolution for dignity and freedom: preliminary observations on the social and cultural background to the Tunisian revolution. J. North Afr. Stud. 16(4), 625–635 (2011)
Mészáros, J., Solymosi, N., Speiser, F.: Spatial distribution of political parties in Hungary 1990–2006. Polit. Geogr. 26(7), 804–823 (2007)
Milligan, K., Moretti, E., Oreopoulos, P.: Does education improve citizenship? Evidence from the United States and the United Kingdom. J. Public Econ. 88(9), 1667–1695 (2004)
Moran, P.A.P.: The interpretation of statistical maps. J. Royal Stat. Soc. B 10, 243–251 (1948)
Moran, P.A.P.: A test for serial correlation of residuals. Biometrica 37, 178–181 (1950)
Pattie, C., Johnston, R.: ‘People who talk together vote together’: an exploration of contextual effects in Great Britain. Ann. Assoc. Am. Geogr. 90(1), 41–66 (2004)
Pelkonen, P.: Length of compulsory education and voter turnout-evidence from a staged reform. Public Choice 150(1–2), 51–75 (2012)
Reith, N.: Tunisia’s Jasmine revolution: A geo-spatial demographic analysis of protest, vio-lence, and voting patterns. Extended Abstract (Population Association of America, 2013 Annual Meeting Program) (2013)
Sauerzopf, R., Swanstrom, T.: The urban electorate in presidential elections, 1920–1996. Urban Aff. Rev. 35(1), 72–91 (1999)
Shin, M., Agnew, J.: The geographical dynamics of Italian electoral change, 1987–2001. Elect. Stud. 26(2), 287–302 (2007)
Tapiador, F., Mezo, J.: Vote evolution in Spain, 1977–2007: a spatial analysis at the municipal scale. Polit. Geogr. 28(5), 319–328 (2009)
Unwin, A., Unwin, D.: Spatial data analysis with local statistics. J. Royal Stat. Soc. 47(3), 415–421 (1998)
Van Egmond, M., De Graaf, N.D., Van Der Eijk, C.: Electoral participation in The Netherlands: individual and contextual influences’. Eur. J. Polit. Res. 34(2), 281–300 (1998)
Vilalta, C.: The local context and the spatial diffusion of multiparty competition in urban Mexico, 1994–2000. Polit. Geogr. 23(4), 403–423 (2004)
Author information
Authors and Affiliations
Corresponding author
Additional information
This paper is dedicated to the people of Tunisia, and to those who gave their lives for dignity and freedom.
Appendix
Appendix

Map of Tunisia
Rights and permissions
About this article

Cite this article
Amara, M., El Lahga, A. Tunisian constituent assembly elections: how does spatial proximity matter?. Qual Quant 50, 65–88 (2016). https://doi.org/10.1007/s11135-014-0137-1
Published:
Issue Date:
DOI: https://doi.org/10.1007/s11135-014-0137-1