
Abstract
The production of flood hazard assessment maps is an important component of flood risk assessment. This study analyses flood hazard using flood mark data. The chosen case study is the 2013 flood event in Quang Nam, Vietnam. The impacts of this event included 17 deaths, 230 injuries, 91,739 flooded properties, 11,530 ha of submerged and damaged agricultural land, 85,080 animals killed and widespread damage to roads, canals, dykes and embankments. The flood mark data include flood depth and flood duration. Analytic hierarchy process method is used to assess the criteria and sub-criteria of the flood hazard. The weights of criteria and sub-criteria are generated based on the judgements of decision-makers using this method. This assessment is combined into a single map using weighted linear combination, integrated with GIS to produce a flood hazard map. Previous research has usually not considered flood duration in flood hazard assessment maps. This factor has a rather strong influence on the livelihood of local communities in Quang Nam, with most agricultural land within the floodplain. A more comprehensive flood hazard assessment mapping process, with the additional consideration of flood duration, can make a significant contribution to flood risk management activities in Vietnam.
1 Introduction
Flooding occurs when water levels overtop riverbanks, lakes, dams or dykes in low-lying areas during significant rainfall events. Its high frequency and widespread damages impact severely on humans (Jongman et al. 2015). While many structural and non-structural measures have been introduced to reduce these adverse impacts, flooding remains one of the most devastating hazards to affect communities globally (Brody et al. 2008). The global disaster database, EM-DAT (Fig. 1), shows that the frequency of flood and storm events is correlated with economic loss.

Global flood and storm events and economic loss between 1950 and 2016 (compiled from data source in http://emdat.be)
Flood risk poses a threat to many densely populated areas in both low-lying river basins and coastal regions around the world (Maaskant et al. 2009; Islam et al. 2016). The definition of flood risk is a combination of flood hazard, flood exposure and flood vulnerability (Kron 2005; Winsemius et al. 2013; WMO 2013; Budiyono et al. 2014). Global flood hazard and exposure are projected to increase, especially in many low-latitude regions in Asia and Africa (Hirabayashi et al. 2013). Meanwhile, tropical cyclone intensity and rainfall are increasing, whereas the frequency of such large storms appears to be decreasing or unchanged (Knutson et al. 2010).
Vietnam is particularly vulnerable to flood risk, recently ranking eighth in the ten countries most affected by extreme weather events in the 1996–2015 period (Kreft et al. 2016) and fourth in the top 15 countries with the greatest population exposed to river flood risk worldwide (Luo et al. 2015). Flood risk in Vietnam derives from the tropical monsoon characteristic, dense river systems, long coastline and densely populated riverine and coastal areas (Razafindrabe et al. 2012; Chau et al. 2014b). From 1989 to 2015, floods caused significant losses, including 14,867 dead and missing people, with asset damages equivalent to 1% of GDP for Vietnam (Luu et al. 2015).
Geographic Information System (GIS) emerged from the 1960s through the work of Roger Tomlinson in Canada (Wieczorek and Delmerico 2009) and has been widely used all over the world. GIS is considered an essential instrument for spatial analysis and has been applied broadly to natural hazard risk assessment (Finn and Thunen 2014). The combination of flood risk assessment and GIS has been implemented in many recent studies at local scales (Fernández and Lutz 2010; Ward et al. 2010; Budiyono et al. 2014; Papaioannou et al. 2014; Foudi et al. 2015) and global scale (Jongman et al. 2012; Winsemius et al. 2013). Spatial flood risk assessments are useful tools for the identification of at-risk locations and the determination of at-risk components which are a basic foundation to establish relevant mitigation and adaptation measures, (Lindley et al. 2007; Mazzorana et al. 2012; Foudi et al. 2015).
The production of flood hazard assessment maps is a first step towards flood risk assessment (Directive 2007/60/EC). Flood hazard assessment maps can inform local managers, planners and communities about levels of flood hazard areas and taking the appropriate response activities (WMO 2013). Such a map is deemed to be a core tool in developing flood risk mitigation strategies and raising flood risk awareness within communities (Vojinovic 2015).
The traditional method for flood hazard mapping used a hydrological and hydraulic model to show inundation depth and extent for several return periods (Merz et al. 2007; Apel et al. 2008; de Moel et al. 2009; Winsemius et al. 2013; Budiyono et al. 2014). This approach requires many observed and simulated input data and parameters such as meteorological data, river cross-sections and observed discharge (de Moel et al. 2009). These data are often not available for many areas, especially in developing countries with a lack of hydro-meteorological observation stations. Flood hazard maps can also be directly created from flood depth marks and digital elevation model (DEM) (Hagemeier-Klose and Wagner 2009; Ho and Umitsu 2011; Bhuiyan and Baky 2014; Chau et al. 2014b, Shen et al. 2015).
Depth and duration of floods impact severely on the level of flood damage (Lekuthai and Vongvisessomjai 2001; Thieken et al. 2005). The flood depth of disastrous flood events is the most important factor and is always used to assess the flood hazard. Flood duration can seriously affect agriculture areas, particularly paddy field (Kent and Johnson 2001). Orchards or farm produce (Guo et al. 1998) can be destroyed due to a lengthy flood duration. However, previous research has not considered flood duration in flood hazard assessment maps.
Multi-criteria decision-making (MCDM) techniques enable to handle quantitative variables and help decision-makers in solving flood management problems such as formulating their values and preferences, quantifying these priorities and applying them to decision-making processes (Levy 2005). Analytic hierarchy process (AHP) is the most implemented MCDM method in flood risk management field (de Brito and Evers 2016). AHP fundamentally works by developing priorities for multi-criteria evaluated by decision-makers (DMs), stakeholders or experts who are involved in the decision-making process in a given field (Dewan 2013).
AHP is a decision-analysis tool developed by Saaty (1977). The main advantages of AHP are simple GIS integration (Malczewski 1999), direct DMs’ opinion involvement, criteria and sub-criteria systemization and consistency in evaluation (Ishizaka and Labib 2009). Besides these advantages, the method has three main negative aspects. The first disadvantage of AHP is that the judgement and ranking of factors are based on the opinion of domain DMs or experts. The dependence upon personal choice and knowledge can lead to subjective preference in the ranking (Schmoldt et al. 2001; Thanh and De Smedt 2011). The second drawback of this method is a high number of pairwise comparisons required which can become overwhelming with a large number of criteria or alternatives (Harker 1987; Carmone et al. 1997). The third disadvantage is that the approach often forces the analyst to make pairwise comparisons based on very vague or general criteria (Soni et al. 1990; Ishizaka and Labib 2009; Velasquez and Hester 2013). However, most of these limitations exist in all MCDM methods, not only in AHP (Ishizaka and Labib 2009).
Weighted linear combination (WLC) is a broadly applied technique in integrated MCDM-GIS models (Malczewski 2000). The combination of MCDM and WLC can be implemented for spatial analysis of the decision and assessment situations (Malczewski and Rinner 2015). The AHP and WLC can be incorporated into a GIS framework when AHP is utilised to determine weights for the criteria and sub-criteria, and the weighted layers are integrated by WLC technique (Dewan 2013). For example, a combination of AHP and WLC was applied to create flood vulnerability assessment map and flood risk map for Dhaka, Bangladesh (Dewan 2013; Masuya 2014).
This study aims to provide a method to assess the flood hazard in Quang Nam, Vietnam, using flood marks (including both flood depth and duration factors). The AHP method was used to evaluate the criteria and sub-criteria of the flood hazard. The weights of criteria and sub-criteria using AHP method are generated based on the DMs’ opinion. This assessment was combined into a single map using WLC integrated with GIS. Besides flood depth, flood duration has a strong influence on local communities’ livelihood as previously discussed. Therefore, this study included both flood depth and duration factors in generating the flood hazard assessment map. This map can provide information about past events and therefore is essential for emergency response and long-term flood risk management.
2 Study area and flood marks
Quang Nam is one of the most vulnerable provinces to flood hazards in Vietnam (Chau et al. 2014a). This province has a total area of 10,575 km2 and a population of 1.48 million in the year 2015 (Quang Nam Statistical Office 2015). Quang Nam has Vu Gia-Thu Bon river basin and a long coastal line of 125 km. It often faces disastrous flooding, especially during the rainy season from October to December.
Some disastrous floods have been recently recorded in Quang Nam, including the events of the year 1999, 2004, 2007, 2009, 2013 and 2016. Flood depth marks are often collected after serious flood events in Quang Nam. The Project on Building Resilient Societies in Central Region in Vietnam was implemented in 2009 by the Japan International Cooperation Agency and has encouraged this practice (JICA 2009; Chau et al. 2013). The flood duration factor had not been considered or collected in Quang Nam before the year 2013. The Quang Nam Provincial Committee of Natural Disaster Prevention and Control and Search and Rescue (Provincial Committee) collected flood marks for both flood depth and duration factors for the flood event in November 2013 as in Fig. 2.

Source: the Quang Nam Provincial Committee
Flood marks for the 2013 flood event established and collected by the Quang Nam Provincial Committee.
After Super Typhoon Haiyan had affected the Philippines, tropical depression Podul dumped huge amounts of rainfall on provinces in central Vietnam in 14 and 15 November 2013 (Evans and Falvey 2013). The heavy rainfall of 401–793 mm caused severe flooding, deaths and other impacts for Quang Nam, Quang Ngai, Binh Dinh and Phu Yen Provinces. It resulted in 47 people dead or missing, 425,987 damaged houses and 5799 hectares of rice and crop damaged (UN Country Team in Vietnam 2013).
In Quang Nam Province specifically, tropical depression Podul caused 17 deaths, 230 people injured, 91,739 flooded properties, 11,530 ha of submerged agricultural land, 85,080 animals killed and widespread damage to roads, canals, dykes and embankments. The Quang Nam Hydro-meteorological Forecasting Station analysed the historical discharge and water level data from 1980 to 2015 at two hydrology stations on Vu Gia-Thu Bon river basin to draw flood frequency curves. They concluded that the 2013 flood event has the frequency of a 1:20 year event, corresponding to the water level at Giao Thuy hydrology station (Table 1).
The Quang Nam Provincial Steering Committee of Natural Disaster Prevention and Control and Search and Rescue collected 300 flood marks of the flood event on 14–18 November 2013 in seven districts in Quang Nam including Dai Loc, Dien Ban, Duy Xuyen, Hoi An, Que Son, Tam Ky and Nong Son. The location of the 300 flood mark is shown in Fig. 3. Each flood mark has a code, coordinates (longitude and latitude), address, flood depth, flood duration, name of information provider. The 300 collected flood marks contain two factors of flood hazard, flood depth and flood duration.

Location of 300 flood marks for the 2013 flood event collected by the Quang Nam Provincial Committee, Vietnam
3 Methodology
The AHP is used to derive weights of criteria and sub-criteria by evaluation of DMs, stakeholders or experts who involve in the decision-making process (Saaty 1990; Dewan 2013). This method has been the most widely applied MCDM method in determining flood risk (de Brito and Evers 2016). The DMs can evaluate the relative importance or weights of criteria and sub-criteria by their judgements in pairwise comparison tables.
The assessment of AHP depends on the judgements of DMs or experts, so this method is focused on the quality of DMs rather than the quantity of DMs. The AHP assessment can run with very small groups of DMs, such as one DM (Godfrey et al. 2015), three DMs (Kokangül et al. 2017), four DMs (Al-Awadhi and Hersi 2006; Kienberger et al. 2009), five DMs (Plattner et al. 2006), six DMs (Gao et al. 2007; Zou et al. 2012), nine DMs (Papaioannou et al. 2014) and ten DMs (Wang et al. 2011), or run with the author experience-based assessment (Sarker and Sivertun 2011; Kandilioti and Makropoulos 2012; Dewan 2013; Li et al. 2013).
First, an AHP model for flood hazard assessment was designed. Second, data were gathered from DMs. Two staff working in the local committees were recruited to judge criteria according to an AHP questionnaire. Finally, the assessment was incorporated with WLC in a GIS framework to generate a flood hazard map.
The case study is in Quang Nam, Vietnam, so staff working in committees of Natural Disaster Prevention and Control and Search and Rescue at provincial and commune levels in Quang Nam were approached to participate as DMs. Participants are decision-makers in flood risk management in Quang Nam, Vietnam.
The complexity of AHP algorithms’ calculation can be solved by using the Superdecisions software (Whitaker and Adams 2005) and the statistical software R (R Core Team 2016) with ‘ahp’ package (Glur 2017). The AHP pairwise comparison judgements of DMs for flood hazard assessment were analysed using these programs. The weights resulting from the analysis were combined with WLC method using ArcGIS 10.1 software (Environmental Systems Research Institute Inc., USA) to create a flood hazard assessment map. The integrated AHP and WLC was implemented within the GIS environment using Weighted Sum tool through ArcGIS software.
3.1 Group decision-making and the AHP
The AHP was originally introduced by Thomas L. Saaty in 1977 (Saaty 1977) as a robust and flexible technique for supporting priority setting and improving decision-making. This method has been widely used in a variety of areas and recently applied to many studies in flood risk assessment (de Brito and Evers 2016).
The AHP is performed in this study using three main steps (Saaty 2005; Tzeng and Huang 2011):
- Step 1:
-
Construct a hierarchical decision model as in Fig. 4;
Fig. 4 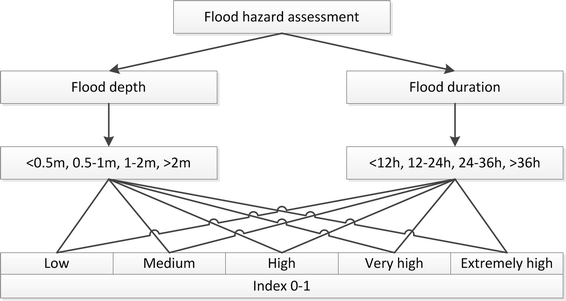
Development of hierarchical decision model for flood hazard assessment for Quang Nam, Vietnam
- Step 2:
-
Develop a paired comparison matrix for criteria or sub-criteria of the decision model as in Eq. (1) based on DMs’ judgement and reciprocal judgement axiom;
- Step 3:
-
Obtain the relative importance or weights of criteria and sub-criteria

The paired comparison matrix in step 2 is \(A = \left[ {a_{ij} } \right],ij = 1,2, \ldots ,n\). The entries \(a_{ij}\) are defined by reciprocal judgement rule if \(a_{ij} = a\), then \(a_{ji} = 1/a,a > 0\) in Eq. (1). The DMs provide their judgements for the pairwise comparison values \(a_{ij}\)
The pairwise judgement scoring is based on the rule of Saaty (1977) with a 9-point scale from 1 to 9 in Table 2. The consistency of judgements is checked by a consistency ratio (C.R.) using Eq. (2). Saaty (1988) suggested that C.R. should be less than 0.1, although the greater consistency does not mean the greater accuracy.
The random index (R.I.) in Eq. (2) is depended on the size of matrices or the number of criteria/sub-criteria n and obtained referring to Table 3 by Saaty (1988).
The consistency index (C.I.) is defined as in Eq. (3)
where λ max is the largest eigenvalue derived from the paired comparison matrix, n is the number of criteria or sub-criteria.
After pairwise comparison judgements of each DM meet the consistency requirement (C.R. < 0.1), it is required to combine the judgements of the group. The AHP allows each DM to specify a value and then combine all individual judgements for the final assessment result according to the geometric mean rule of Saaty (1989) as in Eq. (4).
where 1 … N are decision-makers, \(a_{12}^{1}\) … \(a_{12}^{N}\) are judgements of decision-makers from 1 to N.
3.2 Flood hazard assessment model
There are several studies on creating flood hazard maps in Quang Nam, Vietnam, such as Ho and Umitsu (2011) and Chau et al. (2013). However, only flood depth marks were used to build the flood hazard map; the flood duration factor has not been considered in these maps. This study implemented flood hazard assessment based on both flood depth and flood duration criteria for the flood event in Quang Nam in November 2013. There are four sub-criteria for each criterion. The AHP structured the criteria and sub-criteria into a hierarchical decision model for flood hazard assessment as in Fig. 4.
3.3 The AHP and a GIS framework
Although many MCDA methods are available (Hwang and Yoon 1981), there are only a few theoretical and applied research studies about GIS-MCDA. These include the weighted linear combination, ideal point methods and outranking methods (Malczewski and Rinner 2015). The weighted linear combination (WLC) is the most often used technique for dealing with spatial assessment using MCDM (Malczewski and Rinner 2015). The combination of AHP and WLC in flood risk assessment has been applied in many recent studies (Moeinaddini et al. 2010; Kandilioti and Makropoulos 2012; Rahman et al. 2012; Dewan 2013).
The WLC method is based on the concept of a weighted average (Malczewski 1999, 2006). Each criterion and sub-criterion are handled as a data layer in GIS analysis. A WLC is conducted by multiplying criteria and sub-criteria by the corresponding weights and layers (Dewan 2013). In this study, the integrated AHP and WLC method is used to create flood hazard map using the following equation:
where FHA is the flood hazard assessment index for flood depth and flood duration criteria (Fig. 4), \(w_{i}\) and \(w_{ij}\) are the weights of the ith and jth criterion and sub-criterion and x represents the value of a criterion. The weights represent the relative importance of the criteria and sub-criteria.
4 Results
This study applied the methodology to the case of Quang Nam, Vietnam. First, criteria and sub-criteria for flood hazard assessment were evaluated by judgements of two DMs using pairwise comparison tables as in Fig. 5. Second, flood mark data were incorporated with GIS data including DEM and province border to create a flood depth map and flood duration maps through tools in ArcGIS software as in Fig. 6. Finally, the flood hazard assessment map was built based on the integration of the AHP assessment result and flood depth and duration maps.

Format of AHP pairwise comparisons

ArcGIS model for creating flood hazard map of the 2013 flood event in Quang Nam, Vietnam using ModelBuilder
4.1 AHP assessment result
The pairwise comparison tables for AHP assessment were designed as in Fig. 5 to obtain the weights of flood depth and flood duration criteria and their sub-criteria. The pairwise comparison questions include flood hazard criteria and sub-criteria as the hierarchical decision model in Fig. 4. The criteria for flood hazard assessment include flood depth and flood duration. The sub-criteria of flood depth criterion are < 0, 0–0.5, 0.5–1.0, 1.0–2.0 and > 2.0 m. The sub-criteria of flood depth criterion are < 6, 6–12, 12–24 and > 24 h.
Firstly, the pairwise comparison judgements of each DM were put in a matrix of the Eq. (1) as in Table 4. Second, the result was checked for consistency using Superdecisions software (Whitaker and Adams 2005). This software also evaluated many different areas for their weight or priority, with higher value indicating a more dangerous area (Table 4). After that, the geometric mean of the pairwise comparisons as in the Eq. (4) was used to combine the individual judgements into a representative group judgement.
The Superdecisions software allows the integer number only. The result of the group judgement was not an integer number, so we could not use the Superdecisions software to generate weights. The ‘ahp’ package (Glur 2017) in the statistical software R (R Core Team 2016) was employed to solve this problem. The final weights of criteria and sub-criteria were generated using ‘ahp’ package (Glur 2017). The results are shown in Table 5.
4.2 Flood hazard assessment map
This study used 300 flood marks of 2013 flood event collected from the provincial committee and 10 m DEM resolution to construct flood hazard map for Quang Nam, Vietnam. The spatial analyses for creating the flood hazard map were implemented in ArcGIS 10.1 using ModelBuilder (Fig. 6). ModelBuilder is an application that allows the implementation of a series of analytical procedures and transfers it into a tool. The created tool can be reused for similar analytical processes in other areas or regions. The ModelBuilder enables an explicit modelling process as in Fig. 6. The main disadvantage of ModelBuilder is hard to update, modify and replace parameters. The blue blocks are the input layers, the yellow ones are sequence analytical tools and the green ones are sequence output data as in Fig. 6. The model in Fig. 6 includes ten steps from (a) to (j) with three stages. The details are shown in Table 6.
The flood depth map in Fig. 7 is the result of the geospatial modelling techniques from steps (i) to (f) in stage 1. The flooded areas are located close to and along rivers. The most severe flooded areas are nearby the confluence of Vu Gia river and Thu Bon River in Dai Loc district. The total flooded area in the 2013 flood event in Quang Nam is 60,736 ha, in which 9340 ha of ≤ 0.5 m, 12,977 ha of 0.5–1.0 m, 25,821 ha of 1.0–2.0 m and 12,597 ha of > 2.0 m.

Flood depth map of the 2013 flood event in Quang Nam, Vietnam
The flood duration map in Fig. 8 is the result of the geospatial modelling techniques from steps (g) to (h) in stage 2. The flooded area is near the sea, so the flood duration is not long. The most frequent flood duration level is 12–24 h on 52,574 ha. The flood duration levels of 6–12, > 24 h and ≤ 6 h are on 7740, 388 and 35 ha, respectively.

Flood duration map of the 2013 flood event in Quang Nam, Vietnam
The ArcGIS software has added a WLC tool called Weighted Sum, so the final output as in Fig. 9 was produced from running the Weighted Sum tool using the weights resulted from AHP method. The flood hazard map was created after implementing the geospatial modelling techniques from steps (i)–(j) as in Fig. 6. The flood hazard was quantified based on flood depth and duration factors. The combination of AHP and WLC was implemented within the GIS environment using Weighted Sum tool in the ArcGIS software as in stage 3 with step (j). The areas with no value are non-flooded areas. The higher value an area has, the more significant flood hazard is present.

Flood hazard assessment map of the 2013 flood event in Quang Nam, Vietnam
5 Discussion
The selected case study is Quang Nam Province, Vietnam, since this is one of the most hazard-prone provinces in Vietnam, where significant flooding occurs every year and causes serious impacts on communities. Flooding problems in Quang Nam Province relate to the flow of Vu Gia–Thu Bon river basin. This basin is located in the west of Quang Nam with a total area of 5290 km2. Over the years, successive river floods impacted seriously on the residents’ livelihood and social-economic development. Most flooded areas are the farming areas and densely populated (Fig. 9). The lowland area districts along Vu Gia river and Thu Bon river including Dai Loc, Dien Ban, Hoi An and Duy Xuyen frequently subjected to flooding. Flood duration had not been included in previous studies in this region; this factor was only collected since 2013. The return period of the 2013 flood event is 20 years as in Table 1. The total flooded area in the 2013 flood event in Quang Nam is 60,736 ha (Fig. 7). This result corresponds to the result produced by the Institute Geography in Fig. 10b.

Source: Chau et al. (2014b)
a 100-year flood map created by the Institute of Geography using hydraulic model MIKE11-GIS and b total areas of inundation in Quang Nam, Vietnam.
The flood depth map created in Fig. 7 used flood depth marks and modelling techniques which were applied and validated in the study of Chau et al. (2013). They created a flood depth map using the 86 flood depth marks of the 2009 flood event and 30 m DEM resolution of Quang Nam, and used this result to assess agricultural impacts. The flood hazard maps for Quang Nam, Vietnam, were built on the studies of Ho and Umitsu (2011) and Chau et al. (2013), using only flood depth marks. As discussed previously, flood duration was not considered in their analysis. The present study used 300 flood depth marks from the 2013 flood event and a higher DEM resolution which was built from a contour map at 1:10,000 scale.
As well as combining flood depth and flood duration factors, this study utilised the AHP method for the following reasons: (1) MCDM and GIS combination, (2) DMs’ opinion integration, (3) criteria and sub-criteria systemization and (4) consistency in evaluation by checking the consistency index (C.I.). AHP is the most applied MCDM method in the field of flood risk management (de Brito and Evers 2016). The WLC method was utilised to integrate AHP in a GIS framework. The flood hazard map was generated by considering both flood depth and flood duration using the integrated AHP–WLC with the geospatial analysis model in Fig. 6.
The main limitation of the study relates to the application of AHP pairwise comparisons, something difficult for non-academic persons such as staff of the local committees of Natural Disaster Prevention and Control and Search and Rescue. Although these are the most qualified experts to participate, they are part-time workers and were very difficult to recruit due to the onerous nature of the methodology. That only two experts participated can be viewed as a limitation, but is within the acceptable limits of similar published studies.
The flood hazard assessment map output can support decision-making in water resource planning and flood risk management in Vietnam. Planners and managers need accurate location-based hazard information. The combination of flood duration and flood depth factors in flood hazard assessment for Quang Nam, Vietnam, can lead to a more comprehensive flood hazard assessment than previously available.
The loss of life and injury can be significantly mitigated with proper evacuation plans (Coppola 2015). Evacuation capability among poor communities is particularly important (Masuya et al. 2015; Liu et al. 2017). Flood hazard assessment maps can be combined with housing data and population data to support decision-makers in developing effective evacuation plan for flood-prone areas. It must be emphasised that farmers in Vietnam and in Quang Nam in particular are generally poor. They are highly vulnerable and do not have access to the natural disaster insurance scheme.
The negative consequence of flood hazards can be mitigated through an integrated approach to flood risk management (Dewan et al. 2007). Current management activities in Quang Nam are not adequate to combat flood problems. Decision-making is always based on knowledge; therefore, accurate mapping outputs at local scale for flood risk are essential. If knowledge is available, planners can identify the most at-risk areas, assess the effectiveness of various adaptation measures and design appropriate flood risk mitigation measures.
6 Conclusions
Flood hazard assessment is the first step in flood risk assessment. This study presented an approach to assess flood hazard using flood mark data combined with DMs’ judgements. The assessment was integrated into a GIS framework to provide a flood hazard assessment map. The 2013 flood event in Quang Nam, Vietnam, was used as a case study. The model of DEM and flood depth marks utilised generated a result that corresponds to the hydraulic model MIKE11-GIS.
Flood duration has not been included in flood hazard maps in previous research. An assessment that considers both flood depth and duration factors could provide a more comprehensive perspective on the impacts of flood hazard. A multi-criteria flood hazard assessment and spatial analysis were introduced and applied for Quang Nam, Vietnam, in this study. This methodology can be applied to spatial flood hazard assessment in areas with inadequate data for hydraulic modelling and to generate a preliminary evaluation of flood hazards using flood mark data.
This study analysed flood hazard in the local area, and the findings can be useful in defining specific flood risk management plans for Quang Nam Province. The local flood hazard assessment map can serve as a tool for decision-makers. The results can also be incorporated into a land use map to support land use planning decision-making.
It is important to remember that the local committee officers are local government officers and are DMs in flood risk management activities at the local scale. However, they do not possess expertise in disaster management, and the system does not feature a great deal of accountability. For this reason, subject experts, researchers and scientists should in future be engaged in the decision-making process alongside the committees in future.
Flooding is a common occurrence in lowland areas along the rivers in Quang Nam, Vietnam. The residents are familiar with flooding, and on the other hand, most of them, who are farmers, need flooding for fertilising agriculture land (Tran et al. 2010). The impact of flooding could be considerably mitigated through proactive community-led action. A more comprehensive flood hazard assessment with the consideration of flood duration can support such a proactive flood risk management approach.
References
Al-Awadhi J, Hersi A (2006) Surface runoff hazard map distribution in Kuwait. Manag Environ Qual Int J 17(1):20–30. https://doi.org/10.1108/14777830610639413
Apel H, Aronica GT, Kreibich H, Thieken AH (2008) Flood risk analyses—how detailed do we need to be? Nat Hazards 49(1):79–98. https://doi.org/10.1007/s11069-008-9277-8
Bhuiyan SR, Baky AA (2014) Digital elevation based flood hazard and vulnerability study at various return periods in Sirajganj Sadar Upazila, Bangladesh. Int J Disaster Risk Reduct 10:48–58. https://doi.org/10.1016/j.ijdrr.2014.06.001
Brody SD, Zahran S, Highfield WE, Grover H, Vedlitz A (2008) Identifying the impact of the built environment on flood damage in Texas. Disasters 32(1):1–18. https://doi.org/10.1111/j.1467-7717.2007.01024.x
Budiyono Y, Aerts J, Brinkman J, Marfai MA, Ward P (2014) Flood risk assessment for delta mega-cities: a case study of Jakarta. Nat Hazards 75(1):389–413. https://doi.org/10.1007/s11069-014-1327-9
Carmone FJ Jr, Kara A, Zanakis SH (1997) A Monte Carlo investigation of incomplete pairwise comparison matrices in AHP. Eur J Oper Res 102(3):538–553. https://doi.org/10.1016/S0377-2217(96)00250-0
Chau VN, Holland J, Cassells S, Tuohy M (2013) Using GIS to map impacts upon agriculture from extreme floods in Vietnam. Appl Geogr 41:65–74. https://doi.org/10.1016/j.apgeog.2013.03.014
Chau VN, Cassells S, Holland J (2014a) Economic impact upon agricultural production from extreme flood events in Quang Nam, central Vietnam. Nat Hazards 75(2):1747–1765. https://doi.org/10.1007/s11069-014-1395-x
Chau VN, Holland J, Cassells S (2014b) Institutional structures underpinning flood management in Vietnam. Int J Disaster Risk Reduct 10:341–348. https://doi.org/10.1016/j.ijdrr.2014.10.008
Coppola DP (2015) Introduction to international disaster management. Butterworth-Heinemann, Boston
de Brito MM, Evers M (2016) Multi-criteria decision-making for flood risk management: a survey of the current state of the art. Nat Hazards Earth Syst Sci 16(4):1019–1033. https://doi.org/10.5194/nhess-16-1019-2016
de Moel H, van Alphen J, Aerts JCJH (2009) Flood maps in Europe methods, availability and use. Nat Hazards Earth Syst Sci 9(2):289–301. https://doi.org/10.5194/nhess-9-289-2009
Dewan A (2013) Floods in a megacity: geospatial techniques in assessing hazards, risk and vulnerability. Springer, Dordrecht
Dewan A, Islam MM, Kumamoto T, Nishigaki M (2007) Evaluating flood hazard for land-use planning in Greater Dhaka of Bangladesh using remote sensing and GIS techniques. Water Resour Manag 21(9):1601–1612. https://doi.org/10.1007/s11269-006-9116-1
Directive 2007/60/EC “On the assessment and management of flood risks”, European Commission
Evans AD, Falvey RJ (2013) Annual Tropical Cyclone Report, The Joint Typhoon Warning Center (JTWC). Available at: http://www.usno.navy.mil/NOOC/nmfc-ph/RSS/jtwc/atcr/2013atcr.pdf. Accessed 5 June 2017
Fernández DS, Lutz MA (2010) Urban flood hazard zoning in Tucumán Province, Argentina, using GIS and multicriteria decision analysis. Eng Geol 111(1–4):90–98. https://doi.org/10.1016/j.enggeo.2009.12.006
Finn MP, Thunen D (2014) Recent literature in cartography and geographic information science. Cartogr Geogr Inf Sci 41(4):393–410. https://doi.org/10.1080/15230406.2014.938899
Foudi S, Osés-Eraso N, Tamayo I (2015) Integrated spatial flood risk assessment: the case of Zaragoza. Land Use Policy 42:278–292. https://doi.org/10.1016/j.landusepol.2014.08.002
Gao J, Nickum JE, Pan Y (2007) An assessment of flood hazard vulnerability in the Dongting Lake Region of China. Lakes Reser Res Manag 12(1):27–34. https://doi.org/10.1111/j.1440-1770.2007.00318.x
Glur C (2017) ahp: Analytic Hierarchy Process. R package version 0.2.11, https://CRAN.R-project.org/package=ahp
Godfrey A, Ciurean RL, van Westen CJ, Kingma NC, Glade T (2015) Assessing vulnerability of buildings to hydro-meteorological hazards using an expert based approach – An application in Nehoiu Valley, Romania. Int J Disaster Risk Reduct 13:229–241. https://doi.org/10.1016/j.ijdrr.2015.06.001
Guo Y, Shelton M, Lockhart BR (1998) Effects of flood duration and season on germination of black, cherrybark, northern red, and water oak acorns. New For 15(1):69–76. https://doi.org/10.1023/a:1006535619398
Hagemeier-Klose M, Wagner K (2009) Evaluation of flood hazard maps in print and web mapping services as information tools in flood risk communication. Nat Hazards Earth Syst Sci 9(2):563–574. https://doi.org/10.5194/nhess-9-563-2009
Harker PT (1987) Incomplete pairwise comparisons in the analytic hierarchy process. Math Modell 9(11):837–848. https://doi.org/10.1016/0270-0255(87)90503-3
Hirabayashi Y, Mahendran R, Koirala S, Konoshima L, Yamazaki D, Watanabe S, Kim H, Kanae S (2013) Global flood risk under climate change. Nat Clim Change 3(9):816–821. https://doi.org/10.1038/nclimate1911
Ho LTK, Umitsu M (2011) Micro-landform classification and flood hazard assessment of the Thu Bon alluvial plain, central Vietnam via an integrated method utilizing remotely sensed data. Appl Geogr 31(3):1082–1093. https://doi.org/10.1016/j.apgeog.2011.01.005
Hwang C-L, Yoon K (1981) Multiple attribute decision making: methods and applications. Springer, Berlin
Ishizaka A, Labib A (2009) Analytic hierarchy process and expert choice: benefits and limitations. ORI Insight 22(4):201–220. https://doi.org/10.1057/ori.2009.10
Islam A, Mitra D, Dewan A, Akhter SH (2016) Coastal multi-hazard vulnerability assessment along the Ganges deltaic coast of Bangladesh–A geospatial approach. Ocean Coast Manag 127:1–15. https://doi.org/10.1016/j.ocecoaman.2016.03.012
JICA (2009) Project for Building Disaster Resilient Societies in Central Region, Japan International Cooperation Agency (JICA). Available at: https://www.jica.go.jp/project/english/vietnam/007/index.html. Accessed 2 February 2017
Jongman B, Ward PJ, Aerts JCJH (2012) Global exposure to river and coastal flooding: long term trends and changes. Global Environ Change 22(4):823–835. https://doi.org/10.1016/j.gloenvcha.2012.07.004
Jongman B, Winsemius HC, Aerts JCJH, Coughlan de Perez E, van Aalst MK, Kron W, Ward PJ (2015) Declining vulnerability to river floods and the global benefits of adaptation. Proceed Natl Acad Sci 112(18):2271–2280. https://doi.org/10.1073/pnas.1414439112
Kandilioti G, Makropoulos C (2012) Preliminary flood risk assessment: the case of Athens. Nat Hazards 61(2):441–468. https://doi.org/10.1007/s11069-011-9930-5
Kent RJ, Johnson DE (2001) Influence of flood depth and duration on growth of lowland rice weeds, Cote d’Ivoire. Crop Protection 20(8):691–694. https://doi.org/10.1016/S0261-2194(01)00034-5
Kienberger S, Lang S, Zeil P (2009) Spatial vulnerability units – expert-based spatial modelling of socio-economic vulnerability in the Salzach catchment, Austria. Nat Hazards Earth Syst Sci 9(3):767–778. https://doi.org/10.5194/nhess-9-767-2009
Knutson TR, McBride JL, Chan J, Emanuel K, Holland G, Landsea C, Held I, Kossin JP, Srivastava AK, Sugi M (2010) Tropical cyclones and climate change. Nat Geosci 3(3):157–163. https://doi.org/10.1038/ngeo779
Kokangül A, Polat U, Dağsuyu C (2017) A new approximation for risk assessment using the AHP and Fine Kinney methodologies. Saf Sci 91:24–32. https://doi.org/10.1016/j.ssci.2016.07.015
Kreft S, Eckstein D, Melchior I (2016) Global climate risk index 2017. Germanwatch e.V, Berlin
Kron W (2005) Flood risk = hazard · values · vulnerability. Water Int 30(1):58–68. https://doi.org/10.1080/02508060508691837
Lekuthai A, Vongvisessomjai S (2001) Intangible flood damage quantification. Water Resour Manag 15(5):343–362. https://doi.org/10.1023/a:1014489329348
Levy JK (2005) Multiple criteria decision making and decision support systems for flood risk management. Stoch Environ Res Risk Assess 19(6):438–447. https://doi.org/10.1007/s00477-005-0009-2
Li G-F, Xiang X-Y, Tong Y-Y, Wang H-M (2013) Impact assessment of urbanization on flood risk in the Yangtze River Delta. Stoch Environ Res Risk Assess 27(7):1683–1693. https://doi.org/10.1007/s00477-013-0706-1
Lindley SJ, Handley JF, McEvoy D, Peet E, Theuray N (2007) The Role of Spatial Risk Assessment in the Context of Planning for Adaptation in UK Urban Areas. Built Environ 33(1):46–69. https://doi.org/10.2148/benv.33.1.46
Liu D, Li Y, Fang S, Zhang Y (2017) Influencing factors for emergency evacuation capability of rural households to flood hazards in western mountainous regions of Henan province, China. Int J Disaster Risk Reduct 21:187–195. https://doi.org/10.1016/j.ijdrr.2016.12.008
Luo T, Maddocks A, Iceland C, Ward P, Winsemius H (2015) World’s 15 countries with the most people exposed to river floods, World Resources Institute. Available at: http://wri.org/blog/2015/03/world%E2%80%99s-15-countries-most-people-exposed-river-floods. Accessed 17 April 2015
Luu C, Von Meding J, Kanjanabootra S, Pham D (2015) A proposed flood risk assessment method for Central Vietnam. In: Perera S, Gajendran T, Revez A (eds), In: 5th International conference on building resilience, 15–17 July 2015, Newcastle, Australia
Maaskant B, Jonkman SN, Bouwer LM (2009) Future risk of flooding: an analysis of changes in potential loss of life in South Holland (The Netherlands). Environ Sci Policy 12(2):157–169. https://doi.org/10.1016/j.envsci.2008.11.004
Malczewski J (1999) GIS and multicriteria decision analysis. Wiley, New York
Malczewski J (2000) On the use of weighted linear combination method in GIS: common and best practice approaches. Trans GIS 4(1):5–22. https://doi.org/10.1111/1467-9671.00035
Malczewski J (2006) GIS-based multicriteria decision analysis: a survey of the literature. Int J Geogr Inf Sci 20(7):703–726. https://doi.org/10.1080/13658810600661508
Malczewski J, Rinner C (2015) Multicriteria decision analysis in geographic information science. Springer, Berlin
Masuya A (2014) Flood vulnerability and risk assessment with spatial multi-criteria evaluation. In: Dewan A, Corner R (eds) Dhaka megacity: geospatial perspectives on urbanisation, environment and health. Springer, Dordrecht, pp 177–202
Masuya A, Dewan A, Corner RJ (2015) Population evacuation: evaluating spatial distribution of flood shelters and vulnerable residential units in Dhaka with geographic information systems. Nat Hazards 78(3):1859–1882. https://doi.org/10.1007/s11069-015-1802-y
Mazzorana B, Levaggi L, Keiler M, Fuchs S (2012) Towards dynamics in flood risk assessment. Nat Hazards Earth Syst Sci 12(11):3571–3587. https://doi.org/10.5194/nhess-12-3571-2012
Merz B, Thieken AH, Gocht M (2007) Flood risk mapping at the local scale: concepts and challenges. In: Begum S, Stive MF, Hall J (eds) Flood risk management in Europe. Springer, Dordrecht, pp 231–251
Moeinaddini M, Khorasani N, Danehkar A, Darvishsefat AA, Zienalyan M (2010) Siting MSW landfill using weighted linear combination and analytical hierarchy process (AHP) methodology in GIS environment (case study: Karaj). Waste Manag 30(5):912–920. https://doi.org/10.1016/j.wasman.2010.01.015
Papaioannou G, Vasiliades L, Loukas A (2014) Multi-criteria analysis framework for potential flood prone areas mapping. Water Resour Manag 29(2):399–418. https://doi.org/10.1007/s11269-014-0817-6
Plattner T, Plapp T, Hebel B (2006) Integrating public risk perception into formal natural hazard risk assessment. Nat Hazards Earth Syst Sci 6(3):471–483. https://doi.org/10.5194/nhess-6-471-2006
Quang Nam Statistical Office (2015) Quang Nam statistical Yearbook 2015. Statistical Publishing House, Vietnam
R Core Team (2016) R: A language and environment for statistical computing, R Foundation for Statistical Computing, Vienna, Austria, https://www.R-project.org
Rahman MA, Rusteberg B, Gogu RC, Lobo Ferreira JP, Sauter M (2012) A new spatial multi-criteria decision support tool for site selection for implementation of managed aquifer recharge. J Environ Manag 99:61–75. https://doi.org/10.1016/j.jenvman.2012.01.003
Ramanathan R (2001) A note on the use of the analytic hierarchy process for environmental impact assessment. J Environ Manag 63(1):27–35. https://doi.org/10.1006/jema.2001.0455
Razafindrabe BHN, Kada R, Arima M, Inoue S (2012) Analyzing flood risk and related impacts to urban communities in central Vietnam. Mitig Adaptation Strateg Glob Change 19(2):177–198. https://doi.org/10.1007/s11027-012-9433-z
Saaty TL (1977) A scaling method for priorities in hierarchical structures. J Math Psychol 15(3):234–281. https://doi.org/10.1016/0022-2496(77)90033-5
Saaty TL (1988) What is the analytic hierarchy process? In: Mitra G, Greenberg H, Lootsma F, Rijkaert M, Zimmermann H (eds) Mathematical models for decision support. Springer, Berlin Heidelberg, pp 109–121
Saaty TL (1989) Group decision making and the AHP. In: Golden B, Wasil E, Harker P (eds) The analytic hierarchy process. Springer, Berlin, pp 59–67
Saaty TL (1990) How to make a decision: the analytic hierarchy process. Eur J Oper Res 48(1):9–26. https://doi.org/10.1016/0377-2217(90)90057-I
Saaty TL (2005) The analytic hierarchy and analytic network processes for the measurement of intangible criteria and for decision-making. In: Figueira J, Greco S, Ehrgott M (eds) Multiple criteria decision analysis: state of the art surveys. Springer, New York, pp 345–405
Sarker MZ, Sivertun A (2011) GIS and RS combined analysis for flood prediction mapping–a case study of Dhaka City Corporation, Bangladesh. Int J Environ Protect 1(3):30–42
Schmoldt D, Kangas J, Mendoza GA (2001) Basic principles of decision making in natural resources and the environment. In: Schmoldt D, Kangas J, Mendoza G, Pesonen M (eds) The analytic hierarchy process in natural resource and environmental decision making. Springer, Berlin, pp 1–13
Shen D, Rui Y, Wang J, Zhang Y, Cheng L (2015) Flood inundation extent mapping based on block compressed tracing. Comput Geosci 80:74–83. https://doi.org/10.1016/j.cageo.2015.02.018
Soni R, Parsaei HR, Khosravi-Kamrani A (1990) Economic justification methods for advanced automated manufacturing systems. In: 1990 International industrial engineering conference, pp 146–151
Thanh LN, De Smedt F (2011) Application of an analytical hierarchical process approach for landslide susceptibility mapping in A Luoi district, Thua Thien Hue Province, Vietnam. Environ Earth Sci 66(7):1739–1752. https://doi.org/10.1007/s12665-011-1397-x
Thieken AH, Müller M, Kreibich H, Merz B (2005) Flood damage and influencing factors: new insights from the August 2002 flood in Germany. Water Resour Res 41(12):1–16. https://doi.org/10.1029/2005wr004177
Tran P, Marincioni F, Shaw R (2010) Catastrophic flood and forest cover change in the Huong river basin, central Viet Nam: a gap between common perceptions and facts. J Environ Manag 91(11):2186–2200. https://doi.org/10.1016/j.jenvman.2010.05.020
Tzeng G-H, Huang J-J (2011) Multiple attribute decision making: methods and applications. Chapman and Hall/CRC, Boca Raton
UN Country Team in Vietnam (2013) Viet Nam: Flooding in Central Provinces, Situation Report No.1 (20 November 2013), Available at: http://reliefweb.int/report/viet-nam/viet-nam-flooding-central-provinces-situation-report-no1-20-november-2013. Accessed 5 June 2017
Velasquez M, Hester PT (2013) An analysis of multi-criteria decision making methods. Int J Oper Res 10(2):56–66
Vojinovic Z (2015) Flood risk: the holistic perspective - from integrated to interactive planning for flood resilience. IWA Publishing, London
Wang Y, Li Z, Tang Z, Zeng G (2011) A GIS-based spatial multi-criteria approach for flood risk assessment in the Dongting lake region, Hunan, Central China. Water Resour Manag 25(13):3465–3484. https://doi.org/10.1007/s11269-011-9866-2
Ward PJ, Marfai MA, Yulianto F, Hizbaron DR, Aerts JCJH (2010) Coastal inundation and damage exposure estimation: a case study for Jakarta. Nat Hazards 56(3):899–916. https://doi.org/10.1007/s11069-010-9599-1
Whitaker R, Adams W (2005) Developers of Superdecisions software. Decisions Foundation, Pittsburgh, available at http://www.superdecisions.com/
Wieczorek WF, Delmerico AM (2009) Geographic information systems. Comput Stat 1(2):167–186. https://doi.org/10.1002/wics.21
Winsemius HC, Van Beek LPH, Jongman B, Ward PJ, Bouwman A (2013) A framework for global river flood risk assessments. Hydrol Earth Syst Sci 17(5):1871–1892. https://doi.org/10.5194/hess-17-1871-2013
WMO (2013) Flood Mapping - Integrated Flood Management Tools Series No. 20. World Meteorological Organization (WMO), Geneva, Switzerland
Zou Q, Zhou J, Zhou C, Song L, Guo J (2012) Comprehensive flood risk assessment based on set pair analysis-variable fuzzy sets model and fuzzy AHP. Stoch Environ Res Risk Assess 27(2):525–546. https://doi.org/10.1007/s00477-012-0598-5
Acknowledgements
We would like to thank the Quang Nam Provincial Steering Committee of Natural Disaster Prevention and Control and Search and Rescue for providing us with the invaluable data and to thank the officers in the committees at provincial, district and commune levels for sharing their own practices and experiences in flood risk management activities. We sincerely thank Professor Thomas L. Saaty for his kind reply emails with helpful comments and suggestions on our AHP model and format of AHP pairwise comparisons. Chinh Luu acknowledges the University of Newcastle International Postgraduate Research Scholarship for her research.
Author information
Authors and Affiliations
Corresponding author
Rights and permissions
About this article

Cite this article
Luu, C., Von Meding, J. & Kanjanabootra, S. Assessing flood hazard using flood marks and analytic hierarchy process approach: a case study for the 2013 flood event in Quang Nam, Vietnam. Nat Hazards 90, 1031–1050 (2018). https://doi.org/10.1007/s11069-017-3083-0
Received:
Accepted:
Published:
Issue Date:
DOI: https://doi.org/10.1007/s11069-017-3083-0