
Abstract
The fuzzy linking color histogram considers not only the similarity of different colors from different bins but also the dissimilarity of those colors assigned to the same bin. Moreover, it projects the three-dimension histogram onto the one single-dimension histogram, which reduces the complexity of computation. Spatial fuzzy linking color histogram (SFLCH) combines fuzzy linking color histogram with spatial information that describes the color distribution of pixels in different regions. Meanwhile, the concept “color complexity” is defined in histogram similarity measure in order to add the influence of human vision perception to image retrieval. Compared with other methods, the modified fuzzy color histogram is proved to be more accurate and effective for the content-based image retrieval from the experimental results.
1 Introduction
Content-based image retrieval is a collection of methods for retrieving image from image databases on the basis of characteristics such as color, texture, even semantics etc. Among the characteristics of color images, the color content of an image constitutes a powerful visual cue and the most robust characteristic and can state the distribution of pixel color. So color property of color images is an important characteristic and provides some very important information for image retrieval [13, 26]. Therefore, many researchers have recently used the color property to state the characteristic of an image and developed more accurate image retrieval methods. In image retrieval, the color histogram is one of the common methods using color property [2, 3, 21, 24]. With the advantages of simplicity and invariance to translation and rotation of the image, the color histogram is widely used in image indexing for content-based image retrieval, video scene retrieval and object tracking [14, 19, 28].
The primary weakness of the conventional color histogram is that it is sensitive to noisy interference such as illumination changes and quantization errors, since it considers neither the color similarity across different bins nor the color dissimilarity in the same bin. Furthermore, large dimension or histogram bins can result in extensive computation. To address these issues, the concept called fuzzy color histogram (FCH) has been proposed [1, 7, 9, 11, 17, 25]. FCH considers the color similarity of each pixel’s color associated to all the histogram bins through fuzzy-set membership function. Two main methods are used to FCH production for content-based image retrieval.
Fuzzy c-means algorithm [4, 8, 20] is a classification algorithm based on the idea of finding cluster centers by iteratively adjusting their position and evaluation of an objective function. It is a useful method to produce the fuzzy color histogram. For example, Ju Han and Kai-Kuang Ma [7] determined the bin number of FCH and computed the bins’ membership values by using fuzzy c-means method. Implementations of the scheme are as follows: Firstly, fine uniform quantization was performed by mapping all pixel colors to n’ histogram bins. The bin number n’ is chosen to be large enough so that it makes the color difference between two adjacent bins small enough. Then, these n’ colors were classified to n clusters using fuzzy c-means algorithm with each cluster representing an FCH bin. Finally, a pixel’s membership value to an FCH bin can be represented by the corresponding fine color bin’s membership value to the coarse color bin. Since fuzzy c-means algorithm is very sensitive to the initialization condition of cluster number and initial cluster centers, Khang Siang Tan et al. [25] split the color image hierarchically into multiple homogeneous regions, then merged those regions that are perceptually close to each other to obtain the initialization condition for fuzzy c-means algorithm.
Besides fuzzy c-means clustering method, fuzzy inference system according to Fuzzy logic introduced by Zadeh [29] is also an effective method to create FCH, and this method can be adopted in many applications related to image processing. Konstantinidis et al. [11] proposed to use a small number of bins produced by linking the three elements into a single histogram by means of a fuzzy expert system, and the created FCH was used for content-based image retrieval. The experimental results prove that the method is flexible and tolerant to imprecise data, and can incorporate the expertise easily and efficiently. Maryam Tayefeh Mahmoudi et al. [17] used ordered weighted average (OWA) aggregation operator in fuzzy inference system to create OWA fuzzy linking color histogram which can reveal more detailed information of the image’s content, and which is suitable in situations where the further details of the image are of particular significance.
Generally speaking, in both methods of FCH creation fuzzy c-means clustering method needs to set a series of parameters beforehand and the initial conditions of the parameters have impacts on the cluster results. Meanwhile, the iterative optimization is large in computing capacity when iterations are high. FCH created by fuzzy inference system can contain only one dimension to reduce computational complexity, and the method is relatively easy to implement.
However, the above mentioned two kinds of FCH are all accompanied without the spatial distribution of color across different areas of the image and the change degree of pixel colors in the image. A lot of methods have been developed for merging color feature and spatial information to content-based image retrieval. The standard method which can add spatial information is to split the image into multiple regions and extract color feature from each region. For example, Gong [6] divided the image into several equal sub-images that is represented by the color histogram. Stricker and Dimai [22] presented a novel approach for splitting the image into five non-overlapping regions and use the color descriptors to establish matching procedures. Li [15] gave an algorithm based on assigning sub-images with different similarity weights for object-based image retrieval. Thomas [27] proposed the region-based color descriptors which are compared in order to assess the similarity between two images.
Based on fuzzy logic and image bit-plane theory, this paper proposes a spatial fuzzy linking color histogram (SFLCH) to make the retrieval method more robust and the retrieval results more accurate. SFLCH integrates the fuzzy linking color histogram with the feature of spatial information, and can depict the color distribution and the spatial information of pixels in an image. Moreover, a new similarity measurement is proposed, which adds the influence of human vision perception to image retrieval by assigning the color weight according to the feature of color complexity that describes the degree of pixel color variation in the image. After these improvements, the proposed approach performs better on image retrieval. Overall process diagram of the proposed image retrieval approach is shown in Fig. 1.

Overall process diagram of using SFLCH to image retrieval
Section 2 in this paper introduces the proposed fuzzy color histogram including color space selection, the structure of fuzzy inference system, and the definition and creation method of spatial fuzzy linking color histogram; Section 3 contains the description of color complexity and similarity metric; Section 4 illustrates the experiments and the analysis of the results; and Section 5 states the conclusions.
2 The proposed fuzzy color histogram
In contrast with the conventional color histogram which assigns each pixel into only one of the bins, fuzzy linking color histogram created by fuzzy inference system considers the color similarity information by spreading each pixel’s total membership value to all histogram bins, and links the three components to lead to one output which reduces the complexity of computation. Moreover, SFLCH is proposed to avoid the situation when there is no spatial information that each part of the image has different characteristics. SFLCH is combined with spatial information that describes the color distribution of pixel colors in different regions. For each image, SFLCH creation process involves dividing the original image into multiple sub-blocks of the same size, and then extracting the color features to create fuzzy linking color histogram in each sub-block. The following section gives detailed explanation about SFLCH that includes the creation method of fuzzy linking color histogram and the segmentation way of image.
2.1 SFLCH creation
-
1)
Color space transformation
In order to create fuzzy linking color histogram, we selected CIELAB color space which is a perceptually uniform color space and approximates the way that humans perceive color. Since RGB color space has been most commonly used for representing color images, the color space transformation from RGB to CIELAB needs to be operated pixel by pixel. RGB value cannot be transformed directly to the CIELAB color space, and the transformation process requires the following two steps [5]. Firstly, RGB values are transformed to XYZ tristimulus values as follows:
The CIELAB equation is then applied, which involves the evaluation of cube roots as follows:
where
X 0, Y 0, and Z 0 are tristimulus values of the nominally white object-color stimulus.
In CIELAB, the luminance is represented as L*, the relative greenness-redness as A*, and the relative blueness-yellowness as B*. Figure 2 shows CIELAB color model which is consist of three components. Equations (1) and (2) can also be used to calculate range of CIELAB color space. L* component ranges from 0 to 100, A* component range is [−86.1958, 98.255], and B* component range is [−107.8596, 94.4563].

CIELAB color model with three components
-
2)
Fuzzy inference system
After color space transformation, a fuzzy inference system is used to create fuzzy linking color histogram. The structure of the proposed fuzzy inference system is shown in Fig. 3.

Structure of the proposed fuzzy inference system
In field of image processing, RGB color model has been used extensively. The RGB model lacks the feature of human perception. In the literatures CIELAB model has been suggested as the best representing the visualization results perceived by human eyes. The human eyes are not enough sensitive for each value of three components. The complete range of these colors can be efficiently portioned into the set of colors called ‘bins’. In this paper CIELAB color model has been quantized based on such human perception of color. Human eyes are less sensitive to small variations. In CIELAB color space, visual distance between color and coordinates is proportional. The color between two points is evenly distributed. Based on the color perception, a visualization of CIELAB color model which three components gradually change is demonstrated in Fig. 4. So the luminance (L*), the relative greenness-redness (A*) and the relative blueness-yellowness (B*) of the CIELAB color models are partitioned in 3, 5 and 5 bins respectively.

Quantized CIELAB color model based on human perception
Fuzzification of the input variable is achieved by using triangular member function for three components. L* component can only influence the shades of colors i.e. white, grey and black without contributing to forming any unique colors. Thus, L* is subdivided into only three regions. A* and B* components have more weight than L* component. A* is subdivided into five regions: green, greenish, amiddle, reddish and red. B* is subdivided into five regions: blue, bluish, bmiddle, yellowish and yellow. The coordinate of three components is normalized to [0, 1] according to their ranges for the sake of simple calculation. Membership functions of the inputs are shown in Fig. 5a–c. The output of the system has only 10 equally divided trapezoidal membership functions, as shown in Fig. 5d. Table 1 shows L*, A* and B* values, as well as their fuzzy correspondences for 10 output colors.

Membership function of the inputs (L*, A* and B*) and output (O)
Three components (L*, A* and B*) are linked to lead to the one output of the system in Mamdani type of fuzzy inference according to 27 fuzzy rules [11] which were established through the conclusion of a series of experiments which examine the attributes of various colors in CIELAB color space. The content of the above mentioned Table 1 is part of the experiments. Table 2 lists 27 fuzzy rules and “*” represents any value in the table. The implication factor that determines the process of shaping the fuzzy set in output membership functions based on the results of the input membership functions is set to min, and the OR and AND operators are set to max and min, respectively. The fuzzy rules are evaluated and their outputs are combined through max aggregation operator.
The defuzzification phase is performed by using the largest of maximum (LOM) method, and the resulting fuzzy set is defuzzified to produce output O variable which is a crisp number.
-
3)
Fuzzy color linking histogram definition.
In conventional color histograms, each pixel belongs to only one histogram bin depending on whether or not the pixel is quantized into the bin. The conditional probability P i|j is the probability of the selected jth pixel belonging to the ith color bin. P i|j is defined as a binary equation:
This definition leads to the boundary issues and problems related to the partition size so that the histogram may undergo abrupt changes even though color variations are actually small. This reveals the reason why the conventional color histogram is sensitive to noisy interference such as small changes in the scene and quantization errors. However, in the context of fuzzy linking color histogram, we consider each of pixels in an image related to all the 10 color bins via fuzzy membership functions.
Definition (Fuzzy linking color histogram): .
The fuzzy linking color histogram of image I containing N pixels is represented as FH(I) = [h 1,h 2, ⋯, h 10], where the histogram consists of 10 bins representing (1) black, (2) dark grey, (3) red, (4) brown, (5)
yellow, (6) green, (7) blue, (8) cyan, (9) magenta and (10) white, and where h i represents one of the ten color bins. Since h i is statistics of the degrees of association of all pixels belonging to the ith bin, it can be defined as follows:
where μ ij is the degree of association of the jth pixel belonging to the ith bin. It is the membership value of output of the jth pixel in the ith output membership function.
2.2 Spatial fuzzy linking color histogram
In the above fuzzy linking color histogram, the color features are computed from the entire image so that these global features cannot handle all parts of the image that have different characteristics. The fuzzy linking color histogram specifies the number of pixels in each color bin, but shows no information about the location of these pixels within the image. Therefore, local computation of image spatial information is necessary. This paper proposes the spatial fuzzy linking color histogram (SFLCH) which is combined with spatial information that describes the color distribution of pixel colors in different regions. For each image, the SFLCH creation process can be illustrated as follows. First, the original image I is divided into 9 sub-blocks of the same size, and the image I corresponding to the divided sub-blocks is defined as:
where B k is one of 9 sub-blocks in an image I, and k in turn equals 1 to 9 followed by sub-block from left to right and top to bottom. Second, in each sub-block B k, color features are extracted to create SFLCH according to the previously proposed method. Fuzzy histogram of each sub-block contains 10 bins. This way of splitting image is simple to implement, and combines with the fuzzy linking histogram and spatial information to retrieve image, which has significant meaning in experiments. In other words, an image has a SFLCH totaling 9 × 10 bins, which incorporates spatial information and color distribution to avoid the false-alert retrieval images. For example, Figs. 6, 7 and 8 show three query images and the fuzzy histograms of the entire images, the respective images of the 9 sub-blocks and the resulted SFLCH. One can easily notice the dominant colors in each of the images, but the fuzzy histograms of the entire images can only represent the coarse distribution of colors, and all spatial information is discarded. Nevertheless, the color distribution with spatial knowledge of pixels in an image is important information, and the specific color statistics in each sub-block can be observed in SFLCH which fuses local spatial information.

The images and fuzzy histograms of the bus

The images and fuzzy histograms of the flower

The images and fuzzy histograms of the horse
Figure 6 shows the images and corresponding fuzzy histograms of the bus. Figure 6a is the original image of the bus. In Fig. 6b, bins 3 and 7 are mostly activated because of the red bus and the blue sky in the entire image, but the phenomenon cannot be reflected based on the fact that the blue sky is in the upper portion and that the grey road is in the bottom of the image. When the original image of the bus is divided into 9 sub-blocks (see Fig. 6c), its SFLCH is shown in Fig. 6d. Bin 7 is highly activated in B 1 and B 3, because the blue sky occupies a large proportion of these blocks. Bin 7 is activated in B 2, B 4 and B 6, because the blue sky also exits in these blocks. In B 3 and B 4, bin 3 is less activated because these blocks contain few red parts of the bus.
Figure 7a is the original image of the flower. In Fig. 7b which shows the fuzzy linking color histogram of the entire image, bins 1, 3 and 6 are mostly activated because of the black background, red flower and green leaves in the image. Figure 7d (SFLCH) shows the statistics of colors in 9 sub-blocks image (Fig. 7c). In B 1, bin 6 is highly activated because there are almost only green leaves in this block. Bin 3 is the most activated in B 5 because there is only a red flower in this block. With the same experience in B 7, bin1 is nearly the most activated because of only the black background in this block. B 3, B 4, B 6 and B 9 contain all black background, red flower and green leaves so that bins 1, 3 and 4 are more activated in these blocks.
Bin 6 extracted from Fig. 8a which is the original image of the horse is more activated due to the green trees and grasses in the image. Bin 3 is activated because of the red horse, and bin 4 is activated since the white horse is not actually white but a tone between brown, yellow, and magenta. Figure 8d is the SFLCH of 9 sub-block image (Fig. 8c), in which B 1, B 2, B 3 and B 7, B 8, B 9 own all activated bin 6 because there are most green trees on the top of the image and green grasses at the bottom of the image. B 4, B 5 and B 6 contain horses, trees, grasses and trunks so that the histograms of these blocks include more colors.
As seen from the above examples, SFLCH of 9 sub-block image reflects the color distribution of local regions which are from top to bottom and left to right in an image. Compared with the fuzzy histogram of the entire image, SFLCH contains spatial information and color distribution. After extracting color features of each sub-block to produce SFLCH, we need to calculate the similarity between the query image and the sampled image in the database. Since different parts in an image contribute to different effects on human vision perception, different weights are added to sub-blocks according to their locations in the image. Therefore, the sub-blocks are compared not only through their locations in an image but also using the human visual perception, and this method can rapidly improve the retrieval performance with little influence of the entire color histograms.
3 Similarity measurement
In the following subsections, the proposed similarity measurement is described with two detailed steps: color weight computation and similarity metric.
3.1 Color weight computation
In order to add the influence of human vision perception to image retrieval, a concept called “color complexity” [16] is defined, which describes the color variation degree of the pixel in local image regions. Different color perception sensitivity is shown according to the color complexity in the image, such as Fig. 9. Among these images which have the same color histogram, the change of pixel colors is more and more drastic, and their color complexities are larger and larger accordingly. As the color complexity increases, the sensitivity of human visual perception decreases. Color complexity is an important characteristic of the image and can be used to discriminate the images that have different pixel color variations despite having the same histograms. This paper defines color complexity by calculating the pixel color variation with Gaussian weighting within the local mask, and assigns color weight to each image sub-block using the color complexity value. Color weight vectors are used in SFLCH similarity measure which is formed according to the color distribution and spatial information in the image.

The images with the same histograms and different vision perception
To measure the color complexity of the pixel according to the color perception sensitivity of human visual system in CIELAB color space, color difference between pixels is computed in the first place. Because small Euclidean distance between two pixels in CIELAB color space is proportional to the difference of human visual perception, we form the 3 by 3 mask Ω centered at the pixel p o , and calculate the color difference between the center pixel p o and other adjacent pixel p a in mask Ω by using the following equations:
In the equations, D(p o, p a) represents the color difference between p o and p a , γ that equals to 14 in the experiment is the normalized factor; and E(p o , p a ) is the Euclidean distance in CIELAB color space. In the second place, what’s also calculated is color complexity of the center pixel in mask Ω, which represents the color change degree of pixel co relative to other 8 adjacent points. Meanwhile the Eq. (6) is used as the color difference measure, thus color complexity φ o of pixel p o is defined by the following equation:
where G α denotes the Gaussian weighting function, and its value depends on the distance between the center pixel and other pixels in mask Ω. Large color complexity value represents that there is high spatial pixel color variation in the local neighbor, and small color complexity value means that the pixel is located in the homogenous region. An image is divided into 9 sub-blocks in order to produce SFLCH which considers the spatial information of fuzzy color histogram. After calculating all the pixels color complexity values of each sub-block, color weight is consequently assigned to each pixel of each sub-block with the weighting function as Gaussian kernel function. So color weight of each pixel in a block is defined as follows:
In the equation, B k represents the kth image block, σ is the variance of the color complexity values in B k , and η is the normalizing constant so that the weighting value is normalized to lie within [0,1]. Each sub-block of an image has the weight value that is the sum of the weights of the pixels, and the weight value is mapped to the sub-block. So, the color weight vector in the specific image sub-block is:
where N is the number of pixels in the kth block of the image, and the color weight of the specific image sub-block is normalized. Finally, the color weight vectors of image sub-blocks that are calculated by the Eq. (10) can be used in SFLCH similarity measure.
3.2 Similarity metric
The similarity metric used is histogram intersection, which acts robustly with respect to changes in image resolution, histogram size, occlusion, depth, and viewing point. In the kth block, the similarity ratio SR k belonging to the interval [0,1] can be expressed through the following equation:
where \( {H}_{Q_k} \) and \( {H}_{C_k} \) are the query and challenging fuzzy linking color histograms in the kth sub-block respectively, and N is the number of bins and equals to 10. The entire image similarity measurement corresponds to the human visual perception by using the color weight vectors. The entire image similarity ratio is defined as:
4 Experimental results
The experiments were all run in MATLAB R2011a environment on dual-core CPU (T2390 1.8GHz) and 2G memory. All the images were scaled to the same size using the nearest neighbor interpolation method and were divided equally in order make the split blocks play the equal roles.
4.1 Color components subdivision
In CIELAB color space, L*, A* and B* respectively stand for luminance, relative greenness-redness and relative blueness-yellowness. Since the three components are the input invariables of fuzzy inference system, the crisp inputs are transformed into suitable linguistic values which are viewed as labels of fuzzy sets in fuzzification. The accuracy and runtime of fuzzy inference system associate with the number of linguistic values. Without contribution in providing any unique color, L* is subdivided into only three fuzzy sets, i.e. three linguistic values: black, gray and white. The membership function of component L* is shown as Fig. 5a. While A* and B* are respectively subdivided into 3, 5, 7 fuzzy sets to produce SFLCH in order to select the finest partition.
For example, Fig. 10 shows the original image and the image of 9 sub-blocks of a bus. The sub-block called B k in the image of 9 sub-blocks, k in turn equals 1 to 9 followed by sub-block from left to right and top to bottom. Figure 11 presents the ways and results of different color components subdivision of the bus, including the membership function of components A* and B*, and the corresponding SFLCH. When A* and B* are divided into 3 bins, the fuzzy partition of the input is too rough to retain the detail information in the image. The corresponding SFLCH mainly display two colors: black and dark grey that replace blue, yellow and brown. The red color in the bus and the yellow color in the license plate are lost in B 1, B 9. So the subdivided way of components A* and B* cannot be selected.

The image of a bus

The subdivided ways of A*, B* and the corresponding SFLCH
The last two SFLCHs in Fig. 11 have similar color distribution in every sub-block of the image, when the number of fuzzy sets is set 5 and 7. There is little distinction between the two partitions. Brown and dark grey can be more effectively discriminated when A* and B* are divided into 7 bins. The reason is that the more the number of fuzzy sets is, the more accurate the result of the fuzzy inference becomes. Simultaneously the fuzzy inference system needs more fuzzy rules so that the time of inference is increased. Table 3 shows the quantitative comparison results of three kinds of color components subdivision in fuzzification. Retrieval performance of 7 bins rose 0.03 % over 5 bins while the time has almost doubled. Taken together, the best subdivided way of components A* and B* is that they are respectively divided into 5 fuzzy sets.
4.2 Block size and division
SFLCH not only fuses with spatial information and color distribution but also the corresponding similarity metric measurement adds to the influence of human vision perception. As a result, the combination of both can improve the accuracy and recall of the image retrieval. To check the retrieval efficiency of proposed method, we have to test the performance with a general image database that consists of 10,000 images of 100 categories from the Corel Image Gallery. Corel images have been widely used by the image processing and content-based image retrieval research communities which cover a variety of topics such as “bus”, “horse”, “flower”, “food”, “elephant” etc.
SFLCH adds the spatial information into the fuzzy color histogram through using the partition of the image. So the size of block and dividing procedure are directly influential with the retrieval results. There are two dividing procedures that are adopted to segment the image into several regions. One is overlapping way that defines each of the divided regions by a membership function. For a smooth decrease from 1 to 0 of the membership function, we define Euclidean distance of each pixel to the center of adjacent sub-region as the values of the membership function for a pixel. The other is non-overlapping way that divided the image into the same size of blocks. For both dividing procedures, the number of blocks was set 3, 9, 16 and 25, respectively. Performance comparisons of different block size and dividing procedure are shown as Table 4. For SFLCH, the performance of non-overlapping way is better than the overlapping way. In the event, the retrieval results become more accuracy with the increase in the number of blocks, while the more time is spent on image retrieval. Because the size of the block is smaller, the spatial information is more abundant and the computation is more complex. All reasons considered, we choice the dividing way which the image is divided equally into 9 blocks with non-overlapping.
4.3 Retrieval accuracy
-
1)
Intuitive retrieval result: some of the retrieval results are shown in Figs. 12 and 13 which use the conventional CH, FLCH, and SFLCH respectively. The image at the upper-left corner is the query image, and other 20 images are the retrieval similar images sorted by the similarity ratio SR. The experimental result clearly reveals that the proposed method is much more accurate than other methods for the first 20 returned images of the 10,000 hundred-category test image database.
Fig. 12 
The retrieval results of query image “bus”
Fig. 13 
The retrieval results of query image “flower”
-
2)
Qualitative performance measure: In order to further confirm the validity of the proposed method, we computed average precision [18] to compare the proposed retrieval method with other 3 methods. Firstly, the images of 10 semantic categories from the above image database were collected to compose Test Image Set 2 which consists of 1000 images whose class names are listed in table 5. Secondly, each kind is extracted 10 images as the query images from Test Image Set 2, and the number of retrieval similar images of each query image is set as 20. Then, the average precision of each kind of query results were obtained, which is another aspect of retrieval performance as shown in Fig. 14. As a result, it is not difficult to see that the proposed method is proved to be more accurate than other 3 methods. SFLCH combines the spatial information into FLCH. Experimental results show SFLCH is superior to FLCH. If SFLCH similarity measure does not take into account the influence of human vision perception to image retrieval, it has less precision than the proposed method that adds color weight to each region according to the influence of human vision perception.
Table 5 Class names of Test Image Set 2 Fig. 14 
The average precision of 4 retrieval image methods
Fig. 15 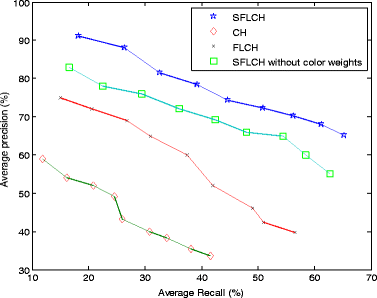
Average precision versus average recall of class 4 (bus) images. The range of the average precision is approximately [65.2, 90.8] and the range of the average recall is approximately [11.8, 65.2] in SFLCH


In addition, precision versus recall graphs (PR graphs) [18] is also a standard evaluation method in image retrieval, and is increasingly used by content-based image retrieval community. Precision drops whereas recall increases in most of the typical retrieval systems, thus the image retrieval method is said to be effective if the precision values are higher at the same recall ones. So we did another experiment to compare the proposed method with other 3 methods that are the same as the ones in the previous experiment. The number of the returned retrieval images was set from 20 to 100, and the average precision versus the average recall of the various images in Test Image Set 2 was calculated in order to point out the change of the precision in respect to recall. The average precision of the retrieval results of class 4 (bus) images with the average recall is shown in Fig. 15. It is clear that the proposed method is significantly superior to other 3 methods.

The changed images
SFLCH which used fuzzy logic to create color histogram is flexible and tolerant to imprecise data. Furthermore, the robustness of SFLCH is tested on various images including the changes of noise, illumination and blur. The example of the changed images is depicted in Fig. 16. The changes include the random noise inserting, the brightness increasing or decreasing and blurring. The performance of SFLCH is the best once again. The accuracy percentages dropped by 4–8 % in the tests, nevertheless most of the changed images were retrieved successfully. The other methods had losses in the region of 20–65 %. That demonstrates that SFLCH compared with the other methods is insensitive to the distortion of the images.
-
3)
Quantitative performance measure: To further measure the performance of SFLCH, we continue to test the proposed method on the other image databaseFootnote 1 which are selected from different sites on the internet, personal photographs or taken by several different digital cameras. The range of topics present in the image database is quite wide and varies including landscapes, sports, concerts and other computer graphics which usually confuse image retrieval systems.
Table 6 describes the quantitative experimental results that compared SFLCH with other 3 methods which use also the color feature in the image retrieval. Color distribution entropy (CDE) [23] considers that pixel patches of identical color are distributed in an image by introducing entropy to describe the spatial information of colors in HSV color space. The experiment results show that CDE give better performance than other methods that measure the global spatial relationship of colors. Color coherent vector (CCV) [10] takes account of the spatial information of pixels, which each histogram bin is partitioned into two types: coherent and incoherent. A color coherent vector represents this classification for each color in the image. CCV shows better comparison rate than the conventional color histogram. Dominant color identification (DCI) [12] considers the foreground of the image only gives semantics compared to the background of the image. DCI based on foreground objects is a meaningful technique to retrieve the images based on color. The retrieval results are associated with the efficiency of segmentation process to separate foreground from background.
From the wide range of tests performed on various image sets, five classes of images are selected because they present the rough width of accuracy percentage of the methods. As one might notice SFLCH dominates the other three methods in Table 6 because SFLCH adds fuzzy logic to color values and spatial information in order to make the proposed method unrestricted in the type of the images, and CIELAB color space represents the visualization results best as perceived by human eyes. Color weights of blocks improve the accuracy of the image retrieval. That shows that the combination of spatial information and fuzzy color histogram can get the better retrieval performance. SFLCH is produced to test the performance in different color spaces. It can be seen from Table 6 that the precision of SFLCH in the CIELAB color space ranges from 88 % to 96 %, and is much higher than that in RGB color space. Due to create the color transform in CIELAB color space, the retrieval time is also more than in RGB color space. While the time is still acceptable, we consider that the SFLCH algorithm performs better in CIELAB color space.
However, the proposed method takes much time to compute the color weights so that it needs more time to execute. In order to reduce the time, the weight of each block is calculated simultaneously because of the independence among the blocks. That is the other reason why we use the non-overlapping division. In addition, the weights of the images are stored in the special database. The color weights need only be calculated once beforehand. SFLCH used only 10 bins to check the similarity among the images so that the proposed method becomes faster and the time down to 326.7 s.
5 Conclusion
In this paper, a color histogram, namely SFLCH, is presented to characterize a color image for content-based image retrieval. The method used in the SFLCH is simple to implement and can be used to completely record the color distribution of pixels in different regions. Furthermore, this modeling system allows concept “color complexity” to be defined as the degree of pixel color variation in local image regions in order to add the influence of human vision perception to image retrieval. Each sub-block is assigned a color weight according to color complexity of pixels in this region and color weight vectors are used in SFLCH similarity measure. Experimental results indicate that the modified fuzzy color histogram can enhance the recognition capability of the image retrieval, and has proved to be more accurate and effective for content-based image retrieval being comparing with other methods. It should be noted that the proposed image retrieval method is particularly appropriate for small shift variants of objects in the images. If the images are too complex, using only color feature is not sufficient. From these results it seems focus of future research should be on adding other features such as texture, shape and invariant feature into the proposed method in order to further improve the retrieval accuracy and expand the applicable scope of the image retrieval method.
References
Das S, Sural S, Majumdar AK (2008) Detection of hard cuts and gradual transitions from video using fuzzy logic. Int J Artif Intell Soft Comput 1(1):77–98
Datta R, Li J, Wang J, (2005) Content-based image retrieval: Approaches and trends of the new age. In: 7th ACM SIGMM international workshop on Multimedia information retrieval, pp. 253–262
David F (2010) Multimedia information retrieval and management: technological fundamentals and applications. Springer, Berlin Heidelberg New York
Dunn JC (1973) A fuzzy relative of the ISODATA process and its use in detecting compact well-separated clusters. Cybern Syst : An Int J 3(3):32–57
Ford A, Roberts A (1998) Color space conversions. Westminster University, London
Gong Y, Chuan CH, Xiaoyi G (1996) Image indexing and retrieval using color histograms. Multimedia Tools Appl 2:133–156
Han J, Ma K-K (2002) Fuzzy color histogram and its use in color image retrieval. IEEE Trans Image Process 11(8):944–952
James C. Bezdek, Robert Ehrlich, William Full (1984) FCM: The fuzzy c-means clustering algorithm. Computers and Geosciences10(2–3):191–203
Kim W, Kim C (2012) Background subtraction for dynamic texture scenes using fuzzy color histograms. IEEE Signal Process Lett 19(3):127–130
Kodituwakku SR, Selvarajah S (2004) Comparison of color features for image retrieval. Indian J Comput Sci Eng 1(3):207–211
Konstantinidis K, Gasteratos A, Andreadis (2005) Image retrieval based on fuzzy color histogram processing. Opt Commun 248(4):375–386
Krishnan N, Banu MS, Callins Christiyana C (2007) Content based image retrieval using dominant color identification based on foreground objects. Conference on Computational Intelligence and Multimedia Applications. Int Conf IEEE 3:190–194
Lee H-Y, Kang IK, Lee H-K, Suh Y-H (2005) Evaluation of feature extraction techniques for robust watermarking. Lect Notes Comput Sci 3170:418–431
Leichter I, Lindenbaum M, Rivlin E (2010) Mean shift tracking with multiple reference color histograms. Comput Vis Image Underst 114(3):400–408
Li X (2003) Image retrieval based on perceptive weighted color blocks. Pattern Recogn Lett 24(12):1935–1941
Lo C-C, Wang S-J (2001) Video segmentation using a histogram-based fuzzy c-means clustering algorithm. Comput Stand Interfaces 23(5):429–438
Mahmoudi MT, Beheshti M, Taghiyareh F, Badie K, Lucas C (2013) Content-based image retrieval using OWA fuzzy linking histogram. J Intell Fuzzy Sys 24(2):333–346
Mülle H, Müller W, David MG, Squire SM-M, Pun T (2001) Performance evaluation in content-based image retrieval: overview and proposals. Pattern Recogn Lett 22(5):593–601
Rasheed W, An Y, Pan S, Jeong I, Park J, Kang J (2008) Image retrieval using maximum frequency of local histogram based color correlogram. In: 2nd International Conference on Multimedia and Ubiquitous Engineering 322–326
Ruspini EH (1970) Numerical methods for fuzzy clustering. Inf Sci 2(3):319–350
Smeulders AWM, Worring M, Santini S, Gupta A, Jain R (2000) Content-based image retrieval at the end of the early years. IEEE Trans Pattern Anal Mach 22(12):1349–1380
Stricker M, Dimai A, (1996) Color indexing with weak spatial constraints. In: SPIE Conference on Storage and Retrieval for image and Video Databases, pp. 29–40
Sun J, Zhang X, Cui J et al (2006) Image retrieval based on color distribution entropy. Pattern Recogn Lett 27(10):1122–1126
Swain MJ, Ballard DH (1991) Color indexing. Int J Comput Vis 7(1):11–32
Tan KS, Lim WH, Isa NAM (2013) Novel initialization scheme for Fuzzy C-Means algorithm on color image segmentation. Appl Soft Comput 13(4):1832–1852
Theoharatos C, Laskaris NA, Economou G, Fotopoulos S (2005) A generic scheme for color image retrieval based on the multivariate Wald-Wolfowitz test. IEEE Trans Knowl Data Eng 17(6):808–819
Thomas D, Daniel K, Hermann N (2008) Features for image retrieval: an experimental comparison. Inf Retr 11(2):77–107
Yoo H-W, Cho S-B (2007) Video scene retrieval with interactive genetic algorithm. Multimedia Tools Appl 34(3):317–336
Zadeh L, (1965). Fuzzy sets and systems. Proc. Sympos. on System Theory 29–37
Acknowledgments
This work was supported by Talent Special Foundation of Taiyuan Science and Technology Project No.120247-28.
Author information
Authors and Affiliations
Corresponding author
Rights and permissions
About this article

Cite this article
Zhao, J., Xie, G. A modified fuzzy color histogram using vision perception variation of pixels at different location. Multimed Tools Appl 75, 1261–1284 (2016). https://doi.org/10.1007/s11042-014-2367-6
Received:
Revised:
Accepted:
Published:
Issue Date:
DOI: https://doi.org/10.1007/s11042-014-2367-6