
Abstract
Observations of Comet C/2010 X1 (Elenin) in August 2011 showed a pattern of evolution of coma morphology into an expanding, amorphous cloud of rapidly decreasing surface brightness shortly before perihelion passage, similar to C/1999 S4 (LINEAR) in 2000. However, the comet’s difficult viewing geometry at the time of disruption made it impossible to study the event using high-resolution imaging techniques and, in particular, to measure the ratio of dust to cometessimals which gives information on the internal structure of the nucleus before disruption. We report Herschel/PACS observations of the defunct Comet C/2010 X1 (Elenin), aimed at detecting its infrared ghost: the debris cloud and any remaining inert, or low-activity cometessimals that may have been released in the break-up of the nucleus, taking advantage of the comet’s close pass to Earth in mid-October 2011. These observations would have allowed us to detect, potentially, both individual surviving inert fragments of the nucleus of ≈260 m diameter (and significantly smaller, active cometessimals) and the expanding dust cloud, being particularly sensitive to coarse dust and boulders in the millimetre to metre size range. No discrete bodies were detected by Herschel to this limiting size.
1 Introduction
Comet C/2010 X1 (Elenin) was discovered on December 10th 2010 (Elenin 2010). The comet was found to be a dynamically new object from the Oort Cloud with a slightly hyperbolic (e = 1.000063 ± 0.000002 at epoch 2011-Mar-31.0) orbit, although the original and future orbits are closed. The comet’s orbit showed that it would have a relatively small perihelion distance—0.482AU, on 2011 September 10—giving rise to the possibility that the comet could become a naked-eye object after perihelion, as the comet was predicted to make an approach to the Earth to 0.234AU on 2011 October 16. JPL#37 orbit solution showed a Minimum Orbit Intersection Distance of just 0.0306AU. However, determinations of the gas and dust production rate at 2.92AU (Korsun et al. 2012) were already suggesting that the expectations of activity close to perihelion that had been raised on discovery were unlikely to be realised.
Ground-based observations of the comet taken between 17 and 22 August 2011 (24 and 19 day respectively before perihelion passage), showed a pattern of evolution of coma morphology into an expanding, amorphous cloud of rapidly decreasing surface brightness (Mattiazzo and McNaught 2011). This was similar to the behaviour observed in comet C/1999 S4 (LINEAR) during its disruption event at perihelion in 2000 (e.g. Weaver et al. 2001 and references therein). Unfortunately, the comet’s difficult viewing geometry at the time of disruption (solar elongation dropping from 36° to 33°) made it impossible to study the event using high-resolution imaging techniques either from the ground, or from space. Thus, at the time of disruption the comet was only visible to ground-based observers in twilight at high airmass and was inaccessible to the Hubble Space Telescope. However, observations taken at the time of break-up with the CFHT have since shown that there were no detectable fragments of diameter ≈ 80 metres and suggest a nucleus diameter before breakup of 1.2 km diameter. The mass of the debris cloud was dominated by large fragments, while small fragments dominated its total scattering cross-section (Li and Jewitt 2015). High spatial resolution observations are fundamental to study the internal structure of the nucleus via the dust to cometessimal mass ratio.
Further imaging, made on October 9th and 10th, as the comet came into the morning sky after perihelion, revealed the presence of a remnant of the disruption, in the form of a faint patch of diffuse nebulosity, 14 × 8 arcmin in size, in the line of variation of the comet, elongated in PA290° and co-moving with the expected position of the comet. This was interpreted as being a synchrone from a brief disruption event around 16 ± 4 August (Sekanina 2011), consistent with the photometric event observed by Mattiazzo and McNaught (2011), combined with previously released material in the orbital plane of the comet. Sekanina (2011) made an order of magnitude estimate from reported CCD photometry of the cloud that the total cross-sectional area of the dust released was ~480 km2 and the mass of the cloud ~109 kg.
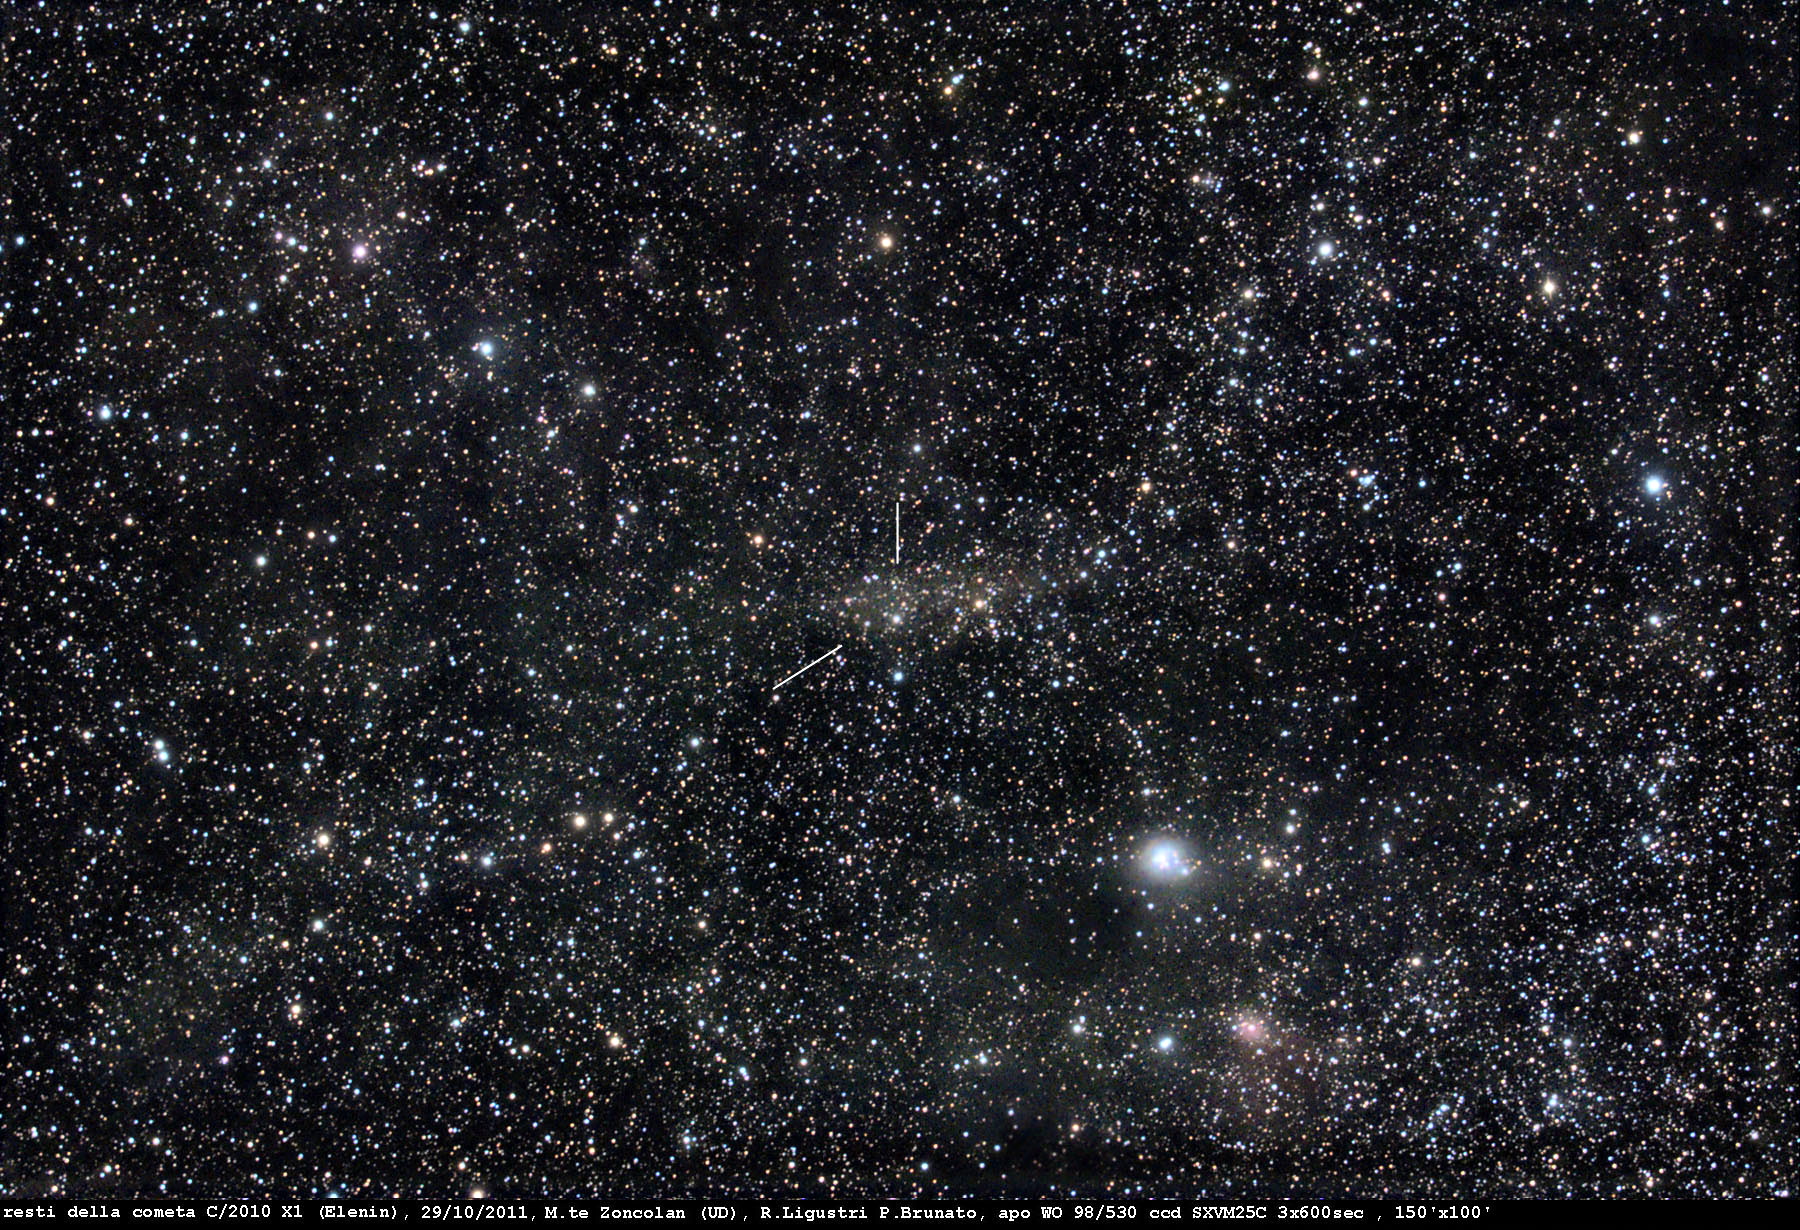
Numerous observers confirmed the presence of the faint debris cloud during the second half of October (some sample images and animations can be found at the url: http://www.observadores-cometas.com/cometas/2010x1/imagenes/2010x1.html), however the Galactic Latitude of the comet decreased rapidly at this time, making the debris cloud increasingly difficult to detect against the dense stellar background in late October. The comet crossed the Galactic Plane on 2 November 2011, although the last reported faint detection of the debris cloud was made on 29 October 2011 (Ligustri and Brumato 2010).
2 Observations
The close approach of the comet to the Earth in mid-October 2011 offered the opportunity to search for a potential far-infrared ghost of C/2010 X1 (Elenin). When it became clear that the nucleus of the comet had been completely disrupted Target of Opportunity (ToO) Time was requested and granted with the Herschel Space Observatory (Pilbratt et al. 2010). It should be noted that these observations were designed and scheduled before the detection of the visible debris cloud and hence were made without the benefit of knowledge of the debris cloud from ground-based observations.
The proposed observations with Herschel offered two opportunities to detect any remnant of the comet: any discrete fragments larger than ~100 m with residual activity or, slightly larger fragments, according to emissivity, that were no longer outgassing would be detectable to Herschel as point sources—this was the typical size of the largest micro-comets observed within the debris cloud of C/1999 S4 (LINEAR); similarly, a cloud of centimetre to metre-sized gravel/boulders of sufficient density would reveal itself as a diffuse area of far-IR emission similar to that which was eventually detected visually.
The observations with Herschel were taken with the PACS photometer (Poglitsch et al. 2010) on October 19th 2011, corresponding to spacecraft OD-888 (see the observing log in Table 1). We scanned along the comet’s orbit, centred on the predicted position from the final JPL #37 orbit solution, with Herschel tracking on the comet’s predicted differential motion of −485.1 arcs/h in Right Ascension and 145.5 arcs/h in Declination. However, it should be cautioned that this orbit solution did not include the astrometry made after the comet’s disruption, which indicated a significant, but essentially unquantifiable post-disruption non-gravitational acceleration of the centre of light in the sense of a delay along the orbit. By scanning along the comet’s track it was hoped that the uncertainty in the possible position of the debris cloud due to the unknown non-gravitational component of motion of any remnant would be mitigated.
The Astronomical Observation Request (AOR) design is shown in Fig. 1. Each scan map consisted of 10 scan legs, each of 20 arcmin length along the direction of the comet’s motion, centred on the nominal position of the comet, with each scan leg separated by 4 arcs in the cross-scan direction. The observing pattern was repeated 14 times to give the final scan map. Data was obtained simultaneously at 70 and 160 μm, with pixel scales of 3.2 and 6.4 arcs/pixel respectively at 70 and 160 μm, although our sensitivity at 160 μm is much lower as we are further from the peak of black body emission.

The design of the observation, superimposed on a Deep Sky Survey R frame for the mid-time of the observation. The green line is the expected track of the comet according to the JPL#37 ephemeris. The magenta lines are the overlay of the scans, each 20 arcmin long along the predicted motion of the comet, centred on the comet’s nominal position at the mid-time of the exposure. The comet’s position at the start of the exposure is marked in green, at the mid-time in blue and end of exposure, in orange, with each scan map being composed of 10 scan legs separated by 4 arceconds. The full field of view covered in the frame of the comet was 22.0 arcmin long by 4.1 arcmin high, although the sensitivity at the edges of the map is much lower, as this area has less coverage
The observing log is shown in Table 1. Observations started 55 h after closest Earth approach, with the comet at Δ = 0.2326AU, r = 0.9954AU at mid-exposure, 38 days after perihelion. The Herschel-centric phase angle was 86°.0. The total integration time was 3.1 h, giving a 3σ point source sensitivity in the centre of the field of 2.3 mJy at 70 μm and 5.0 mJy at 160 μm.
The observations were scheduled on the first day of a PACS photometer observing block, as close to the moment of closest approach to Earth as possible. Examination of IRAS 60 μm images shows that this coincided with the comet crossing in front of a particularly dark area of infrared cirrus background without significant structure, maximising contrast between the comet and background. A reduction of the scans in the reference frame of the background sources shows that there are no bright 60 μm galaxies in the field of view of the scans (as can be seen in Fig. 2).

A 70 μm image of the full field of view of the scan map, 45 arcmin long, along the comet’s orbit, without differential tracking applied. A few, quite faint, point sources are detected that we believe to be background galaxies, but no bright galaxies are seen that would trail detectably across the image when differential tracking is applied
3 Results
The resultant scan maps were processed with HIPE 13 (Ott 2010). Two different reduction methods were used. The first one makes use of a high pass filtering of the bolometer timelines in order to filter out the 1/f noise: it provides the best sensitivity for point-like sources at the expense of filtering out extended emission, if present (see Fig. 3, projected in the reference frame of the comet). The second reduction used two distinct packages, Scanamorphos (Roussel 2013) and JSCANAM (Gracia-Carpio et el. 2015), that preserve extended emission at all scales—but they do not work optimally on single direction scans such as these, requiring scan and cross-scan for optimum results, hence we lose sensitivity to extended emission with the selected AOR design. The reduction with Scanamorphos and with JSCANAM gives similar results.

The final PACS 70 μm scan map of C/2010 X1 (Elenin), tracked on the comet’s motion and processed to remove gradients in the background emission. The final map shows a flat field with no discrete point sources detected. The 3σ detection limit in the centre of the field is 2.3 mJy. The differential motion of the comet of 506 arcs/h trails background galaxies to the extent that none of the sources seen in Fig. 2 are detected in this image. The total region of sky covered is 22 arcmin long by 4.1 arcmin high, with reduced coverage at the edges of the map
Figure 3 shows the resulting reduced scan map in the 70 μm band. Note that the background flux is normalised to zero in HIPE processing. No point sources are detected. The limiting flux for a point source in the centre of the field is 2.3 mJy.
The reduced 70 μm image obtained using JSCANAM to look for possible faint, extended emission is shown in Fig. 4 with a sky coordinate grid and in Fig. 4 with the comet’s nominal position and track marked. We note that the brightest patch of emission in the field of view does trail the comet in its orbit, extending over an area of ~6 arcmin length and 50 arcs wide. Its brightest point is located ~6 arcmin trailing the comet, approximately consistent with the position of the peak intensity of the cloud reported by Sostero et al. (2011). However, as this possible feature is at the limit of detection—the mean flux in a 85 arcs circular aperture centred on the area of brightest possible emission is 0.50 mJy/pixel, whereas the mean of eight apertures at randomly selected points around the image is 0.43 ± 0.025 mJy/pixel—it is not clear whether it is simply an artefact of processing, or genuine weak emission from the remnant of the comet.

The reduced image from JSCANAM 70 μm processing, plotted on a grid of celestial coordinates. Note that the coordinates correspond to the time of the start of the integration. The nominal position of the comet from the JPL orbit solution #37 is marked in the centre of the image. The track of the comet is shown in red, with an arrow marking its direction of motion during the integration. The brightest area in the 70 μm image is a diffuse patch of weak emission, centred on a point trailing the comet by ≈6 arcmin and ≈0.5 arcmin N of the comet’s track, however, both processing artefacts and genuine, weak cometary emission could produce such a structure, so it is by no means clear that it is real
4 Discussion
Although most comets exhibit a (relatively) predictable behaviour, a minority of objects deviate considerably from the norm, either by showing sudden outbursts in brightness or, more rarely, by fading unexpectedly or disrupting completely. The archetypal event in this last category was the intensely observed sudden disruption of Comet C/1999 S4 (LINEAR) in July 2000 (Weaver et al. 2001). As it passed perihelion: it was found to have disintegrated into a cloud of faint cometessimals plus an expanding dust cloud, which faded rapidly, becoming undetectable within 20 days of disruption; we should caution though that the observations described here were taken at a much later epoch of ≈64 days after disruption. Our observations of C/2010 X1 (Elenin) allow us to put a strong upper limit on the maximum size of the building blocks of the nucleus and to contrast this with C/1999 S4 (LINEAR) and with the predictions of the rubble pile model (e.g. Weissman 1986; Samarasinha 2001), while at the same time potentially measuring directly the amount of coarse dust released on disruption.
If we take a 2.3 mJy limiting flux at 70 μm for detection, we calculate that an inert object with 230 m diameter (115 m radius) with 5 % albedo and at Delta = 0.238 AU (in this case, the comet-Herschel separation), r = 0.992 AU, Phase angle = 86°, would produce 2.3 mJy. This is based on a simple Thermophysical Model (TPM) code with a beaming parameter of 0.756 and a Standard Thermal Model (STM) phase angle correction. We use 86 deg which is the Herschel-centric phase angle on 2011-Oct-19 at 4:00 UT, the mid-time of the integration.
We can test various alternative models by varying the model parameters slightly. For example, varying the albedo from 3 to 10 % makes no significant difference to this result. The crucial factors here are the phase angle correction (STM: 0.01 mag/deg) and the beaming parameters (STM: 0.756): see Lebofsky et al. (1986). Even increasing the beaming parameter by a factor of 2 only increases the minimum detectable size to 260 m. This value is consistent with the predicted maximum size of building blocks predicted by rubble pile models. Cometessimals with residual activity, as observed in C/1999 S4 (LINEAR), would have been detected to a smaller diameter: no evidence of the possible existence of such cometessimals is seen.
If we take the total cross-sectional area of the debris cloud estimated by Sekanina (2011) and apply a simple scaling of the TPM model results above to the debris cloud, we would expect an integrated flux of ~25 Jy over its surface area. For the 14 × 8 arcmin extension of the cloud given by Sostero et al. (2011)—although other observers, e.g. Muler (2011) find a much narrower, cigar-shaped structure, identifiable with the synchrone from the disruption event) the mean surface brightness of the debris cloud at 70 μm would be ~0.06 mJy/arcs2: this would, at best, be only marginally detectable by Herschel. The peak flux at this position seen in Fig. 4 is consistent with a non-detection by Herschel of the brightest part of the debris cloud.
5 Conclusions
We have searched for far-infrared emission from the debris cloud left by Comet C/2010 X1 (Elenin), We do not detect any discrete fragments of the comet at 70 μm, giving a hard upper limit of ≈250 m for the diameter of the largest remaining inert fragments, consistent with the results of the break-up of C/1999 S4 (LINEAR) and the predictions of rubble pile models. We can put a much stronger upper limit on any remaining active cometessimals within the debris cloud: any such objects larger than ≈100 m, similar to those detected in C/1999 S4 (LINEAR), should have been detected, although it is unlikely that cometessimals would have maintained their activity 2 months after perihelion unless extremely icy.
Although there is possible, extremely weak diffuse emission at the approximate position of the debris cloud observed in the visible, we cannot rule out this brighter area is not an artefact of processing. We prefer to say that we do not make a clear infrared detection of the debris cloud, consistent with the parameters for the cloud derived by Sekanina (2011).
The rapid fade of the cometary coma and the lack of a morphological structure at the nominal position of the nucleus after disruption similar to that seen in C/1999 S4 (LINEAR) suggest that the post-disruption coma did not harbour active cometessimals. When combined with our non-detection of fragments, this leads us to suggest that the building blocks of the nucleus of C/2010 X1 (Elenin) were either smaller than those of C/1999 S4 (LINEAR)—as suggested too by the results of Li and Jewitt (2015)—or less icy. In either case this is consistent with an icy rubble-pile model.
References
L. Elenin, IAUC 9189 (2010)
J. Graciá-Carpio, M. Wetzstein, H. Roussel, The JScanam Map-Maker method applied to Herschel/PACS photometer observations, in Proceedings of ADASS XXV; to be Published in ASP Conf. Ser., ed. by N.P.F. Lorente, K. Shortridge. arXiv:1512.03252v1
P.P. Korsun, I.V. Kulyk, A.V. Moiseev, V.L. Afanasiev, Astrophys. Bull. 67, 414 (2012)
L.A. Lebofsky, M.V. Sykes, E.F. Tedesco, G.J. Veeder, D.L. Matson, R.H. Brown, J.C. Gradie, M.A. Feierberg, R.J. Rudy, Icarus 68, 239 (1986)
J. Li, D. Jewitt, AJ 149, 133 (2015)
R. Ligustri, P. Brumato (2010). http://www.observadores-cometas.com/cometas/2010x1/imagenes/C2010X1-111029-rl.png
M. Mattiazzo, R. McNaught, CBET 2801 (2011)
G. Muler, (2011). http://www.observadores-cometas.com/cometas/2010x1/imagenes/C2010X1-111023-J47.avi
S. Ott, ASP Conf. Ser. 434, 139 (2010)
G.L. Pilbratt, J.R. Riedinger, T. Passvogel, G. Crone, D. Doyle, U. Gageur, A.M. Heras, C. Jewell, L. Metcalfe, S. Ott, M. Schmidt, A&A 518, L1 (2010)
A. Poglitsch, C. Waelkens, N. Geis et al., A&A 518, L2 (2010)
H. Roussel, PASP 125, 1126 (2013)
N.H. Samarasinha, Icarus 154, 540 (2001)
Z. Sekanina, CBET 2876 (2011)
G. Sostero, E. Guido, N. Howes, CBET 2876 (2011)
H.A. Weaver, Z. Sekanina, I. Toth, C.E. Delahodde, O.R. Hainaut, P.L. Lamy, J.M. Bauer, M.F. A’Hearn, C. Arpigny, M.R. Combi, J.K. Davies, P.D. Feldman, M.C. Festou, R. Hook, L. Jorda, M.S.W. Keesey, C.M. Lisse, B.G. Marsden, K.J. Meech, G.P. Tozzi, R. West, Science 292, 1329 (2001)
P.R. Weissman, Nature 320, 242 (1986)
Acknowledgments
We acknowledge gratefully the award of Director’s Discretionary Time to carry out these observations with the Herschel Space Observatory. We wish to thank the Mission Planners at the Herschel Science Centre and especially Charo Lorente, for their efficient scheduling of these observations. The authors are also grateful to Jon Giorgini for his insights into the orbit solution for C/2010 X1 (Elenin) available in the NASA-JPL Horizons System. The helpful and very constructive comments of Jacques Crovisier, Miriam Rengel and Ulrich Klaas for improving this manuscript are gratefully acknowledged. The development of PACS has been supported by the funding agencies BMVIT (Austria), ESA-PRODEX (Belgium), CEA/CNES (France), DLR (Germany), ASI/INAF (Italy), and CICYT/MCYT (Spain).
Author information
Authors and Affiliations
Corresponding author
Additional information
Herschel is an ESA space observatory with science instruments provided by European-led Principal Investigator consortia and with important participation from NASA. PACS has been developed by a consortium of institutes led by MPE (Germany) and including UVIE (Austria); KU Leuven, CSL, IMEC (Belgium); CEA, LAM (France); MPIA (Germany); INAF-IFSI/OAA/OAP/OAT, LENS, SISSA (Italy); IAC (Spain). HIPE is a joint development by the Herschel Science Ground Segment Consortium, consisting of ESA, the NASA Herschel Science Center, and the HIFI, PACS and SPIRE consortia.
Rights and permissions
About this article

Cite this article
Kidger, M.R., Altieri, B., Müller, T. et al. A Search for the Far-Infrared Ghost of C/2010 X1 (Elenin) with Herschel. Earth Moon Planets 117, 101–108 (2016). https://doi.org/10.1007/s11038-016-9484-3
Received:
Accepted:
Published:
Issue Date:
DOI: https://doi.org/10.1007/s11038-016-9484-3