
Abstract
Logging is widely used in modern software development to record run-time information for software systems and plays a significant role in software testing. Although the research area of logging has attracted much attention, little attention is paid to the practice of test logging (i.e., the logging involved in test files). To fill this knowledge gap, we conduct this empirical study to explore and disclose the practice of test logging. This study examines 21 open-source subjects with \(\sim \)70K logging statements, of which \(\sim \)48K are production logging statements and \(\sim \)22K are test logging statements. We organize our study by answering four research questions, and as a result, (1) we have yielded five findings to reveal the differences between test and production logging statements, (2) we have disclosed four findings regarding the differences between the maintenance efforts of test and production logging statements, (3) we have identified four reasons why developers use test log, and (4) we have uncovered the relationship between test logging and production logging. To the best of our knowledge, this is the first study that quantitatively and qualitatively analyzes the logging practices in test and production code, providing developers and researchers with insight into this topic.
1 Introduction
Logging is an important practice in recording the run-time information of software systems. Logging has been used for a variety of purposes, such as software quality evaluation (Kernighan and Pike 1999; Shang et al. 2015), anomaly detection (Fu et al. 2009; Lou et al. 2010), error reporting (Glerum et al. 2009), performance diagnosis (Nagaraj et al. 2012), system behavior understanding (Fu et al. 2013; Li et al. 2020a) and code coverage estimation (Chen et al. 2018), many of which facilitate testing. Moreover, a number of programming languages provide logging frameworks to assist developers in logging. For instance, Python has a widely used built-in logging module, logging, and Java offers a variety of logging frameworks, including the built-in logging framework JUL (Oracle and/or its affiliates 2021) and frameworks provided by third parties (such as SLF4J (QOSch 2021) and Log4j (The Apache Software Foundation 2021)).
Logs are generated by logging statements. The following is a sample of a typical logging statement that consists of four components: a logging object (LOG), a logging level (INFO), a static text, and a dynamic variable:

A logging level allows developers to filter the run-time information of software systems, printing only information about critical events (e.g., errors) while suppressing less critical information (e.g., debugging information) (Gülcü 2002).
The significance of software logging has long been acknowledged, and numerous studies have been undertaken to improve logging practices. Yuan et al. (2012b), Chen and Jiang (2017c), Zeng et al. (2019), He et al. (2018), and Chen and Jiang (2017a) characterize the logging practice and logging anti-patterns in different programming languages and platforms. Li et al. (2017b), Li et al. (2021), Liu et al. (2019), and Shang et al. (2014) explore what information to log and Fu et al. (2014), Zhu et al. (2015), and Zhao et al. (2017) investigate where developers should place logging statements.
Despite the considerable efforts that prior studies spent on analyzing and improving logging practices, to the best of our knowledge, there is no study that explores logging practices in test files and production files separately. In general, production files are used to develop software that will be released to users, while test files are used to verify the functionality of production files. In this paper, we define the logging involved in test and production files as test logging and production logging respectively. Production and test files can be easily distinguished by their file paths. For example, in Hadoop, the source code directory of each module consists of two separate folders, a main folder and a test folder that contain production and test files, respectively. Since test files and production files serve different purposes, the logging practices in test and production files may also differ, and identifying such differences may help developers more effectively and unambiguously log in test and production files. Therefore, to fill this knowledge gap between the logging practices in test and production code, we conduct an empirical study on logging statements in test files. Specifically, this study focuses on four aspects: (1) the statistical differences of logging statements in test and production files, (2) the differences of efforts that developers spent on maintaining test and production logging statements, (3) the rationales why developers use test logging, (4) the relationships between test and production logging.
To investigate the logging practice in test and production files, we have conducted a comprehensive study on 21 software projects. These projects have \(\sim \)8 million source code lines, \(\sim \)70K logging statements (including \(\sim \)48K production logging statements and \(\sim \)22K test logging statements), \(\sim \)214K commits (during the analyzed histories) and \(\sim \)89K files in total. To identify the differences in the logging practice between test and production files, we analyze the density, distributions, and historical data of test and production logging statements separately. Furthermore, we conduct a “firehouse email” (Murphy-Hill et al. 2015) survey to reveal why developers use logging statements in test files. Then, we analyze and label test logs according to their relationship with production logging to explore how test and production logging are related. Our research yielded five findings regarding the comparisons between the characteristics of test logging statements and production logging statements, four findings with respect to the comparisons between developers’ maintenance efforts for test and production logging statements, and revealed four reasons for why developers use test logs, as well as the relationship between production and test logging. The summary of our research questions and findings are as follows:
-
RQ1: What is the difference between the characteristics of test logging statements and production logging statements?

-
RQ2: What is the difference between developers’ maintenance efforts for test and production logging statements?

-
RQ3: Why do developers use test logging?
-
RQ4: What is the relationship between test logging and production logging?


The implications of our findings are that test logging is quite essential to developers, and future research should treat logging statements in test files discretely, due to significant differences between test and production logging. Our findings also suggest that some information (e.g., production intermediate data) recorded by test logging statements can be used in production logging, implying that more research into how to extract and leverage such information is required.
Paper Organization
The rest of this paper is organized as follows. Section 2 introduces the subjects we have studied and how we extract the related data from these subjects. Section 3 explains the motivation, research process as well as results of each research question. Section 4 presents the threats to validity. Section 5 discusses the related work. Section 6 concludes this paper.
2 Case Study Setup
This section describes the projects under study and how we extract data from these projectsFootnote 1.
2.1 Subjects
Our research involves 21 open-source subjects varying in size and domain. These subjects were chosen because: (1) These are all well-known open-source software applications that have been developed for at least 5 years, (2) These contain sufficient logging code for our research, (3) These subjects are under the control of professional development teams for production and testing, (4) They have been selected as studied subjects by the prior study (Chen and Jiang 2017c).
Table 1 presents an overview of our studied subjects. In total, we analyzed 21 open-source projects with \(\sim \)8 million sources lines of code. Column KLOC is the thousands of source lines of code, ranging from \(\sim \)10K for Rat to \(\sim \)1754K for Hadoop. Column Files denotes the number of Java files at the analysis time. The total number of files in the study is \(\sim \)89K, while each file has an average of \(\sim \)87 source lines of code. Column Commits indicates the number of the analyzed commits. During the analyzed commit histories, 214,763 commits were pushed, while Rat had the least commits at 1,043, and Hadoop had the most commits at 24,083. The average age of these subjects at the time of analysis is \(\sim \)14 years old, with a minimum age of \(\sim \)5 years for Openmeetings and a maximum age of \(\sim \)22 years old for Jmeter.
2.2 Data Extraction
Figure 1 illustrates the overview of our research workflow. In each analyzed subject, we examined the logging practice in its latest version and all commit histories. The workflow mainly consists of three phases: Extracting logging statements (marked by ‘yellow’ color), Classifying logging code changes (marked by ‘turquoise’ color), and Executing tests (marked by ‘red’ color).

Overview of the research workflow
2.2.1 Extracting Logging Statements
We first use GitPython (GitPython-Developers 2021), an open-source tool for accessing and processing Git commits, to identify source code changes from Git histories. In order to identify logging statements from source code changes, we use srcML (Collard et al. 2013), a free tool for analyzing source code, to transform the source code to XML format. A similar data extraction strategy was used in a previous study (Zeng et al. 2019) as well. Through XPath, we can extract all method invocations from these XML documents, and then we can search these method invocations for logging statements using Regular Expression with logging-related keywords, such as log and logger. To increase the detection accuracy, we remove method invocations whose names include the logging-related keywords, but they are not logging-related, for example, the method invocations with name logo, logic, and logdir. We further filter the remaining method invocations using logging-level related keywords like info, warn, and error, etc. Following the identification of these logging statements, they are labeled as test logging statements or production logging statements, depending on whether they are from test or production files.
2.2.2 Classifying Logging Code Changes
In order to characterize logging practices, we measure how many logging statements have been added, deleted, or updated during development histories. We first sort the source code files with logging code changes extracted from GitPython into three categories: file additions, file deletions, and file updates. Our goal is then to convert the logging code changes made in these three types of files into three types of logging code changes (i.e., added/deleted/updated logging statements). Changes in the logging statements in the added/deleted files could be regarded as added/deleted logging statements respectively. If the insertion and deletion of a logging statement in the Git revision of a revised file occur in the same method and they seem to be very similar, the logging statement is considered updated. This can help us find the logging statement additions/deletions among the remaining logging code changes in this file’s revision.
2.2.3 Executing Tests
To study the relationship between test and production logs, we execute the unit tests in our studied subjects and analyze the generated logs (including both test and production logs) from these tests. We first clone the source code of the head commit (when the study is conducted) for each research subject from GitHub and then execute unit tests on our local Linux machine (Ubuntu 18.04, 4-Core Intel i5-2400 CPU, 8GB memory). If a failure occurs during the testing, we ignore the failure and let the tests continue executing.
3 Case Study Result
In this section, we present the study results of our research questions. We describe the motivation for each research question, as well as the approaches proposed to address the research questions and the experimental results.
3.1 RQ1: What is the difference between the characteristics of test logging statements and production logging statements?
3.1.1 Motivation
Many research studies have been conducted to characterize logging practices. On the one hand, previous research has investigated the logging statements in production code (Li et al. 2017a; Li et al. 2017b) and disclosed the logging characteristics in various programming languages and platforms (Yuan et al. 2012b; Chen and Jiang 2017c; Zeng et al. 2019). On the other hand, prior research has not provided insights into the distinctions between logging statements in test and production code. Investigating the logging characteristics in test and production code could help developers write more effective logs and improve the state of logging practice (e.g., by improving bug detection). Therefore, in this research question, we explore the differences between the logging statements characteristics in test and production code. At the time of analysis, the study is conducted on the most recent version of the subjects. Table 1 provides an overview of the subjects.
3.1.2 Approach
To understand the differences between the logging statements in test and production code, we extract the following three dimensions of metrics from the studied subjects, and we investigate the relationship between the distributions of test and production logging density. Table 2 presents a list of metrics for each of the three dimensions with further description.
-
Log quantity metrics are used to measure the number of logging statements in varying kinds of source code files, such as total logging statements, logging statements per file, and log density. Similar metrics regarding log quantity were also used by Yuan et al. (2012b). To calculate the logging density, we first use CLOC (Danial 2021), a widely used open-source tool, to count the number of source code lines (SLOC) in test and production files, then use srcMLFootnote 2 and regular expressions to count the number of logging statements in these files. The log densities defined by prior work (Yuan et al. 2012b) are then computed by dividing the SLOC of test and production files by the number of logging statements in each type of file separately.
-
Logging level metrics measure the logging level distributions in test files and production files (i.e. the proportions of each logging level in test and production files). Same metrics regarding logging level number were also studied by Zeng et al. (2019). The logging level is a component of a logging statement, and learning more about it can help us understand the differences in logging statement characteristics between production and test files. After logging statements are identified, we use XPath to identify logging levels. Existing literature that studies logging in Java projects typically considers five log levels (Zeng et al. 2019) (i.e., the log levels that we consider in our paper) or six log levels (Li et al. 2021) (with an additional fatal level). However, major logging frameworks (e.g. SLF4J (2021)) have recently stopped supporting the fatal level as it is considered redundant. Therefore, we consider the five log levels as commonly done in prior studies.
-
Logging information metrics quantify the information volume supplied by logging statements. A logging statement consists of two types of information: static texts and dynamic variables. We calculate the length of the static texts and the number of dynamic variables to estimate logging information volume (the same measurement method was adopted by Li et al. (2017b)). This dimension could be used to identify the differences between test and production files in terms of logging information types.
Statistical Test
We have introduced the three dimensions above in order to investigate the difference between test and production logging statements. Such difference is summarized by our plain statistics. We then leverage two popular statistical methodologies named Mann-Whitney U test (Nachar 2008) and Chi-squared test (McHugh 2013) to further measure the differences between test and production logging statements.
Mann-Whitney U test
We choose the Mann-Whitney U test because it does not enforce any assumptions about the distribution of analyzed data. Mann-Whitney U test is applied to distributions of reciprocals for logging densities (since there is no logging statement in some files, logging densities for these files cannot be calculated) in test and production files (related to Finding 1), distributions of logging variable numbers as well as distributions of lengths of logging static texts (related to Finding 5) in test and production logging statements respectively for each subject. Before the Mann-Whitney U test, we propose two hypotheses (i.e, null hypothesis and alternative hypothesis):
-
H0: The distributions under test are the same.
-
H1: The distributions under test are different.
The test is executed at the 5% level of significance, which implies that if p-value ≤ 0.05, the H0 is rejected but H1 is supported, and vice versa. Reporting only the statistical significance may lead to erroneous results (i.e., if the sample size is very large, the p-value can be small even if the difference is trivial (Laaber et al. 2019).) Hence, we use Cliff’s delta effect size (Cliff 1996) to quantify the magnitude of difference between the two distributions under the Mann-Whitney U test. In the case of positive effect size, the higher its value, the greater the significance of difference. The thresholds of Cliff’s delta is defined as follows (Romano et al. 2006):
Chi-Squared Test
The Chi-squared test is chosen to examine the independence between two categorical variables (Franke et al. 2012). In this study, we use the Chi-squared test to determine the independence between the distributions of logging levels and the classifications regarding whether they are production or test logging statements (related to Finding 2 and 3), as well as the independence between the distributions of logging information types and the classifications with regard to whether they are test logging statements or not (related to Finding 4). We propose two hypotheses regarding the result of the Chi-squared test (i.e, null hypothesis and alternative hypothesis):
-
H0: The distributions under test are independent of whether the logging statements are in test files or not.
-
H1: The distributions under test are not independent of whether the logging statements are in test files or not.
As with the Mann-Whitney U test, the Chi-squared test is also executed at the 5% level of significance, which implies that if p-value ≤ 0.05, the H0 is rejected but H1 is supported, and vice versa. To avoid erroneous results that could be induced by merely reporting the statistical significance, we use Cramér’s V effect size (Cramér 2016) to measure the magnitude of association between the two distributions with p-value ≤ 0.05 under the Chi-squared test. Table 3 is the Cramér’s V interpretation table, which was firstly introduced by (Cohen 2013) and provides a list of intervals for the statistical significance of the association degree between two distributions. Column df refers to degrees of freedom (Fisher 1922), which is used to interpret Cramér’s V. The calculation of df is based on the characteristics of the examined data sample. In the case of a two-dimensional table used to compute Cramér’s V, the df is \(df = \min \limits {(r-1, c-1)}\), where r is the number of rows and c is the number of columns observed in the table. For example, the relevant data describing logging level distributions shown in Fig. 2 can be treated as a table with 5 columns (logging levels) and 2 rows (production and test logging statements), therefore its degrees of freedom is 1 (i.e., \(\min \limits {(5-1, 2-1)} \)).

Distributions of the logging statement levels
3.1.3 Results
By analyzing the three dimensions of metrics we obtained, we discover five findings regarding the differences between the logging statement characteristics in test files and production files. We find that logging in test files is as common as in production files and that the distributions of logging densities in test and production files are almost the same. Conversely, test logging statements and production logging statements present notable differences in their logging level distributions, and their logging information types and sizes. However, such differences are often disregarded by prior studies which suggest general rules to help developers choose proper log levels (Li et al. 2017b; Li et al. 2021) or useful information to log (Liu et al. 2019). Consequently, our findings may inspire researchers to further explore how logging can be facilitated for developers by considering logging separately for test files and production files.
Log Quantity Metrics
Table 4 summarizes the results of Log quantity metrics to measure log numbers for the subjects. Each subject is presented in terms of thousands of lines of code, the number of logging statements, logging statements per file, and logging statement densities in the production and test files separately.

Descriptive Statistics
As illustrated in Table 4, there are 48,030 production logging statements in production code, which is about twice as many as the logging statements counted in test files (21,639). However, it should be noted that source code lines are almost double in production files (5,127.11K) in comparison to test files (2574.85K). As such, more logging statements in production files does not imply that logging is more pervasive in production files than in test files.
Table 4 reveals that test and production files have similar logging densities (118 vs. 105). Furthermore, on average, there is at least one logging statement in each test file (1.24) and each production file (1.32). Specifically, there are at least two logging statements per file for certain subjects, such as Hbase, Zookeeper, and Log4j. Therefore, logging appears to be widespread in both production and test files. We then perform the statistical test to assess this observation.
Statistical Test
The column Log density of Table 6 demonstrates the results of a Mann-Whitney U test on the distributions of logging densities in test and production files. There are three sub-columns below this column for p-value, cliff’s d (only calculated with p-values ≤ 0.05) and effect size. In the column eff size, the abbreviations NEGL, SM, MED, and LG refer to negligible, small, medium, and large effect size respectively. In Table 6, there is no significant difference (i.e., p-value ≥ 0.05) in log density between test and production files for half of the studied subjects (11/21). For the remaining 10 subjects, 7 subjects have negligible effect sizes while only 2 subjects have small effect sizes and 1 subject has a medium effect size. Based on these findings, we can conclude that there are no significant differences in log density between test and production files for half of the studied subjects, and the effect sizes of those differences are limited for the other half of the subjects.
Discussion
According to the descriptive statistics and statistical test results above, although there are many more production logging statements than test logging statements in real-world projects, both are equally prevalent (Finding 1), which implies that logging in test files is as important as in production files.
Despite the similarity between test and production logging revealed by Finding 1, we should not treat them as a whole. On one hand, in real-world software development, software development and software testing are often performed by separate teams (Grechanik et al. 2010), resulting in production code and test code rarely evolving synchronously (Wang et al. 2021). As a result, test and production files may have distinct logging practices. On the other hand, test logging statements are overlooked by prior studies (e.g. Li et al. (2017b) and Li et al. (2018)) and even though there exist several studies that take the logging statements both in test and production files into consideration, they treat the logging statements in test files the same as that in production files (more details regarding the focuses of prior studies are presented in Section 5). Considering that logging statements in test files are as pervasive as in production files, exploring similarities and differences may assist developers in better logging in test and production files.
Logging Level Metrics
Figure 2 illustrates the results on the subjects’ logging level measurements — a proportional distribution of log levels in test and production files.

Descriptive Statistics
Test files and production files use the INFO level in the majority of logging statements, accounting for 77.81% and 31.74%, respectively, of all logging statements. The TRACE level is seldom used either in test or production files: their ratios are 0.48% and 4.15% separately. The statistical test specific to log levels can be found below Finding 3.
Discussion
Based on the descriptive statistics above, we can deduce our Finding 2. Such results imply that in both test and production files, logging is most frequently used to record necessary informational data (e.g., encounter a status or an event) and is rarely used to trace the code. It should be noted that He et al. (2018) and Li et al. (2020a) made similar observations about developers logging for understanding normal system behaviors.
A possible reason for why the info level is considered as a most prevalent logging level in the real-world logging practice could be that it is a fairly common default verbosity logging level for software logging (i.e., only the logging statements with logging levels greater than or equal to this level could emit logs during software run-time). For example, based on the documentation of Apache Commons Logging (Apache Common Logging 2021), info is the lowest logging level that makes logs visible to developers at run-time. According to prior studies (Li et al. 2017b; Zhi et al. 2019), developers often struggle to assign appropriate levels for the logging statements. As there are no rigorous logging specifications to follow (Zhu et al. 2015), developers may tend to choose the default verbosity logging level as the logging level of logging statements in such cases.
In the test code, there could be one more reason for the dominance of the info logging level. Chen and Jiang (2017a) and Li et al. (2019) discover that in many cases, developers do not adhere to current logging guidelines and instead use info and warn levels for debugging purposes. Given that test files are used to verify the functionalities of production code and have no impact on user experience in most cases, developers are more likely to adopt a moderate level (i.e. info) for test logging statements rather than spending more time considering the appropriateness of the logging levels.
Figure 2 also reveals an interesting finding: Debug is the second most prevalent log level in production and test logging statements. The potential reason for this could be the intention of developers’ use of logging statements. According to Zeng et al. (2019) and Li et al. (2020a), developers often use logging statements as a debugger in addition to logging normal system events. In addition, we also observe that production code has a higher proportion of Debug levels than test code. The possible reason behind this, as supported by a prior study conducted by Zeng et al. (2019), is that rather than removing the debugging logging statements in production code after debugging, some developers prefer to leave the debugging logging statements to help them diagnose the production code instantaneously in case some errors occur in the future.

Descriptive Statistics
Apart from the INFO level, the remaining four logging levels account for less than a quarter (22.19%) of logging statements in test files, but they account for 68.26% in production code. Furthermore, the standard deviations for the distributions of logging level proportions in test and production files are 29.10% and 9.44% separately. This indicates logging levels in production code are distributed more evenly than in test files.
Statistical test:
We perform a Chi-squared test to examine whether the distributions of logging levels are associated with the types of logging statements (i.e., test or production logging statements). The df used for interpreting Cramér’s V is 1 because the relevant data describing logging level distributions shown in Fig. 2 can be treated as a table with 5 columns (logging levels) and 2 rows (production and test logging statements) and min(5-1, 2-1)= 1. The results are presented in column Log level of Table 5. There are three sub-columns below this column: p-val (for p-value), Cramér’s V (only calculated with p-values ≤ 0.05), and eff size (for effect size). As we can see, all subjects (except one unavailable for calculating Cramér’s V ) have statistical significance for the association between log level distributions and logging statement types. In the column eff size, the abbreviations SM, MED, and LG refer to small, medium, and large effect size respectively. According to the table, there exists a strong (LG in the column eff size) association between the distributions of logging levels and logging statement types in 6/21 subjects. In the remaining subjects, 8/21 subjects have a medium effect size and 6/21 subjects display a small effect size. Overall, there exists a significant association between the distributions of logging levels and logging statement types.
Discussion
According to descriptive statistics, there exist differences in distributions of test and production logging levels. The results of statistical tests further prove that the distributions of logging levels are closely associated with logging statement types. These observations support our Finding 3.
The more evenly distributed logging levels in production logging statements may imply that the purposes for which developers log in production files are more diverse than those in test files, which could be due to differences between the natures of production and test code. On one hand, as production code is released to users, developers may log in production code for customer support, system performance monitoring, etc. (Li et al. 2020a). On the other hand, test code is used to verify the functionalities of production code, so developers may primarily focus on debugging and observing system behaviors in testing.
Logging Information Metrics
The purpose of these metrics is to determine whether there are differences in logging information content between test and production log files based on the distribution of argument types and quantities in test and production logging statements.

Descriptive Statistics
Figure 3 plots the distribution of logging statement argument types in test files and production files. According to Fig. 3, the majority of logging statements use a combination of static texts and variables to log information in production files (71.70%) and test files (62.25%). In test files, there are more logging statements with static text (27.98%) than in production code (17.20%). Production and test files contain very similar proportions of logging statements that only log variable information, 11.10%, and 9.77% respectively. Such results indicate that developers prefer logging with a combination of static texts and variables rather than exclusively static texts or variables (i.e., Finding 4).

Distributions of the logging information types
Statistical Test
Following the same procedure as we used to examine the distributions of logging levels in test and production logging statements, we leverage the Chi-squared test to determine whether the distributions of logging information types are associated with logging statement types. The df for interpreting Cramér’s V is 1 because the relevant data describing logging information types distributions shown in Fig. 3 can be treated as a table with 3 columns (logging information types) and 2 rows (production and test logging statements) and min(3-1, 2-1)= 1. As it shows in Table 5 (the column Log information type), there is no statistical significance of the association between the distributions of logging information types and logging statement types in 5/21 subjects. Among the remaining 16 subjects, 3/16 subjects exhibit medium effect size while the others (13/16) display either small or negligible effect size. To summarize, the Chi-squared test proves that the distribution of logging information types has an association with logging statement types, but such association is weak according to the interpretation of Cramér’s V values.
Discussion
Although our descriptive statistics reveal a similar tendency for developers to use logging information types, statistical tests indicate that this tendency slightly depends on the type of logging statements (i.e., testing/production). The existence of dependency reinforces our claim that test and production logging statements should not be studied together. In addition, the preservation of these complicated logging content compositions could exacerbate the dilemma of “what to log”, which has already sparked a lot of research (more details in Section 5).
Fu et al. (2014) point out there is no existing work to assist developers in making informed decisions to avoid over-logging and under-logging. It is essential to provide developers with the appropriate amount of logging information, which can also facilitate testing. Therefore, we investigate the logging information volume in the studied subjects and hope that our findings would provide developers with further insight into logging information content.

Descriptive Statistics
Figure 4 portrays the distribution of static logging text lengths and dynamic variable numbers at the logging statement level. The sub-figures (a) and (c) display the original box-plot charts used for analyzing text lengths and variable numbers respectively, while sub-figures (b) and (d) display their magnified versions used for subsequent analysis.Sub-figures (a) and (b) compare the distributions of the static text length in test and production logging statements. Sub-figures (c) and (d) compare the distributions of the number of the dynamic logging variables in test and production logging statements. In Fig. 4, the mean variable number in each production logging statement is 1.33 which is approximately 25% greater than it in each test logging statement (1.06). The average length of the static texts captured by developers in the production logging statements is 37.81, while the mean length of logging static texts for each test logging statement is 25.16. It should be noted that a value of 0 indicates that the logging messages only contain variables or static text. For example, the variable number of LOG.info("Initializing DS Client") is 0, and the static text length of LOG.info(outputDirPathForEntity) is 0. The implication behind these differences is that on average, developers log more information in each production logging statement than in each test logging statement.

Distribution of static logging texts lengths and variable numbers in each logging statement
Statistical test
We leverage the Mann-Whitney U test to test the difference between the distributions of static logging text lengths in test and production logging statements as well as the difference between the distribution of logging variable numbers. The results are presented in Table 6.
In terms of variable numbers, there is no significant difference between test and production logging statements in 6/21 subjects, which is lower than what it is for log density. In the 15 remaining subjects, 8 exhibit negligible effect sizes, 5 small effect sizes, 1 medium effect size, and 1 large effect size. We can draw the conclusion from this result that there are no significant differences in variable number distributions between test and production logging statements for more than one-fourth of the studied subjects, and the effect sizes of those differences are almost limited for the remaining subjects.
As for static text length, only 3/21 subjects have no significant difference between test and production logging statements. Among the remaining 18 subjects, only 1 has a negligible effect size, while 6 have small effect sizes, 8 have medium effect sizes, and 3 have large effect sizes. This indicates that only a small subset of the studied subjects has no significant difference of static text length between test and production logging statements, while the effect sizes of those differences in the remaining subjects are substantial.
Discussion
The descriptive statistics show that the average variable numbers in each test logging statement and each production logging statement are comparable. Meanwhile, the average static text length is significantly larger in each production logging statement than in each test logging statement. The statistical test results with regard to the variable numbers demonstrate that there is no significant difference between the distributions, which confirms the observation about the comparable average variable numbers in each test and production logging statement. The statistical test results related to the static text length show that there exist notable differences between the distributions under test, which confirms the observation regarding the larger average static text length in each production logging statement. Therefore, based on the descriptive statistics and the results of statistical tests we can infer Finding 5. Logging statements with longer text length and more variables are desirable for debugging purposes (Li et al. 2017b). Therefore such results may imply there are more logging statements for debugging purposes in production files than in test files. This also confirms the situation we observed in Fig. 2 that Debug level is more common in production logging statements. Future research can further explore the difference between the rationales that developers log in test and production files.
RQ2:
What is the difference between developers’ maintenance efforts for test and production logging statements?
3.1.4 Motivation
The maintenance effort of the logging statements is the effort developers spend to modify the logging statements, which includes adding, deleting, or updating logging statements. A prior study by Yuan et al. (2012b) examines the maintenance of logging statements in four C and C++ projects, finding that logging statements are unstable and that developers expend significant effort to maintain them. As software development and testing involve separate software teams (Grechanik et al. 2010), test and production code rarely evolve simultaneously (Wang et al. 2021), which may lead to different logging practices in test and production code. Nevertheless, prior studies ignore the differences between the maintenance efforts of test logging statements and production logging statements. For example, Chen and Jiang (2017c) quantify the efforts (i.e. code churn rates) developers spent on maintaining the logging statements in Java; Zeng et al. (2019) investigate the maintenance efforts developers spent on maintaining logging statements in mobile applications without distinguishing between them. To fill this knowledge gap, we study the differences between the maintenance efforts of test logging statements and production logging statements. Our findings disclose that there exist notable differences between the maintenance efforts of test and production logging statements and we should treat test and production logging statements separately.
3.1.5 Approach
To recognize the differences between the maintenance efforts of test logging statements and production logging statements, we extract the following metrics in two dimensions from the studied subjects. Table 7 presents a list of metrics for each of the two dimensions with further description.
-
Log change metrics measure the efforts developers spend on maintaining the logging statements as the projects evolve. Similar metrics with respect to log change were adopted by Yuan et al. (2012b) and Kabinna et al. (2018). We identify logging statements and classify their changes by exploiting the techniques introduced in Section 2.2. Log churn refers to the amount of logging statement changes. It is measured by counting the number of logging statements that have been changed, including adding/deleting/updating logging statements (Nagappan and Ball 2005). In our study, the log churn rate for a subject is the average log churn rate of all the commits in that subject, which is calculated by the following formula (Yuan et al. 2012b):
$$ \text{Log Churn Rate}\text{ = } \frac{{\sum}_{i=1}^{Commits}\frac{\textit{{Log Churn of }} Commit{_{i}}}{\textit{{LOG in }} Commit{_{i}}}}{\textit{{Commits}}} $$In this formula, Commits indicate the number of all commits in the analyzed subject and LOG refers to the total number of logging statements.
-
Component metrics are used to gauge how developers modify the components of logging statements. Similar metrics were also used by Zeng et al. (2019). Given a list of updated logging statements from the prior study regarding log churn, we still use srcML and XPath to extract the components from this list and analyze them individually. For example, we use an XPath query ./src:expr/src:literal to extract the static texts from logging statements and then disclose the characteristics of static texts in logging statements. As presented in Table 8 (we use Hadoop as an example), the logging statement changes could be classified into five categories: whitespace format change, text change, variable change, logging level change, and logging object change. Similar categories have been uncovered in prior research (Zeng et al. 2019) as well.
Statistical Test
As with RQ1, we perform statistical tests pertaining to the distributions of logging statement change types (Chi-squared test; related to Finding 6), the distributions of the updated logging components (Chi-squared test; related to Finding 8 and 9) as well as the efforts developers spend on maintaining test and production logging statements (Mann-Whitney U test; related to Finding 7).
3.1.6 Results
By analyzing the two dimensions of metrics we obtained and performing the statistical test on the maintenance efforts (i.e. logging churn rates), we identify four findings with respect to the variations in maintenance efforts of test and production logging statements. We find that, although overall, the logging statements are less likely to be updated in test files compared to that in production files, the average efforts developers spent on maintaining a logging statement are comparable. Furthermore, we identify the difference between logging components in updated logging statements for test and production files.
Log Change Metrics
In this dimension, we analyze the numbers of the added, deleted, and updated logging statements (during the analyzed histories) in each subject, as presented in Table 9. To further investigate the difference between test log churn and production log churn, we created Fig. 5 (complements Table 9) below, which demonstrates the proportions of added, deleted, and updated logging statements in each subject. Table 10 shows the thousand percentages of the updated, added and deleted logging statements, normalizing based on the totally updated, added and deleted source code respectively.


Distributions of the change types of logging statements
Descriptive Statistics
According to Table 9 and Fig. 5, during the studied commit histories of the subjects, the total proportion of logging statements that are updated in the production code is 18.07% which is roughly twice as much as it is in the test code (8.97%). Exceptionally, in Maven and Rat, the logging statements in the test code are more likely to be updated. The percentage of the logging statements added in the test code is 61.40%, which is about 10% higher than that in the production code (51.51%). The proportion of the logging statements deleted in the test code (29.63%) and production (30.42%) code are comparable.
To eliminate the biases induced by various proportions of source code changes, we normalized logging statement changes to build Table 10. Every data point in this table cell is the corresponding data point from Table 9 divided by the number of lines of source code changes. According to row Total, after excluding affection from proportions of source code changes, production logging statements still have a higher chance of being updated than test logging statements (14.84 vs. 8.03). However, both have a similar chance of being added (9.89 vs. 10.05), while production logging statements have a lower chance of being deleted than test logging statements (10.27 vs. 12.46).
Statistical Test
The Chi-squared test results in column Log change types of Table 12 demonstrates if and how logging statement change types (i.e. Added, Deleted, and Updated) are associated with logging statement types. As it shows in the table, only 1/21 subject does not have any association between the logging statement change types and logging statement types. In the remaining 20 subjects, 8 exhibit negligible effect size and 12 display small effect size. Such results indicate that although there exists an association between logging statement change types and logging statement types, the association is quite weak.
Discussion
The descriptive statistics uncover the differences in the possibility to be changed between test and production logging statements. Such difference is more apparent for logging statement updates when compared to the two other logging statement changes. Moreover, the statistical test uncovered a slight association between logging statement change types and logging statement types that supports the finding from descriptive statistics.

Descriptive Statistics
Table 11 presents an overview of the code churn rate and log churn rate for the studied subjects. Column General indicates the churn rate of code or logs that are not specific to test or production, while the columns Test and Production indicate churn rates specific to test and production, respectively. According to Table 11, production logging statements have a total churn rate of 15.93  for all subjects, which is slightly higher than test logging statements (13.27
  ). In general, the churn rates of test and production logging statements are higher than the churn rates of test and production code separately, implying that developers actively maintain the logging code, as revealed by prior studies (Yuan et al. 2012b; Chen and Jiang 2017c; Zeng et al. 2019).
Statistical Test
We first conducted Mann-Whitney U tests on test and production log churn data at the commit level for each subject, which yielded that p-values is 0 (< 0.001) for 20 subjects and 0.032 for Rat, indicating there exist differences between developers’ maintenance effort (measured by log churn rates) regarding test and production logging statements. To further study the effect size of these differences, Fig. 6 presents Cliff’s delta between the distributions of the maintenance efforts on production and test logging statements for each subject. As illustrated in Fig. 6, the differences in distributions of the maintenance efforts on test and production logging statements are negligible in 19 subjects and are small in the remaining 2 subjects. This means that, although there are differences in developers’ maintenance effort on test and production logging across all subjects, almost all of these differences have negligible magnitude.

Statistical test results for comparing the distributions of the changed logging components
Discussion
During our analysis, we discovered that the number of commits with log changes differs significantly between test and production files. To be more specific, the test logging statements are changed in 10,832 commits for all analyzed subjects, while the production logging statements are changed in 29,650 commits which more than doubles the number of commits with test log changes. Because log churn rates of test and production logs are only slightly different, we can conclude that, on average, developers prefer to change a smaller proportion of production logging statements in a commit and change them more frequently (i.e., more commits with production log changes), whereas they prefer to change a larger proportion of test logging statements in a commit but change them less often.
In conclusion, despite the fact that developers have different habits for modifying production and test logging statements, the corresponding log churn rates are only marginally different, implying that the effort expended by developers to maintain production logging statements is only slightly greater than that expended on test logging statements (i.e., Finding 7).
Component Metrics
Figure 7 depicts the proportions of the changed logging components for all updated logging statements in test and production files. In this dimension, we disclose two findings by comparing the changed logging component proportions for test and production logging statements.

Overview of the updated logging components
In Fig. 7, the ordinate (Y -axis) represents the proportions of logging components in updated logging statements, while the abscissa (X-axis) represents the various logging component types as introduced in Table 8. Several components of a logging statement may be modified simultaneously when the logging statement is updated. Our logging component proportion calculation includes such overlapping, i.e., a logging statement with various component changes could be counted multiple times for analysis.

Descriptive Statistics
According to Fig. 7, the logging component variable is the most commonly updated component in both test logging statements (55.33%) and production logging statements (48.40%). Component static text is the second most commonly modified logging component in test (27.53%) and production (31.73%) logging statements. The proportion of component logging level in test logging statements is 1.97%, compared to 5.54% in production logging statements, which indicates that the least commonly modified component is logging level. The relevant statistical test could be found below Finding 9.
Discussion
Although prior studies have also revealed the proportions of logging statements for various logging component change types, they examine test and production logging statements as a whole rather than separately. For example, Yuan et al. (2012b) discover that 27% of logging statement changes in C and C++ applications are related to variable updates, while Zeng et al. (2019) find that 45.6% of logging statement changes for it in mobile applications. Our study, however, is the first to disclose how different logging component change types vary in test and production logging statements. The statistical test below can provide further insights.

Descriptive Statistics
Based on Fig. 7, we examine the differences between the components of updated logging statements in test and production files. The component variable has the greatest difference (6.93%), whereas the component logging object has the smallest difference (0.26%). It appears that differences between logging components in test and production files are modest, which requires statistical testing to reach a more conclusive conclusion.
Statistical Test
We perform a Chi-squared test to examine whether the updated logging components are associated with changed logging statement types (i.e., test/production). The test results are presented in Table 12 (column Updated log components). In Table 12, only one subject (i.e, Empire-DB) has a p-value greater than 0.05, indicating that the updated logging components are only independent of logging statement types in one subject. In the remaining 20 subjects whose updated logging components are associated with logging statement types, only one has a large effect size and four have a medium effect size. Of the remaining 15 subjects, ten have small effect sizes, while five have negligible effect sizes. The statistical test results indicate that although the updated logging components are associated with changed logging statement types, such association is rather minimal.
Discussion
Figure 7 shows a similar trend of updated logging component distributions for test and production logging statement changes, and we derive Finding 8 from this, which concerns the similarity of updated logging components between test and production logging statement modifications. However, after performing statistical tests, we discovered that updated logging components are still related to the logging statement types, but the association is weak. Because of this association, test and production logging statements should be studied individually.
3.2 RQ3: Why do developers use test logging?
3.2.1 Motivation
In RQ1, we reveal the log level distributions in test and production files. We have discussed how the number of INFO levels is (much) greater than other log levels, particularly at higher log levels (i.e., ERROR and WARN), which contradicts our straightforward notion (i.e., the higher logging levels may account for the major portion of test logging levels). Because of these discrepancies between logging level distribution and our plain notation, a research question arises: why do developers use test logs? By answering this question, we build a bridge from log level usage to actual test log usage in this section. In order to answer this question, we conduct a “firehouse email interview” (Murphy-Hill et al. 2015) with the developers to find out why they recently added logging statements to the test files. A similar approach is used by Zeng et al. (2019) as well.
3.2.2 Approach
Our approach constitutes two phases. In the first phase, we collect data from developers. Then in the second phase, we analyze developers’ response messages and identify the rationales.
-
Data collection. During this phase, we survey developers by email to find out why test logging statements are added. We first identify logging statements newly added to test files of the studied subjects every week from 2020-07-28 to 2021-01-14 by using our data extraction scripts, and then we email developers to inquire about the reasons that they add those logging statements in test files. In order to increase the survey response rate, we try to provide as many details as possible (e.g. file URL, commit ID, and line number) about the logging statements. In most instances, we just ask developers one question regarding why they added a new logging statement, such as if they can explain why they added the logging statement briefly in a given context. In other instances, we inquire developers about multiple logging statements since we observed that a commit could contain numerous new logging statements (up to four to avoid bothering developers). As surveying developers multiple times may lead to biased results, we only survey each developer once. Finally, we have emailed 50 developers and received 22 replies regarding the addition of 43 test logging statements.
-
Data analysis. We perform a pair review (i.e., each reviewer examines the same data individually and then merges their review results) to classify the rationales that developers log in test files. Two reviewers first examine each responded email separately to tag each logging statement with a label that indicates the rationale behind it. After the first round of examination, reviewers combine the initial labels into new labels. During a second round, the two reviewers then re-label the logging statements individually according to the new labels and the contents of the emails. After these two rounds of examination, we use Cohen’s kappa (McHugh 2012) to measure the reliability of the agreements between two reviewers. Below is a formula from McHugh (2012) that gives the relationship between the level of agreement and the value of cohen’s kappa:
$$ \textit{Level of Agreement} = \begin{cases} None & \text{if Cohen's } k \leq 0.20\\ Minimal & \text{if } 0.20 < \text{Cohen's } k \leq 0.39\\ Weak & \text{if } 0.39 < \text{Cohen's } k \leq 0.59\\ Moderate & \text{if } 0.59 < \text{Cohen's } k \leq 0.79\\ Strong & \text{if } 0.79 < \text{Cohen's } k \leq 0.90\\ \text{\textit{Almost perfect}} & \text{if Cohen's } k > 0.90 \end{cases} $$(2)
3.2.3 Results
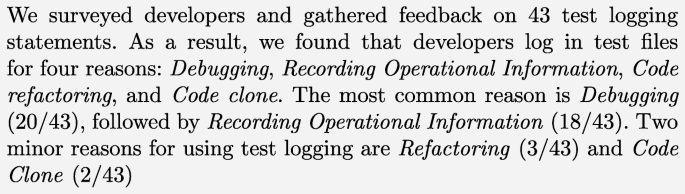
During the research, we gathered the rationale for adding 43 logging statements from 22 surveyed developers. The Cohen’s kappa regarding the agreement between the two reviewers after the first round is 0.69 this value increased to 1 after the second round review. This indicates that our classification is reliable. As illustrated in Fig. 8, our research results have revealed four reasons why developers log in to test files.


Rationales for developers logging in test files
Debugging (20/43)
Debugging is the most typical reason for developers to use test logging. Across these 20 Debugging cases, there are few minor differences in the rationale for developers to use test logs. In 9/20 cases, developers use logging statements to collect information for certain source code lines that are prone to cause bugs. For example, in Hive with commit 077952f, one developer added the following logging statement:

The following is the developer’s response on why this logging statement was added:

In 7/20 cases of Debugging, test logs are used to print the error message directly to facilitate debugging. For example, in the commit 52db86b of Hadoop, one of the developers we surveyed added the logging statement below:

The developer’s justification for adding this logging statement is as follows:

In the remaining four cases, developers responded that they added logging statements for debugging on their local machine, but that they should have eliminated them before committing or used assertions instead.
Recording operational information (18/43)
The second most common reason for developers to log in test files is Recording operational information in order to monitor test behaviors and enhance printed log messages. In 13/18 cases, logging statements are used to check the results of certain operations. For example, in the commit 4b62152 of Hbase , the developer added a logging statement below:

The following is the developer’s response on the reason for the logging statement addition:

In the rest 5/18 cases, the logging statements are introduced to enhance the readability and comprehensiveness of the generated log messages. For example, the following logging statement was added into Lucene-solr with commit 6bf5f4a:

The rationale explained by the developer is:

Refactoring (3/43)
Some logging statements are introduced in test files as a result of the refactoring of test code. For example, one developer added the following logging statement into Hbase with commit b556343:

The reason behind this logging addition is that the developer just rearranged the code in that class and that logging statement was already there since the creation of the test.
Code clone (2/43)
Only a few logging statements were added due to the clone of the test code. For example, in commit 2ffe00f of Hadoop, a developer added a logging statement below:

The following is how the developer justified the reason:

In conclusion, developers use test logs for four reasons, the most common of which is Debugging, followed by Recording Operational Information. In conjunction with the discovery of log level distribution, which reveals that INFO is the most commonly used log level in test files, we can conclude that developers use a significant portion of INFO for debugging purposes. In other words, in addition to the error messages printed by logging statements with higher log levels, developers always use informational data (e.g., recording an event) to debug.
3.3 RQ4: What is the relationship between test logging and production logging?
3.3.1 Motivation
During the software testing process, both production and test logs are printed. A production log displays production information under testing while a test log is generated by a test suite. RQ1 and RQ2 highlight some significant differences and similarities in logging practices between test and production files, implying that test logs may not be independent of production logs. In this case, the question arises as to whether the log information contained in test logs could be useful for production logging, for example, to leverage the information in test logs to improve production logging statements. Therefore, to answer this question, we conduct a manual study to explore the relationships between test and production logging. Based on the results of the manual study, we classify the test logs to determine whether the information in the test log is useful for production logging. We would like to know, even though test logs are generated by test files, if they are added to production logging, whether they can help people better understand the runtime behavior of the system. To the best of our knowledge, this is the first study to investigate the relationship between test logging and production logging and classify test logs’ usefulness for production logging.
3.3.2 Approach
As shown in Fig. 9, our approach consists of three steps. In the first step, we execute all of the unit tests for the subjects under investigation in order to obtain test outputsFootnote 3. The second step takes the test outputs from the first step as input and uses regular expressions to identify the test logs from them. In the final step, we randomly select a sample from the test logs identified in the previous step and label each test log using a pair review. These labels reflect the relationship between test logs and their corresponding production logs, as well as whether the information supplied by the test logs is useful for production logging and the test log’s classification.
-
Tests outputs collection. We begin by cloning the research subjects onto our local machine. Because all of the research subjects use automation build tools, such as maven and ant, for software building and testing that publishes logs through Terminal, we modify the test configuration files to redirect the test outputs from Terminal into text files to facilitate further data analysis. Finally, we execute the tests through the command line. For example, we run all the tests of the subjects that use maven as their automation build tool with mvn clean install -fn.
-
Log messages identification. Each text file generated in the first step contains test logs and production logs produced by the production code covered by the test case involved in this text file. The goal of this step is to identify test logs so that we can investigate the relationships between them and the other logs (i.e., production logs) in the following step. A typical test log would appear like this:

We first use regular expressions to match the time patterns to identify the typical logs (atypical logs are worthless for subsequent analysis), and then we use regular expressions and the search-keyword “test” to identify test logs in the test outputs. Typical logs can specify which files generate the logs. In the example above, this log is generated by TestAMRMProxyService.java. The keyword “test” is always present in the name of a test file so that we can use it to identify test logs. This approach has been proved to have a high precision and an acceptable recall in identifying test and production files (White et al. 2020).
-
Log messages analysis. In this step, we manually analyze the log information from test and production logs. The reason we adopt the manual analysis method instead of checking the function calls is that checking function calls is a coarse-grained approach. The presence of a production method invocation in a test does not imply that the test logs generated by this test can be helpful to the production logging. Finding the relationships between test and production logging requires the analysis of log information, and human effort is needed to understand log information. We first sample the test logs and then apply two rounds of labeling to the logs samples. We randomly sample test logs with five confidence interval and 95% confidence level (Confidence Intervals/Levels 2021). We obtained 385 different test log samples from the unit tests’ outputs that contain 691,310 instances in total, and selected 100 logs at random from this log sample set to perform the first round of labeling. Our log samples are divided into five batches, each of which is reviewed by two researchers individually, due to the fact that there are five researchers involved in this study. Each test log is provided with the context of the test output which includes all the production and test logs produced during the execution of a unit test.
The first round of labeling only examines a subset of the log samples in order to obtain an initial consensus and get some common knowledge. The first round of labeling produces a preliminary set of labels used for the second round. The labeling is based on log content analysis of test logs and the surrounding production logs in the same log file, which necessitates that the labelers comprehend the log information in test logs and the surrounding production logs. The second round of labeling covers all log samples and is based on the common understanding of the prior round. The second round includes labeling the rest of the test logs as well as revisiting the labeled logs to alter them if they are against the established knowledge base. If the two researchers are unable to achieve an agreement, a third researcher may be invited to reach the final agreement. After these two rounds of labeling, the Cohen’s kappa of researcher agreement ranges from 0.91 to 1 for three labels, indicating that researchers attain a consistent agreement on the test log labels. The final agreement was then reached with the assistance of a third researcher.


Overview of the research approach for RQ4
3.3.3 Results
Each test log sample has three labels: (1) the relationships between it and the relevant surrounding production logs, (2) the usefulness of test logs for production, and (3) test log classifications. Below are the details of these three labels:
Relationship between the test logs and production logs
As shown in Fig. 10, our research has yielded four categories with regard to the relationship between test and production logs: Test only, Overlap, Elaboration, and Complementary. The definition of each category is provided below, along with an example in table Table 13. The fonts of labeled test logs are in ‘blue color’, while the fonts of associated production logs are in ‘orange color’. In every category, we display not only the labeled test logs but also logs that surround them to help readers understand the context of each test log.
-
Test only (290/385). Test logs in this category only contain information about the tests and do not include any relevant production logs in the same file. As illustrated in Table 13, the test log refers to cleaning up a directory used for testing only during a test.
-
Overlap (40/385). In this category, the information provided by test logs is also reflected in production logs. For example, the test log (‘blue’ font) and related production log (‘orange’ font) in Table 13 are both indicating the same file is locked therefore this test log is overlapping with production logs.
-
Elaboration (29/385). Test logs in this category contain information that somewhat overlaps with relevant production logs, but they elaborate the production logs with additional details. In Table 13, although the production log includes information about the opportunistic container, the test log provides more details about the opportunistic container, such as container ID and version.
-
Complementary (26/385). Test logs in this category complement the information conveyed in the production logs. As shown in Table 13, the test log indicates that the monitoring thread is waiting for the required resource to be utilizable while the first production log indicates that CPU usage is not yet available.

Relationship between test and production logs
Figure 10 presents proportions for each category of the relationship between production logs and test logs. Based on this figure, the most prevalent relationship is Test only (75.3%). This number confirms developers’ intuition that the vast majority of test logs are dedicated to testing rather than production. However, there is quite a large number (around a quarter) of test logs related to production. The second most prevalent relationship is the Overlap relationship (10.4%), which signifies that either the test code developers are not aware of the similar logging in production code, or the production logging is not in a good format that facilitates testing. The least common relationships between test logs and production logs are Elaboration (6.8%) and Complementary (7.5%), both of which have fairly comparable proportion numbers.
The Elaboration and Complementary relationships suggest that the production run-time information contained in the production logging is not sufficient for understanding the testing results. Test logs that are labeled with Overlap relationship with production logging provide the same information as in production logs, hence we conjecture that such test logs may not be useful to production logging. However, there is no existing evidence (to the best of our knowledge) proving this. Thus, we also examine whether such test logging could be useful and added to the production code.
Usefulness of test logs
In the subsequent analysis, we examined the usefulness (to production logging) of the 95 test logs that are not labeled with Test only and assigned these logs three labels: Useful, Not useful, and Unclear. Generally, we manually examine the contents of test logs and the production logs that surround them. We would like to know, if the information contained in the test logs is added to production logging statements, whether it can improve production logging and help people better understand the runtime behavior of the system (i.e., being useful). Table 14 presents some examples of useful and useless test logs. As in the previous section, the analyzed test logs are denoted by ‘blue’ font color. Figure 11 depicts the connections between the usefulness of test logs and their relationship with production logs.
-
Useful (35/95). The information provided by test logs in this category is useful to production logging. As the example shows in Table 14, the surrounding log is describing the initialization of a requested resource from a specific user, and the target test log is indicating the success of initialization.
-
Not useful (57/95). The information contained in test logs is useless to production logging. For example, the surrounding log in Table 14 describes the properties of an opportunistic container. Although the analyzed test log contains more details about this container, it is useless for production logging since this container is primarily used for testing, and details about it are not required in production.
-
Unclear (3/95). Finally, we have observed several test logs that are difficult to determine whether they are useful to production logging due to the lack of related domain knowledge.

Usefulness of non-Test-Only logs
Figure 11 demonstrates the correlations between the usefulness of test logs and their relationships with production logs. We find that the category Useful consists of 20 cases of Complementary and 15 cases of Elaboration, with no Overlap. The category Not useful is composed of 6 cases of Complementary, 12 cases of Elaboration, and 39 cases of Overlapping. The majority of Overlap cases fall into the category of Not useful, which implies the test logs having an Overlap relationship with production logging are almost useless to production logging which is because such information is already available in the production logging.
Classification of test logs
To further investigate what information makes test logs useful, we then classify the information recorded in the 95 test logs that are not labeled with Test only during our subsequent analysis. Our study has revealed ten categories based on the information contained within these logs which can be leveraged in future research with regard to how to identify and utilize the useful information in test logs. These ten categories are defined below, and examples are included in Table 15. Just as in the previous section, the analyzed test logs are marked with a blue color.
-
Production intermediate data (31/95). In this category, test logs contain information regarding the properties of the software or production code that is being tested. For example, the test log in Table 15 depicts the ID of an ongoing production event.
-
Test intermediate data (6/95). Test logs in this category display the intermediate status of the resource exclusively for testing or the temporary values of variables in test code during test execution. In Table 15, the test log is recording the temporary status of the resources only for testing.
-
Production event (21/95). Test logs in this category depict the events related to the production code under test. The example presented in Table 15 is describing an event about the production code under test.
-
Test event (15/95). Test logs in this category portray events that only pertain to the tests rather than the tested production code. The example in Table 15 displays the event of initiating a session, which is exclusively relevant to the test.
-
Production method call (1/95). Test logs describe the method invocations in production files for this category. An example in Table 15 obviously mentions a production method createDurableConsumer() is invoked.
-
Test setup (4/95). In this category, test logs describe the configuration to set up tests. The test log in Table 15 describes how to set up the cluster’s (SHARED_DIR_HA) port number for testing.
-
Production return (5/95). Test logs in this category record the information returned from the production code. As the example shown in Table 15, the test log is displaying the node selection result for a network topology which is the return result from production code regarding node selection strategy.
-
Environmental information (7/95). Test logs in this category display the environmental information of the platform, host, or hardware that the test is running on.
-
Test assertion (2/95). In this category, test logs record the assertion results, and always include both expected and actual test results. The example in Table 15 represents the two types of test results in a single log.
-
Others (3/95). In this category, we include those cases not covered by any of the preceding categories.
Figure 12 demonstrates the proportion of each category for the test logs not labeled with Test only. As it shows in this figure, the most common category is Production intermediate data (32.6%), which indicates that the majority of test logs are leveraged to record the intermediate status of the software or resources under test. The second and the third most common categories are Production Event (22.1%) and Test Event (15.8%) respectively, implying that test logs are often utilized to record the events of production or tests. The least common category is Production Method Call (1.1%).

Test log categories
4 Threats to Validity
We discuss the threats to the validity of our research in this section.
4.1 External Validity
The subjects involved in this research are all open-source Java projects hosted on GitHub and incubated by Apache Software Foundation (2021). The selection of the research subjects can lead to the following threats:
-
Our research results may not be applicable to industry or non-free software considering that the logging practice can be different in industrial environments. We attempt to reduce this issue by investigating multiple software projects. However, this drawback can be further overcome through collaboration with developers from the industry and analyzing the closed-source applications developed by them.
-
Our findings may not be reproduced to software written in other programming languages (e.g., C and C++) rather than Java since we only investigated Java projects. Therefore, it necessitates a further exploration of applications implemented in other languages. Although we only look at Java projects, Java is a popular programming language and we believe that our results can be useful to numerous software developers.
-
As all of the studied subjects are developed and maintained by Apache Software Foundation (2021), our findings may not be applicable to the software systems developed by other foundations or organizations (e.g. Microsoft Developer (2021)) since the developers’ logging practices may vary among them. However, our studied subjects are all well-known projects that have been developed for many years by professional developer teams, and we believe that our results can reflect the real-world logging practice in software development.
4.2 Internal and Construct Validity
The threats to the internal and construct validity of our research may result from the way we gather the data:
-
When extracting data from the studied subjects, we leveraged the Levenshtein Distance algorithm and set the threshold to 0.5 (Zhao et al. 2017) to determine whether the change type of a logging statement is updated or not. Actually, the threshold selection may have an impact on our research results. However, a similar approach and the same threshold were utilized in prior researches (Zeng et al. 2019; Zhao et al. 2017) and their results were also found to be highly accurate.
-
While collecting JUnit test outputs, we did not guarantee that all of the tests passed. We allow projects to continue running even if a test fails. The presence of failed tests can result in limited test coverage, which may have an impact on our results. However, in real-world software testing, a 100% passing rate is not always promised. Moreover, by observing our test outputs, we did not find many test failures, therefore the impact of these test failures should not be significant to our research results.
-
The classifications involved in RQ3 and RQ4 are determined by humans, which could be affected by their knowledge, expertise, and bias. In addition, our collected survey data in RQ3 may be impacted by the background of the developers who participated in our survey. However, the developers polled in RQ3 are professionals from well-known open-source projects, and five participants in RQ4 are professional researchers specializing in Software Engineering. Four of us hold Ph.D. degrees and one is a Master research student. In RQ4, the categorization outcome is heavily influenced by how the researchers engaged understand log content as well. To mitigate this, we reviewed a large amount of documentation from the studied projects, manually searched logging statements that generated the analyzed test logs, and studied their code context to improve comprehension. Moreover, this threat was also mitigated by assigning two researchers to analyze every log. To resolve the disagreements between the two researchers, we invited a third person to act as a tie-breaker.
5 Related Work
This section introduces the related work. As shown in Table 16, these studies are primarily concerned with characterizing logging practices, as well as determining what should be logged and where the logging statements should be placed. However, these studies either only focus on production logging or consider production logging and testing logging as a whole, ignoring the differences between them and the significance of test logging.
5.1 Characterizing Logging Practice
Several studies involve characterizing logging practice. The first study on logging practices is performed by Yuan et al. (2012b), who analyze four open-source C and C++ projects. Shang et al. (2015) study the relationship between logging characteristics and code quality of platform software by characterizing logging statements in Hadoop and JBoss . Fu et al. (2014) investigate two large industrial C# software systems to better understand developers’ logging practices in the industry. Likewise, Chen and Jiang (2017c) conduct their study on Java applications and compare logging practices in Java to those in C and C++. Kabinna et al. (2018) explore the stability of logging statements in four open source projects. Li et al. (2018) investigate the connections between logging decisions and the topics of related code snippets. Hassani et al. (2018) study the characteristics of log-related issues. Zeng et al. (2019) research the logging practice in 1,444 F-Droid applications and compare the logging practices in server, desktop, and mobile applications. He et al. (2018) characterize the natural language descriptions in the logging statements in Java and C# projects. Chen and Jiang (2017b) disclose six anti-patterns of the logging statements in Hadoop, ActiveMQ, and Maven, and propose an approach to assist developers in detecting the anti-patterns. Li et al. (2019) identify the duplicate code smells in logging statements, categorize them into five patterns and propose a static analysis approach to detect the duplicate logging code smells. Li et al. (2020a) conduct a qualitative study to understand developers’ perspectives regarding the benefits and costs of logging practice. More recently, Tang et al. (2022) study the logging practices specific to log levels and present an automated tool (Tang et al. 2021) to help developers rejuvenate log levels. In addition, metrics used in our study to measure logging characterises, such as the density and churn rate of logging statements, are also adopted in many prior studies (Yuan et al. 2012b; Shang et al. 2015; Chen and Jiang 2017c; Kabinna et al. 2018; Zeng et al. 2019). Although various studies have been conducted to characterize logging practices, none of the aforementioned studies have taken into account the significant differences in logging characteristics between production and test logging. Our study, on the other hand, fills this knowledge gap between the differences between test logging and production logging.
5.2 Where to Log
The research field where to log is primarily concerned with where developers should place logging statements. Yuan et al. (2012a) are the first to perform a study into where to log, and they present an approach to help developers record common error events. Zhu et al. (2015) propose a learning framework to help developers make decisions on where to add logging statements. Ding et al. (2015) propose a logging framework that is able to decide whether to place the logging statements based on the logging overhead and effectiveness. Zhao et al. (2017) present an approach named Log20 that is able to automatically add the logging statements to record non-erroneous events. Yao et al. (2018) present an automated logging tool aiming to assist developers in monitoring the web-based system resource usages. More recently, Li et al. (2020b) introduce a deep learning based approach to help developers decide where to place logging statements at the block level. Nevertheless, as we stated in relation to the related work concerning characterizing logging practices, these studies do not take into account the differences in logging practices in test and production files. Our findings reveal that there are considerable differences between test logging and production logging such as the usage of the logging levels, therefore these approaches may be further enhanced by taking such differences into consideration.
5.3 What to Log
The research topic of what to log is mostly concerned with what content developers should log. Yuan et al. (2011) investigate what information should be recorded by logging statements and present an approach to enhance the logging information for effective logging. Shang et al. (2014) conduct a study regarding what kind of development knowledge can be used for software logging. Likewise, Liu et al. (2019) propose a learning-based approach to assist developers in choosing which variables to log when developing software. Ding et al. (2022) propose a logging text generation tool by leveraging the neural machine translation technology. He et al. (2018) utilize information retrieval technology to automate the generation of logging descriptions. Li et al. (2017b) present an ordinal regression model to help developers determine which logging level to use when adding a new logging statement. Their research uses dynamic variable numbers and static text length to measure logging information, which we also included in our research. Again, studies should not overlook the distinctions between test and production logging, which necessitates additional attention from developers.
6 Conclusions
In this research, we have studied 21 open-source Java projects to characterize the differences of logging practice in test and production files and answered four research questions. Our research has yielded nine findings on the differences between test and production logging, four reasons why developers use test logging, four relationships between test and production logging, and ten classifications based on the information provided by test logs. The contribution of this paper is as follows:
-
To the best of our knowledge, this is the first study that quantitatively and qualitatively analyzes the logging practice in test and production files.
-
We revealed the significance of test logging and production logging and filled the research gap between test and production logging.
-
We surveyed developers and disclosed four reasons why developers log in test files.
-
For the first time, a study has revealed the relationship between test logging and production logging.
Our findings highlight that test logging, to some extent, is different from production logging and should be treated differently in future research. On the other hand, test logging may contain useful information for the production system and can be leveraged in future work to improve production logging. Based on our findings, some opportunities for future research regarding test logging can be:
-
As test logging levels and content are different from that of production logging, there is a need for automated tools specialized in helping developers choose proper test logging levels or test logging content.
-
Given that some test logging statements are introduced as a result of code clone (revealed by RQ3), it would be interesting to explore whether there are more code smells (e.g., duplicated code) in test logging statements than in production logging statements.
-
In light of a prior study (Li et al. 2020a) that investigates the benefits and costs of software logging, future research could explore the differences in benefits and costs of software logging between production and test code.
-
Future work can leverage the useful information in test logging to improve and enrich production logging.
Notes
Scripts and data files used in our research are available online and can be found here: https://github.com/senseconcordia/TestLoggingPractice
In this work, we refer to test outputs as the log messages produced during the execution of the unit tests.
References
Apache Common Logging (2021) Apache commons. https://commons.apache.org/proper/commons-logging/guide.html#JCL_Best_Practices, Accessed: 2021-12-06
Apache Software Foundation (2021) Apache software foundation. https://www.apache.org/, Accessed: 2021-04-25
Chen B, Jiang ZMJ (2017a) Characterizing and detecting anti-patterns in the logging code. In: Proceedings of the 39th international conference on software engineering, ICSE ’17. https://doi.org/10.1109/ICSE.2017.15, pp 71–81
Chen B, Jiang ZMJ (2017b) Characterizing and detecting anti-patterns in the logging code. In: Proceedings of the 39th international conference on software engineering, ICSE ’17. https://doi.org/10.1109/ICSE.2017.15, pp 71–81
Chen B, Jiang ZMJ (2017c) Characterizing logging practices in Java-based open source software projects – a replication study in Apache Software Foundation. Empir Softw Eng 22(1):330–374
Chen B, Song J, Xu P, Hu X, Jiang Z M J (2018) An automated approach to estimating code coverage measures via execution logs. In: Proceedings of the 33rd ACM/IEEE international conference on automated software engineering, association for computing machinery, New York, NY, USA, ASE. https://doi.org/10.1145/3238147.3238214, vol 2018, pp 305–316
Cliff N (1996) Ordinal methods for behavioral data analysis. Erlbaum. https://books.google.ca/books?id=bIJFvgAACAAJ
Cohen J (2013) Statistical power analysis for the behavioral sciences. Academic press, Cambridge
Collard ML, Decker MJ, Maletic JI (2013) SrcML: An infrastructure for the exploration, analysis, and manipulation of source code: A tool demonstration. pp 516–519. https://doi.org/10.1109/ICSM.2013.85
Confidence Intervals/Levels (2021) Sample size calculator. https://surveysystem.com/sscalc.htm, Accessed: 2021-07-01
Cramér H (2016) Mathematical methods of statistics (PMS-9), vol 9. Princeton University Press, Princeton
Danial A (2021) Cloc. https://github.com/AlDanial/cloc
Ding R, Zhou H, Lou JG, Zhang H, Lin Q, Fu Q, Zhang D, Xie T (2015) Log2: A cost-aware logging mechanism for performance diagnosis. USENIX Association, USA, USENIX ATC ’15
Ding Z, Li H, Shang W (2022) Logentext: Automatically generating logging texts using neural machine translation. In: SANER. IEEE
Fisher RA (1922) On the interpretation of x2 from contingency tables, and the calculation of p. Journal of the Royal Statistical Society 85(1):87–94. http://www.jstor.org/stable/2340521
Franke TM, Ho T, Christie CA (2012) The chi-square test: Often used and more often misinterpreted. Am J Eval 33(3):448–458
Fu Q, Lou JG, Wang Y, Li J (2009) Execution anomaly detection in distributed systems through unstructured log analysis. In: 2009 Ninth IEEE international conference on data mining, pp 149–158. https://doi.org/10.1109/ICDM.2009.60
Fu Q, Lou JG, Lin Q, Ding R, Zhang D, Xie T (2013) Contextual analysis of program logs for understanding system behaviors. In: Proceedings of the 10th working conference on mining software repositories. IEEE Press, MSR ’13, p 397–400
Fu Q, Zhu J, Hu W, Lou J G, Ding R, Lin Q, Zhang D, Xie T (2014) Where do developers log? an empirical study on logging practices in industry. ICSE Companion 2014:24–33. https://doi.org/10.1145/2591062.2591175
GitPython-Developers (2021) GitPython-Developers/gitpython: Gitpython is a python library used to interact with git repositories. https://git.io/JnXb2, Accessed: 2021-04-25
Gülcü C (2002) The Complete log4j Manual. QOS.ch
Glerum K, Kinshumann K, Greenberg S, Aul G, Orgovan V, Nichols G, Grant D, Loihle G, Hunt G (2009) Debugging in the (very) large: Ten years of implementation and experience. In: Proceedings of the ACM SIGOPS 22nd symposium on operating systems principles, association for computing machinery, New York, NY, USA, SOSP ’09. https://doi.org/10.1145/1629575.1629586, pp 103–116
Grechanik M, Jones JA, Orso A, van der Hoek A (2010) Bridging gaps between developers and testers in globally-distributed software development. Association for Computing Machinery, New York, NY, USA, FoSER ’10, 149–154. https://doi.org/10.1145/1882362.1882394
Hassani M, Shang W, Shihab E, Tsantalis N (2018) Studying and detecting log-related issues. Empirical Softw Engg 23(6):3248–3280. https://doi.org/10.1007/s10664-018-9603-z
He P, Chen Z, He S, Lyu M R (2018) Characterizing the natural language descriptions in software logging statements. ASE 2018:178–189. https://doi.org/10.1145/3238147.3238193
Kabinna S, Bezemer CP, Shang W, Syer MD, Hassan AE (2018) Examining the stability of logging statements. Empirical Softw Engg 23 (1):290–333. https://doi.org/10.1007/s10664-017-9518-0
Kernighan B W, Pike R (1999) The practice of programming. Addison-Wesley longman publishing co Inc, USA
Laaber C, Scheuner J, Leitner P (2019) Software microbenchmarking in the cloud. how bad is it really? Empirical Softw Engg 24(4):2469–2508. https://doi.org/10.1007/s10664-019-09681-1
Li H, Shang W, Zou Y, E Hassan A (2017a) Towards just-in-time suggestions for log changes. Empir Softw Eng 22(4):1831–1865. https://doi.org/10.1007/s10664-016-9467-z
Li H, Shang W, Hassan AE (2017b) Which log level should developers choose for a new logging statement? Empir Softw Eng, 22. https://doi.org/10.1007/s10664-016-9456-2
Li H, Chen THP, Shang W, Hassan AE (2018) Studying software logging using topic models. Empirical Softw Engg 23(5):2655–2694. https://doi.org/10.1007/s10664-018-9595-8
Li H, Shang W, Adams B, Sayagh M, Hassan A E (2020a) A qualitative study of the benefits and costs of logging from developers’ perspectives. IEEE Trans Softw Eng, 1–1. https://doi.org/10.1109/TSE.2020.2970422
Li Z, Tse-Hsun PC, Jinqiu Y, Weiyi S (2019) Characterizing and detecting duplicate logging code smells. In: Proceedings of the 41st international conference on software engineering: companion proceedings, ICSE ’19, p 147–149. https://doi.org/10.1109/ICSE-Companion.2019.00062
Li Z, Chen TH, Shang W (2020b) Where shall we log? studying and suggesting logging locations in code blocks. In: 2020 35th IEEE/ACM international conference on automated software engineering (ASE), pp 361–372
Li Z, Li H, Chen THP, Shang W (2021) Deeplv: Suggesting log levels using ordinal based neural networks. In: 2021 IEEE/ACM 43rd international conference on software engineering (ICSE), pp 1461–1472. https://doi.org/10.1109/ICSE43902.2021.00131
Liu Z, Xia X, Lo D, Xing Z, Hassan A E, Li S (2019) Which variables should I log? IEEE Trans Softw Eng, 1–1. https://doi.org/10.1109/TSE.2019.2941943
Lou JG, Fu Q, Yang S, Xu Y, Li J (2010) Mining invariants from console logs for system problem detection. In: Proceedings of the 2010 USENIX conference on USENIX annual technical conference, USENIX association, USA, USENIXATC’10, p 24
McHugh M (2012) Interrater reliability: The kappa statistic. Biochemia medica 22:276–282. https://doi.org/10.11613/BM.2012.031
McHugh M (2013) The chi-square test of independence. Biochemia medica 23:143–149. https://doi.org/10.11613/BM.2013.018
Microsoft Developer (2021) Microsoft developer. https://developer.microsoft.com/, Accessed: 2021-04-25
Murphy-Hill E, Zimmermann T, Bird C, Nagappan N (2015) The design space of bug fixes and how developers navigate it. IEEE Trans Softw Eng 41(1):65–81. https://doi.org/10.1109/TSE.2014.2357438
Nachar N (2008) The mann-Whitney U: A test for assessing whether two independent samples come from the same distribution. Tutorials in Quantitative Methods for Psychology, 4. https://doi.org/10.20982/tqmp.04.1.p013
Nagappan N, Ball T (2005) Use of relative code churn measures to predict system defect density. In: Proceedings of the 27th international conference on software engineering, ICSE ’05, p 284–292. https://doi.org/10.1145/1062455.1062514
Nagaraj K, Killian C, Neville J (2012) Structured comparative analysis of systems logs to diagnose performance problems. In: Proceedings of the 9th USENIX conference on networked systems design and implementation, USENIX Association, USA, NSDI’12, p 26
Oracle and/or its affiliates (2021) Package java.util.logging. https://docs.oracle.com/en/java/javase/16/docs/api/java.logging/java/util/logging/package-summary.html, Accessed: 2021-07-05
QOSch (2021) Simple logging facade for java (slf4j). http://www.slf4j.org/, Accessed: 2021-04-25
Romano J, Kromrey JD, Coraggio J, Skowronek J (2006) Appropriate statistics for ordinal level data: Should we really be using t-test and Cohen’s d for evaluating group differences on the nsse and other surveys. In: Annual meeting of the Florida Association of Institutional Research, vol 13
Shang W, Nagappan M, Hassan AE, Jiang ZM (2014) Understanding log lines using development knowledge. In: 2014 IEEE international conference on software maintenance and evolution, pp 21–30. https://doi.org/10.1109/ICSME.2014.24
Shang W, Nagappan M, Hassan A E (2015) Studying the relationship between logging characteristics and the code quality of platform software. Empir Softw Eng 20(1):1–27. https://doi.org/10.1007/s10664-013-9274-8
SLF4J (2021) Slf4j. https://www.slf4j.org/faq.html#fatal, Accessed: 2021-11-19
Tang Y, Spektor A, Khatchadourian R, Bagherzadeh M (2021) A tool for rejuvenating feature logging levels via git histories and degree of interest. arXiv:2112.02758
Tang Y, Spektor A, Khatchadourian R, Bagherzadeh M (2022) Automated evolution of feature logging statement levels using git histories and degree of interest. Science of Computer Programming . https://doi.org/10.1016/j.scico.2021.102724
The Apache Software Foundation (2021) Apache Log4j is a java-based logging utility. https://logging.apache.org/log4j/2.x/, Accessed: 2021-04-25
Wang S, Wen M, Liu Y, Wang Y, Wu R (2021) Understanding and facilitating the co-evolution of production and test code. In: 2021 IEEE international conference on software analysis, evolution and reengineering (SANER), pp 272–283. https://doi.org/10.1109/SANER50967.2021.00033
White R, Krinke J, Tan R (2020) Establishing multilevel test-to-code traceability links. pp 861–872. https://doi.org/10.1145/3377811.3380921
Yao K, de Pádua GB, Shang W, Sporea S, Toma A, Sajedi S (2018) Log4perf: Suggesting logging locations for web-based systems’ performance monitoring. pp 127–138. https://doi.org/10.1145/3184407.3184416
Yuan D, Zheng J, Park S, Zhou Y, Savage S (2011) Improving software diagnosability via log enhancement. SIGARCH Comput Archit News 39 (1):3–14. https://doi.org/10.1145/1961295.1950369
Yuan D, Park S, Huang P, Liu Y, Lee MM, Tang X, Zhou Y, Savage S (2012a) Be conservative: Enhancing failure diagnosis with proactive logging. In: Proceedings of the 10th USENIX conference on operating systems design and implementation, OSDI’12, p 293–306
Yuan D, Park S, Zhou Y (2012b) Characterizing logging practices in open-source software. In: 2012 34th international conference on software engineering (ICSE), pp 102–112. https://doi.org/10.1109/ICSE.2012.6227202
Zeng Y, Chen J, Shang W, Chen T H P (2019) Studying the characteristics of logging practices in mobile apps: a case study on f-Droid. Empir Softw Eng, 24. https://doi.org/10.1007/s10664-019-09687-9
Zhao X, Rodrigues K, Luo Y, Stumm M, Yuan D, Zhou Y (2017) Log20: Fully automated optimal placement of log printing statements under specified overhead threshold. Association for Computing Machinery, New York, NY, USA, SOSP ’17, p 565–581. https://doi.org/10.1145/3132747.3132778
Zhi C, Yin J, Deng S, Ye M, Fu M, Xie T (2019) An exploratory study of logging configuration practice in java. In: 2019 IEEE international conference on software maintenance and evolution (ICSME), pp 459–469. https://doi.org/10.1109/ICSME.2019.00079
Zhu J, He P, Fu Q, Zhang H, Lyu MR, Zhang D (2015) Learning to log: Helping developers make informed logging decisions. In: Proceedings of the 37th international conference on software engineering - vol 1, IEEE Press, ICSE ’15, p 415–425
Author information
Authors and Affiliations
Corresponding author
Additional information
Communicated by: Shaukat Ali
Publisher’s note
Springer Nature remains neutral with regard to jurisdictional claims in published maps and institutional affiliations.
Rights and permissions
About this article

Cite this article
Zhang, H., Tang, Y., Lamothe, M. et al. Studying logging practice in test code. Empir Software Eng 27, 83 (2022). https://doi.org/10.1007/s10664-022-10139-0
Accepted:
Published:
DOI: https://doi.org/10.1007/s10664-022-10139-0