
Abstract
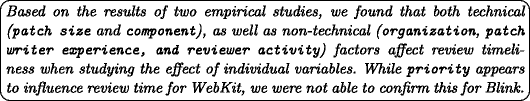
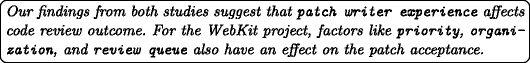
When submitting patches for code review, individual developers are primarily interested in maximizing the chances of their patch being accepted in the least time possible. In principle, code review is a transparent process in which reviewers aim to assess the qualities of the patch on its technical merits in a timely manner; however, in practice the execution of this process can be affected by a variety of factors, some of which are external to the technical content of the patch itself. In this paper, we describe empirical studies of the code review processes for large, open source projects such as WebKit and Google Blink. We first consider factors that have been examined in previous studies — patch size, priority, and component — and then extend our enquiries to explore the effects of organization (which company is involved) and developer profile (review load and activity, patch writer experience) on code review response time and eventual outcome. Our approach uses a reverse engineered model of the patch submission process, and extracts key information from the issue-tracking and code review systems. Our findings suggest that these non-technical factors can significantly impact code review outcomes.
1 Introduction
Many software development projects employ code review as an essential part of their development process. Code review aims to improve the quality of source code changes made by developers (as patches) before they are committed to the project’s version control repository. In principle, code review is a transparent process that aims to evaluate the quality of patches objectively and in a timely manner; however, in practice the execution of this process can be affected by many different factors, both technical and non-technical.
Existing research has found that organizational structure can influence software quality. Nagappan et al. demonstrated that organizational metrics (number of developers working on a component, organizational distance between developers, organizational code ownership, etc.) are better predictors of defect-proneness than traditional metrics such as churn, complexity, coverage, dependencies, and pre-release bug measures (Nagappan et al. 2008). These findings provide support for Conway’s law (Conway 1968), which states that a software system’s design will resemble the structure of the organization that develops it.
In this paper, we have performed empirical studies to gain insight into the different factors that can influence how long a patch takes to get reviewed and a patch’s likelihood of being accepted. The factors we analyzed include personal and organizational relationships, patch size, component, bug priority, reviewer/submitter experience, and reviewer load. Since software developers are primarily interested in getting their patches accepted as quickly as possible, we have designed our research questions to align with this perspective:
- RQ1::
-
What factors can influence how long it takes for a patch to be reviewed?
Previous studies have found that smaller patches are more likely to receive faster responses (Weissgerber et al. 2008; Rigby et al. 2008; Jiang et al. 2013). We replicate these studies on our data, and extend the analysis to a number of other potential factors.
- RQ2::
-
What factors influence the outcome of the review process?
Most studies conclude that small patches are more successful in landing to the project’s codebase (Weissgerber et al. 2008; Rigby et al. 2008). A recent study showed that developer experience, patch maturity and prior subsystem churn play a major role in patch acceptance (Jiang et al. 2013). We further extend these results with additional data that includes various non-technical factors.
In this work, we study the community contributions and industrial collaboration on the WebKit and Google Blink open source projects. WebKit is a web browser engine that powers the Apple’s Safari and iOS browsers, was the basis for Google’s Chrome and Android browsers, and host of other third-party browsers. WebKit is a particularly interesting project as many of the organizations that collaborate on the project — including Apple, Google, Samsung, and Blackberry — also have competing business interests. In April 2013 — and during the execution of our initial study — Google announced that they had created and would subsequently maintain their own fork of WebKit, called Blink. Therefore, when extending our previous work (Baysal et al. 2013), we have decided to investigate the differences in the velocity of the code reviews on the patches submitted to the Blink project and compare findings of the two case studies.
The rest of the paper is organized as follows. We first provide patch lifecycle analysis by comparing the Mozilla Firefox, WebKit, and Blink lifecycle models (Section 2); this is followed in Section 3 by a description of the methodology we used in the empirical studies. Section 4 presents the two case studies: WebKit (Section 4.1) and Blink (Section 4.2). Section 5 interprets the results and addresses threats to validity, and Section 6 discusses some related work. Finally, Section 7 summarizes our results and discusses possible future work.
2 Lifecycle Analysis
WebKit is an HTML layout engine that renders web pages and executes embedded JavaScript code. The WebKit project was started in 2001 as a fork of the open source KHTML project. At the time of our study, developers from more than 30 companies actively contributed to this project; Google and Apple were the two primary contributors, submitting 50 % and 20 % of patches respectively. Individuals from Adobe, BlackBerry, Digia, Igalia, Intel, Motorola, Nokia, Samsung, and other companies were also active contributors.
The WebKit project employs an explicit code review process for evaluating submitted patches; in particular, a WebKit reviewer must approve a patch before it can “land” in (i.e., be incorporated into) the project’s version control repository. The set of official WebKit reviewers is maintained through a system of voting to ensure that only highly-experienced candidates are eligible to review patches. A reviewer will either accept a patch by marking it review+ or ask for further revisions from the patch owner by annotating the patch with review-. The review process for a particular submission may include multiple iterations between the reviewer and the patch writer before the patch is ultimately accepted and lands in the version control repository.
Since WebKit is an industrial project, we were particularly interested to compare its code review process to that of other open source projects. To do so, we extracted the WebKit’s patch lifecycle (Fig. 2) and compared it with the previously studied patch lifecycle of Mozilla Firefox (Baysal et al. 2012) (Figs. 1 and 2).

Mozilla Firefox’s patch lifecycle

WebKit’s patch lifecycle
The patch lifecycle captures the various states patches undergo during the review process, and characterizes how the patches transition between these states. The patch lifecycles enable large data sets to be aggregated in a way that is convenient for analysis. For example, we were surprised to discover that a large proportion of patches that have been marked as accepted are subsequently resubmitted by authors for further revision. Also, we can see that rejected patches are usually resubmitted, which might ease concerns that rejecting a borderline patch could cause it to be abandoned.
While the set of states in our patch lifecycle models of both WebKit and Firefox are the same, WebKit has fewer state transitions; this is because the WebKit project does not employ a ‘super review’ policy (Mozilla). Also, unlike in Mozilla, there are no self-edges on the Accepted and Rejected states in WebKit; this is because Mozilla patches are often reviewed by two people, while WebKit patches receive only individual reviews. Finally, the WebKit model introduces a new edge between Submitted and Resubmitted; WebKit developers frequently “obsolete” their own patches and submit updates before they receive any reviews at all. One reason for this behaviour is that submitted patches can be automatically validated by the external test system; developers can thus submit patches before they are to be reviewed to see if they fail any tests. All together, however, comparing the two patch lifecycles suggests that the WebKit and Firefox code review processes are fairly similar in practice.
Blink’s patch lifecycle is depicted in Fig. 3, which shows that 40 % of the submitted patches receive positive reviews and only 0.3 % of the submitted patches are rejected. Furthermore, a large portion of patches (40.4 %) are resubmitted. This is because Blink developers often update their patches prior to receiving any reviews; as with WebKit, this enables the patches to be automatically validated. At first glance, outright rejection does not seem to be part of the Blink code review practice; the Rejected state seems to under-represent the number of patches that have been actually rejected. In fact, reviewers often leave comments for patch improvements, before the patch can be accepted.

Blink’s patch lifecycle
The model also illustrates the iterative nature of the patch lifecycle, as patches are frequently Resubmitted. The edge from Submitted to Landed represents patches that have been merged into Blink’s source code repository, often after one or more rounds of updates. Developers often fix “nits” (minor changes) after their patch has been approved, and land the updated version of the patch without receiving additional explicit approval. The lifecycle also shows that nearly 10 % of patches are being neglected by the reviewers (i.e., Timeout transition); Timeout patches in Blink can be considered as “informal” rejects.
Comparing the patch lifecycle models of WebKit and Blink, we noticed that Blink has fewer state transitions. In particular, the edges from the Accepted and Rejected back to Submitted are absent in Blink. Since Blink does not provide any indication of the review request on patches, we had to reverse engineer this information for all patches by considering the timestamps on each item (patch) in the series. We automated this process by putting the Submitted label to the patch at the time the patch was filed to the issue repository.
Blink also accepts a smaller portion of patches (about 40 % of all contributions compared to the WebKit’s 55 % of submitted patches), yet officially rejects less than 1 %. While timeouts are more frequent for Blink patches than WebKit ones, timeouts can be viewed as “unofficial” rejects in the Blink project where disapprovals are uncommon.
Blink appears to exhibit a larger portion of patches being resubmitted (a 10 % increase compared to the WebKit patches), including resubmissions after patches are successfully accepted (16.7 %).
Finally, a new edge is introduced between Submitted and Landed, accounting for those contributions that were committed to the code base without official approval from the reviewers; these cases typically represent patch updates. Both WebKit and Blink developers frequently “obsolete” their own patches and submit updates before they receive any reviews at all.
Comparing the two patch lifecycle models suggests that the WebKit and Blink code review processes are similar in practice; at the same time, it appears that Google’s review policy may not be as strict as the one employed by Apple on the WebKit project. While no code can be checked into trunk without having “LGTM” in code review, no formal approval is required for trivial patch updates.
In this paper, we have considered the top five organizations that contribute patches to the WebKit repository. Figure 4 provides an overview of the participation of these organizations on the project with respect to the percentage of the total patches they submit and the percentage of the patches they review. It is clear that two companies play a more active role than others; Google dominates in terms of patches written (60 % of total project’s patches) and patches reviewed (performing 57 % of all reviews) while Apple submits 20 % of the patches and performs 36 % of the reviews.

Overview of the participation of top five organizations in WebKit
3 Methodology
To investigate our research questions, we first extracted code review data from the Bugzilla issue tracking system (for the WebKit project) and the Chromium code review repository (for the Blink case study); we then pre-processed the data, identified factors that may affect review delays and outcomes, and performed our analysis. To avoid repetition in explaining two similar processes, we describe each step of our approach for the first case study only. For any deviations in the methodology of the Blink project (e.g., description of the extracted dataset and data filtering), we refer readers to the beginning of the Section 4.2.
3.1 Data Extraction
Every patch contributed to the WebKit project is submitted as an attachment to the project’s issue repository;Footnote 1 we extracted this data by “scraping” Bugzilla for all public patches submitted between April 12, 2011 and December 12, 2012. We use the same time interval value as in our previous study on Firefox (Baysal et al. 2012) to be able to compare code review processes of two projects. The data we retrieved consists of 17,459 bugs, 34,749 patches, 763 email addresses, and 58,400 review-related flags. We tracked a variety of information about issues such as name of the person who reported the issue, the date the issue was submitted, its priority and severity, as well as a list of patches submitted for the issue. For each patch, we saved information regarding its owner, submission date, whether a patch is obsolete or not, all review-related flags along with the files affected by the patch. For each patch we also recorded the number of lines added and removed along with the number of chunks for each changed file. All details were stored in a relational database.
All fields in the database, except those related to affected files, were extracted directly from the issue tracker. To create the list of affected files, we needed to download and parse the individual patches. Each patch file contains one or more diff statements representing changed files. In our analysis we ignored diff statements for binary content, e.g., images, and focused on textual diffs only. From each statement we extracted the name of changed file, number of lines marked added and removed, and number of code chunks. Here a code chunk is a block of code that represents a local modification to a file as it defined by the diff statement. We recorded total number of lines added and removed per file in total, and not separately for each code chunk. We did not try to interpret the number of changed lines from the information about added/removed lines.
Almost every patch in our database affects a file called ChangeLog. Each ChangeLog file contains description of changes performed by the developer for a patch and is prepared by the patch submitter. Although patch files contain diff statements for ChangeLog files and we parsed them, we eliminated this information when we computed the size.
There are three possible flags that can be applied to patches related to code review: review? for a review request, review+ for a review accept, and review- for a review reject. For each flag change we also extracted date and time it was made as well as an email address of the person who added the flag.
As the issue tracker uses email addresses to identify people, our initial data set contained entries for many individuals without names or affiliations. Luckily, the WebKit team maintains a file called contributors.json Footnote 2 that maps various developer email addresses to individual people. We parsed this file and updated our data, reducing the number of people in our database to 747.
We next determined developers’ organizational affiliations. First, we parsed the “WebKit Team” wiki webpageFootnote 3 and updated organizational information in our data. We then inferred missing developers’ affiliations from the domain name of their email addresses, e.g., those who have an email at “apple.com” were considered individuals affiliated with Apple. In cases where there was no information about organization available, we performed a manual search on the web.
For those individuals where we could not determine an affiliated company, we set company field to “unknown”; this accounted for 18 % of all developers but only 6 % of patches in our data.
3.2 Data Pre-Processing
In our analysis we wanted to focus as much as possible on the key code review issues within the WebKit project. To that end we performed three pre-processing steps on the raw data:
-
1.
We focused only on the patches that change files within the WebCore portion of the version control repository. Since WebKit is cross-platform software, it contains a large amount of platform-specific source code. The main parts of WebKit that all organizations share are in WebCore; these include features to parse and render HTML and CSS, manipulate the DOM, and parse JavaScript. While the platform-specific code is actively developed, it is often developed and reviewed by a single organization (e.g., the Chromium code is modified only by Google developers while the RIM code is modified only by the Blackberry developers).
Therefore we looked only at the patches that change non-platform-specific files within WebCore; this reduced the total number of patches considered from 34,749 to 17,170. We also eliminated those patches that had not been reviewed, i.e., patches that had only review? flag. This filter further narrowed the input to 11,066 patches.
-
2.
To account for patches that were “forgotten”, we removed slowest 5 % of WebCore reviews. Some patches in WebCore are clear outliers in terms of review time; for example, the slowest review took 333 days whereas the median review was only 76 minutes. This filter excluded any patch that took more than 120 hours (≈ 5 days), removing 553 patches. 10,513 patches remained after this filter was applied.
-
3.
To account for inactive reviewers, we removed the least productive reviewers. Some reviewers performed a small number of reviews of WebCore patches. This might be because the reviewer focused on reviewing non-WebCore patches or had become a reviewer quite recently. In ordering the reviewers by the number of reviews they performed, we excluded those developers performed only 5 % of the total reviews. This resulted in 103 reviewers being excluded; the 51 reviewers that remained each reviewed 31 patches or more. This resulted in an additional 547 patches being removed from the data.
The final datasetFootnote 4 consists of 10,012 patches and was obtained by taking the intersection of the three sets of patches described above.
3.3 Determining Independent Factors
Previous research has suggested a number of factors that can influence review response time and outcome (Jiang et al. 2013; Rigby et al. 2008; Weissgerber et al. 2008). Table 1 describes the factors (independent variables) that were considered in our study and tested to see if they have an impact on the dependent variables such as time and outcome (positivity). We grouped the factors into two categories: technical and non-technical. Our choice of selecting independent factors is determined by the availability of the data stored in the projects’ issue tracking systems.
Based on the advice of WebKit developers, we identified the WebKit component the patch changes by examining the patches directly rather than using the issue tracker component. This was because the issue tracker was frequently incorrect.
WebKit does not employ a formal patch assignment process; in order to determine review queues of individual reviewers at any given time, we had to reverse engineer patch assignment and answer the following questions:
-
When did the review process start? We determined the date when a request for a review was made (i.e., review? flag was added to the patch). This date was referred as “review start date”. While there might be some delay from this to the time the reviewer started working on the patch, we have no practical means of tracking when the developer actually received the request or started to perform the review in earnest.
-
Who performed code review of a patch? The reviewer of a patch is defined as the person who marked the patch with either review+ or review-. Having this, we added the assignee to each review request.
We computed a reviewer queue by considering the reviews a developer eventually completed. The review queue is defined as the number of patches that were ‘in flight’ for that developer at the time a patch was submitted.
3.4 Data Analysis
Our empirical analysis used a statistical approach to evaluate the degree of the impact of the independent factors on the dependent variables. First, we tested our data for normality by applying Kolmogorov-Smirnov tests (Massey 1951). For all samples, the p < 0.05, showing that the data is not normally distributed. We also graphically examined how well our data fits the normal distribution using Q-Q plots. Since the data is not normally distributed, we applied non-parametric statistical tests: Kruskal-Wallis analysis of variance (Kruskal and Wallis 1952) for testing whether the samples come from the same distribution, followed by a post-hoc non-parametric Mann-Whitney U (MWW) test (Lehmann and D’Abrera 2006) for conducting pairwise comparisons.
All our reported results including Figures and Tables are statistically significant with the level of significance defined as p < 0.05.
4 The Case Studies
Ultimately, we investigated the impact of seven distinct factors on the code review process both in terms of response time and review outcome or positivity for the WebKit and Blink projects; this is summarized in Table 2.
4.1 WebKit
To answer our research questions, we performed two empirical studies. We start with demonstrating the results of our analysis of the WebKit dataset and highlighting its main findings. The overview of the numerical factors is summarized in Table 3.
4.1.1 Patch Size
The size of the patch under review is perhaps the most natural starting point for any analysis, as it is intuitive that larger patches would be more difficult to review, and hence require more time; indeed, previous studies have found that smaller patches are more likely to be accepted and accepted more quickly (Weissgerber et al. 2008). We examined whether the same holds for the WebKit patches based on the sum of lines added and removed as a metric of size taken from the patches.
To determine the relationship between patch size and the review time, we performed a (non-parametric) Spearman correlation. The results showed that the review time was weakly correlated to the patch size, r=0.09 for accepted patches and r=0.05 for rejected patches, suggesting that patch size and response time are only weakly related, regardless of the review outcome.
With a large dataset, outliers have the potential to skew the mean value of the data set; therefore, we decided to apply two different outlier detection techniques: Pierce’s criterion and Chauvenet’s criterion. However, we found that removal of the outliers did not improve the results, and we ultimately rejected their use.
Next we split the patches according to their size into four equal groups: A, B, C, and D where each group represents a quarter of the population being sampled. Group A refers to the smallest patches (0–25 %) with the average size of 4 lines, group B denotes small-to-medium size changes (25–50 %) on average having 17 lines of code, group C consists of the medium-to-large changes (50–75 %) with the mean of 54 LOC, and group D represents the largest patches (75–100 %) with the average size of 432 lines. A Kruskal-Wallis test revealed a significant effect of the patch size group on acceptance time (χ 2(3) = 55.3, p < 0.01). Acceptance time for group A (the median time is 39 minutes, the mean is 440 minutes) is statistically different compared to the time for groups B (with the median of 46 minutes and the mean of 531 minutes), C (the median of 48 minutes and the mean of 542 minutes) and D (the median is 64 minutes, the mean time is 545 minutes).
In terms of review outcome, we calculated the positivity values for each group A–D, where we define positivity as positivity = \(\sum \) review+ / (\(\sum \) review-+ \(\sum \) review+). The median values of positivity for groups A–D are 0.84, 0.82, 0.79, 0.74 respectively. Positivity did decrease between the quartiles, matching the intuition that reviewers found more faults with larger patches, although this result was not significant.
However, review time for a single patch is only part of the story; we also wanted to see whether smaller patches undergo fewer rounds of re-submission. That is, we wanted to consider how many times a developer had to resubmit their patch for additional review. We calculated the number of patch revisions for each bug, as well as the size of the largest patch. Figure 5 illustrates the medians of the patch revisions for each size group, the median of the revisions for group A and B is 1, for group C is 2, and for D is 3. The results show that patch size has a statistically significant, strong impact on the rounds of revisions. Smaller patches undergo fewer rounds of revisions, while larger changes have more re-work done before they successfully land into the project’s version control repository.

Number of revisions for each size group
4.1.2 Priority
A bug priority is assigned to each issue filed with the WebKit project. This field is created to help developers define the order in which bugs should be fixed.Footnote 5 The Webkit project defines five priority levels, ranging from the most important (P1) to the least important (P5). We were surprised when we computed the distribution of patches among priority levels: P1 – 2.5 %, P2 – 96.3 %, P3 – 0.9 %, P4 and P5 – 0.1 % each. Looking at these numbers one might speculate that the priority field is not used as intended. Previous work of Herraiz et al. also found that developers use at most three levels of priority and the use of priority/severity fields is inconsistent (Herraiz et al. 2008). The default value for priority is P2, which might also explain why the vast majority of patches have this value assigned. Also, in our discussion with WebKit developers we found that some organizations maintain internal trackers that link to the main WebKit bug list; while the WebKit version has the default priority value, the internal tracker maintains the organization’s view on the relative priority. In our analysis we discarded priorities P4 and P5 because they did not have enough patches.
A Kruskal-Wallis test demonstrated a significant effect of priority on time (χ 2(2) = 12.70, p < 0.01). A post-hoc test using Mann-Whitney tests with Bonferroni correction showed the significant differences between P1 and P3 with median time being 68 and 226 minutes respectively, p < 0.05, and between P2 and P3 with median time being 62 and 226 minutes respectively, p < 0.01. While patches with priority P2 receive faster response that the ones with P1, the difference is not statistically significant.
To analyze positivity, we considered each review by a developer at a given priority and computed their acceptance ratio. To reduce noise (e.g., the data from reviewers who only reviewed one patch at a level and hence had a positivity of 0 or 1), we discarded those reviewers who reviewed only four or fewer patches for a given priority.
We found a statistically significant correlation between priority levels and positivity (χ 2(2) = 10.5, p < 0.01). The difference of the review outcome for patches of P1 (median value is being 1.0) compared to the ones of P2 (median is 0.83) is statistically significant (p < 0.01), indicating that patches of higher priority are more likely to land to the project’s codebase. Although reviewers are more positive for patches of higher priority, we caution about the interpretation of these results because the vast majority of patches are P2.
4.1.3 Component
WebCore represents the layout, rendering, and DOM library for HTML, CSS, and SVG. WebCore consists of several primary components (bindings, bridge, css, dom, editing, html, inspector, page, platform, and rendering).
While it is natural to assume that some components may be more complex than others, we wanted to find out whether contributions to certain components are more successful or are reviewed more quickly. To answer this, we selected the components that undergo the most active development: inspector (1,813 patches), rendering (1,801 patches), html (1,654 patches), dom (1,401 patches), page (1,356 patches), bindings (1,277 patches), and css (1,088 patches).
The difference in the response time between components was statistically significant (χ 2(6) = 29.9, p < 0.01), in particular the rendering component takes longer to review (the median time is 101 minutes) compared to bindings (72 minutes), inspector (58 minutes), and page (58 minutes). The difference in reviewing time of patches submitted to the page and dom components was also significant with the medians being 58 minutes vs. 91 minutes respectively.
Although the positivity values vary among components and range between 0.73–0.84, we found no relation between positivity and the component. From the developer’s perspective, we can tell that it is more difficult for developers to land a patch to page (the value of positivity is 0.73), while patches to inspector are more likely to be successful (the value of positivity is 0.84).
4.1.4 Review Queue Length
Our previous qualitative study of Mozilla’s process management practices found that developers often try to determine current work loads of reviewers prior to making a decision as to who would be the best choice to request a review from Baysal and Holmes (2012). Thus, we investigated the relationship between review queue size and review response time, expecting to find that reviewers having shorter queues would provide quicker reviews.
We calculated queue sizes for the reviewers at any given time (the process is described in Section 3.3). The resulting queues ranged from 0 to 11 patches.
Since the average queue was 0.6 patches, we distributed patches into three groups according to the queue size: shortest queue length ranging from 0–1 patches (group A), medium length consisting of 2–3 patches (group B) and longer queues ranging from 4–11 patches (group C).
We found a significant effect of review queue size on reviewing time (χ 2(2) = 15.3, p < 0.01). The medians of queue size for group A, B and C are being 0, 2, and 5 patches respectively. A post-hoc test showed significant differences between group A and group C (with median time being 63 and 158 minutes respectively, p < 0.01) and group B and C (with median time being 90 and 158 minutes respectively, p < 0.05).
Studying the impact of the queue size on the reviewer positivity (with the Kruskal-Wallis effect being χ 2(2) = 15.8, p < 0.01), we found a significant difference between A and C groups (the median positivity being 0.84 and 1 respectively, p < 0.01), as well as B and C groups (with median positivity being 0.88 and 1.0 respectively, p < 0.05).
Thus, we found that the length of the review queue influences both the delay in completing the review as well as the eventual outcome: the shorter the queue, the more likely the reviewer is to do a thorough review and respond quickly; and a longer queue is more likely to result in a delay, but the patch has a better chance of getting in.
4.1.5 Organization
Many companies that participate in the WebKit development are business competitors. An interesting question is whether patches are considered on their technical merit alone or if business interests play any role in the code review process, for instance by postponing the review of a patch or by rejecting a patch for a presence of minor flaws. While we analyzed all possible pairs of organizations (36 of them), for the sake of brevity we discuss only Apple, Google, and “the rest”.
Figure 6 represents review time for each pair of organizations. The first letter in the label encodes a reviewer’s affiliation, the second encodes submitter’s affiliation; for example, A-G represents Apple reviewing a Google patch. Analysis of the patches that received a positive review showed that there is a correlation between review time and the organization affiliated with the patch writer.

Acceptance time (left), rejection time (right). Organization: A=Apple, G=Google, X=Rest
To identify where the correlation exists, we performed a series of pair-wise comparisons. We discovered that there is a statistically significant difference between how Apple approves their own patches (A-A) and how Google approves their own patches (G-G column). Another statistically significant difference was found between time Apple takes to accept their own patches and time it takes to accept Google patches (A-G). However, we found no statistical difference in the opposite direction — between the time for Google to accept their own patches compared to patches from Apple (G-A).
The correlation between review time and company was also found for patches that received a negative review. The pair-wise comparison showed almost the same results: statistical difference between Apple-Apple and Apple-Google, and no statistical difference between Google-Google and Google-Apple. At the same time the difference between Apple-Apple and Google-Google is no longer present. Based on these findings, it appears that Apple treats their own patches differently from external patches, while Google treats external patches more like their own. Pairs involving “the rest” group exhibited no statistically significant differences for both review decisions.
Since statistical tests can report only a presence of statistical difference, we also report the means and medians of review time required for each company pair (Table 4). To ease comparison of the differences in the response time for organizations, patch reviewers and writers between the two projects, we placed Tables 4, 5, 6, and 7 on one page (p. 15). According to the data, Apple is very fast in reviewing its own patches, but is relatively slow in reviewing Google patches (3–4 times difference in medians, 1.5–2 times difference in means). At the same time Google exhibits the opposite behaviour, i.e., provides faster response to the patches from Apple than their own developers. While both means and medians are almost the same for positive reviews, the median and the mean values of review time for negative review for Apple patches are 20 and 200 minutes less respectively than for Google own patches.
To compute the positivity of various organizations, we cleansed the data as we did for the priority analysis above; we removed any reviewer who had reviewed less than 10 patches (i.e., removed 5 % of least active reviewers) to avoid an overabundance of positivities of 0 or 1. The box plot with this filter applied is shown in Fig. 7. Statistical tests showed that there is a correlation between the outcome of the review and patch owner’s affiliation (χ 2(2) = 10.7, p < 0.01). From the pair-wise comparison, we found that there is statistically significant difference between positivity of Apple reviewers towards their own patches (A-A column) compared to the patches of both Google (A-G column) and “the rest” (A-X column). The other pair that was statistically different is positivity of Google reviewers between their own patches (G-G column) and patches from “the rest” (G-X column).

Positivity values by organization: A=Apple, G=Google, X=Rest
Quantitatively, there are some interesting results. First, the positivity of Apple reviewers towards their own patches clearly stands out (the median is ≈ 0.92). Possible explanations for this include that there is a clear bias among Apple reviewers, or that Apple patches are of extreme quality, or that Apple applies some form of internal code review process. We also observed that both Apple and Google are more positive about their own patches than ’foreign’ patches; while this could be a systematic bias, Apple and Google are also the two most experienced committers to WebKit and this may account for this difference. Finally, the positivity of Apple reviewers towards Google patches (the median is ≈ 0.73) is lower than the positivity of Google reviewers towards Apple patches (the median is ≈ 0.79).
4.1.6 Reviewer Activity
WebCore has 51 individuals performing code reviews of 95 % of patches. The breakdown of the reviewers by organization is as follows: 22 reviewers from Apple, 19 reviewers from Google, 3 reviewers from BlackBerry, Igalia and Intel are being represented by one reviewer each, and 5 reviewers belong to the group “others”. Comparing reviewing efforts, we noticed that while Apple is predominant in the number of reviewers, it reviews only 36 % of all patches; by comparison, Google developers perform 57 % of the total number of reviews. Since WebKit was originally developed and maintained by Apple, it is perhaps unsurprising that Apple remains a key gatekeeper of what lands in the source code. However, we can see that Google has become a more active contributor on the project, yet has not surpassed the number of Apple reviewers.
To find out whether reviewers have an impact on review delay and outcome, for each reviewer we calculated the number of previously reviewed patches and then discretized them according to their reviewing efforts using quartiles. Applying statistical tests, we determined that the difference for response time for A and B groups of reviewers (i.e., the less active ones) is statistically significant when compared to C or D groups (i.e., the more active ones). Since the distribution of delays is very skewed, we report both the median and mean values for reviewers’ timeliness (see Table 5). The results show that the choice of reviewers plays an important role on reviewing time. More active reviewers provide faster responses (with median being 57 minutes and mean being 496 minutes) compared to the individuals who performed fewer code reviews (the median for time is 84 minutes and 621 minutes for the mean).
Considering that reviewers’ work loads appear to affect their response rate, WebKit contributors may wish to ask the most active reviewers to assess their patches in order to get a quick response. With respect to the question whether there are reviewers who are inclined to be more positive than negative, we found that there is no correlation between the amount of reviewed patches on the reviewer positivity: 0.83 for group A, 0.84 for group B, 0.75 for group C, and 0.83 for group D. This suggests that WebKit reviewers stay true and unbiased in their role of ensuring the quality of code contributions. This observation is important since reviewers serve as gatekeepers protecting the quality of the project’s code base.
4.1.7 Patch Writer Experience
The contributions to WebCore during the period studied came from 496 individuals among which 283 developers filing 95 % of patches (submitting 5 patches or more). Considering our top five organizations, we identified that WebCore patches were submitted by 50 developers from Apple, 219 individuals from Google, 20 BlackBerry developers, 16 developers from Intel, 10 from Igalia, and 181 developers come from other organizations.
Noticing good contributor diversity in the WebCore community, we wondered if patches from certain developers have a higher chances of being accepted. To assess whether developer experience influences review timeliness and acceptance, we performed a similar procedure (as described in Section 4.1.6) of calculating the number of submitted changes for each developer and then discretizing patch owners according to their contributions.
We achieved similar results in the differences of response time for A and B groups of submitters (occasional contributors) is statistically significant compared to more experience developers in C or D groups. From Table 5 we conclude that more experienced patch writers receive faster responses (with median in group D being 48 minutes and mean being 478 minutes) compared to those who file fewer patches (the median for time in group A is 102 minutes and 682 minutes for the mean).
Investigating the impact of developer experience on positivity of the outcome, we found correlation between two variables (χ 2(3) = 17.93, p < 0.01). In particular, statistical difference was found between group A (least active developers) and groups C and D (more active developers) with the median positivity values being 1.0, 0.73 and 0.81 respectively, as well as group B (less active developers) compared to the group D (most active ones) with the median positivity being 0.63 and 0.81 respectively. These findings suggest that the WebKit community has a positive incentive for newcomers to contribute to the project as first-patch writers (i.e., group A with the median number of patches submitted being 1) are likely to get a positive feedback. For developers of group B (where contributions range between 3–6 patches) it is more challenging to get their patches in, while contributing to the project comes with the improved experience of landing patches and as a result with more positive outcomes.
Our findings show that developer experience plays a major role during code review. This supports findings from our previous work, where we have seen faster response time for core developers compared to the casual contributors on the project (Baysal et al. 2012). This appears to show that active developers are being rewarded with both faster response and more positive review outcome for their active involvement in the project.
4.2 Blink
Google forked WebKit to create the Blink project in April 2013. Google decided to fork WebKit because they wanted to make larger-scale changes to WebKit to fit their own needs that did not align well with the WebKit project itself. Several of the organizations who contributed to WebKit migrated to Blink after the fork (Protalinski 2013). Our data demonstrates that the following companies participate on Blink by submitting patches: Samsung, Opera, Intel, Adobe, Igalia, Yandex, and BlackBerry (this list is ordered by the number of contributions).
Every Blink patch is submitted to the project’s issue repository.Footnote 6 We extracted all patches by scraping the public Blink issue tracking system for the patches submitted between April 03, 2013 and January 07, 2014. The extracted dataset consists of 18,177 bugs, 37,280 patches, 721 emails and 64,610 review flags. We extracted the same information about issues, patches, and files as we did for the WebKit data (described in Section 3.1).
The reviewers on the Blink project approve patches by annotating it “LGTM” (“Looks Good To Me”, case-insensitive) on the patch and reject patches by annotating “not LGTM”. In this work, we consider WebKit’s review+/review- flags and Blink’s “lgtm”/“not lgtm” annotations as equivalent. Since Blink does not have an explicit review request process (e.g., review?), we infer requests by adding a review? flag a patch as soon as it is submitted to the repository. Since patches are typically committed to the version control system by an automated process, we define landed patches as those followed by the automated message from the “commit bot”. The last patch on the issue is likely to be the patch that eventually lands to the Blink’s source code repository. Committers could optionally perform a manual merge of the patches to the version control system, although we do not consider these due to their infrequence.
To determine developer’s organizational affiliations, we first inferred affiliations from the domain name of their email addresses. Then, we asked a Blink developer to confirm our guesses. To be consistent with our WebKit dataset, we marked independent developers contributing to the Blink project as “unknown”.
Data Filtering To clean up our our dataset, we performed pre-processing steps on the raw data similar to that of the WebKit study:
-
1.
We considered only patches that affect files within Source/core portion (the Blink team refactored WebCore to this directory) of the source repository reducing the total number of patches from 37,280 to 23,723.
-
2.
We further eliminated those patches that had not been reviewed, narrowing the input to 9,646 patches.
-
3.
We removed 5 % of slowest patches, eliminating those that took more than 80 hours to review.
-
4.
We eliminated the least active reviewers: those who performed less than 10 code reviews; this resulted in retaining a set of 174 reviewers out of the 223 individual reviewers performing code reviews for Blink.
After applying data filtering, the final Blink dataset consisted of 8,731 patches.Footnote 7 Table 8 contains the overview of the numerical factors.
4.2.1 Patch Size
To investigate the correlation between patch size and review response time we again split the patches according to their size into four equal groups (quartiles): A, B, C, and D. Group A refers to the smallest patches (0–25 %) with the average size of 4 lines, group B denotes small-to-medium size changes (25–50 %) on average having 18 lines of code, group C consists of the medium-to-large changes (50–75 %) with the mean of 63 LOC, and group D represents largest patches (75–100 %) with an average size of 698 lines of code. A Kruskal-Wallis test revealed a significant effect of the patch size group on acceptance time (χ 2(3) = 44.16, p < 0.01). Acceptance time for group A (the median time is 47 minutes, the mean is 368 minutes) is statistically different compared to the time for group C (with the median of 76 minutes and the mean of 444 minutes), and D (the median of 69 minutes and the mean of 388 minutes).
The median positivity values for groups A–D are all 0.99. Reviewers’ positivity remains quite high and does not appear to be affected by the size of the contributions.
Investigating the relationship between patch size and the number of patch revisions, we considered all the bug IDs that we have the patches for after applying our data filters. We calculated the number of patch revisions for each bug, as well as the size of the largest patch. Our results demonstrate statistically significant, strong impact of patch size on the rounds of revisions (χ 2(3) = 1473.7, p < 0.01. The median of the patch revisions for smaller patches of group A (under 22 LOC) is 1, while the highest number of resubmissions is 7. Group B (patch size ranges between 22–71 LOC) and group C (with the size between 72–205 LOC) has the same median value of resubmissions (on average 2 patches per issue), the highest number of patch revisions is 11 for group B and 23 for group C. The largest patches (on average of around 1,000 LOC) have more revisions than smaller patches with a median of 3 and a maximum of 30 resubmissions from group D.
4.2.2 Component
Blink’s source code is organized similar to the WebKit’s except that bindings and bridge have been removed.
We selected the same number of top actively developed components: dom (5,856 patches), rendering (5,732 patches), page (4,936 patches), html (4,934 patches), css (4,517 patches), inspector (2,938 patches), loader (2,305 patches). The difference in the response time between components was statistically significant (χ 2(6) = 40.75, p < 0.01); similar to the WebKit study, the rendering component takes longer to review (the median time is 89 minutes) compared to any other component including inspector (49 minutes), page (70 minutes), dom and html (58 minutes), and css (63 minutes).
We found no relationship between positivity and the component factor; the average positivity values for the components are quite high (0.98-0.99), suggesting that patches have high chance of being landed to these actively developed components.
4.2.3 Review Queue Length
Similar to the WebKit study, we calculated queue sizes for the reviewers at any given time (the process is described in Section 4.1.4). The resulting queues ranged from 0 to 14 patches and the average queue was 0.7 patches. Statistical tests showed that there is no significant effect of review queue size on neither reviewing time (χ 2(14) = 21.63, p = 0.086) nor positivity of the reviewers (χ 2(14) = 20.20, p = 0.124).
Thus, we found that the length of the review queue affects neither the review response time nor its outcome.
4.2.4 Organization
While Google developers submit 79.3 % of all patches, other organizations also contribute to the project including Samsung (8.7 %), Opera (3.8 %), Intel (2.9 %), Adobe (1.9 %) and Igalia (0.2 %), as well as independent individuals (3.1 %). To assess whether organization influences review response and outcomes, we grouped non-Google contributions together and labelled them as “other” and then compared this group against Google-only contributions.
We discovered that there is a statistically significant relationship between response time and which organization submits the patch. Regardless of the review outcome, patches from Google developers receive faster responses than patches coming from other organizations (57 minutes vs. 95 minutes). Table 6 reports the mean and medians of both accepted and rejected review times for each group. Google patches are accepted or rejected faster that patches from others.
In terms of the positivity, we found no difference in review outcomes for Google vs. “other” patches. This finding is somewhat expected since 98 % of reviews ares done by Google reviewers who appear to provide mainly positive reviews (see Section 4.2.5).
Comparing review response times, we noticed that the median values of both acceptance and rejection increase while the mean values decrease for Google reviewers participating on the Blink project vs. the WebKit project. While we do not have insights on why this happened, we speculate that Google focuses on rather accepting good contributions (the positivity values being very high) and providing constructive feedback to patch writers than just hurling quick negative feedbacks to the developers.
4.2.5 Reviewer Activity
Blink has 174 active reviewers performing code reviews. While the majority of the contributions to the Blink repository are reviewed by Google (98 %), other organizations perform the remaining 2 % of code reviews; Intel reviewed 75 patches, Samsung reviewed 41 patches, Adobe reviewed 13 patches, and independent developers reviewed 29 patches.
To determine whether reviewer activity as a factor has an effect on the response time, we calculated the number of previously reviewed patches for each reviewer and discretized reviewers according to their reviewing experience using quartiles (similar to the procedure we performed for WebKit). Statistical test showed that the difference for response time of less experienced reviewers (i.e., A and B groups of reviewers with the median response time of 71 minutes) is statistically significant (χ 2(3) = 62.14, p < 0.01) compared to more active ones (group C with median value of the reviewing time being 42 minutes). The difference in the response time for group C was also statistically significant compared to group D (median time is 91 minutes). We note that group D consists of one most active reviewer on the Blink project who reviewed 1,392 patches (15 % of all reviewed patches). Table 7 reports both the median and mean values for reviewers’ timeliness.
Looking at the reviewers’ involvement on the project and whether it affects their positivity, we found no correlation between reviewers’ positivity and their activity on the project. Positivity values remain similar for the group A, B, C and D with medians ranging between 0.99–1.0. This shows that reviewers provide positive feedback to almost all patches they review; it seems that Google reviewers use positive reinforcement when assessing contributions. If a patch is not quite ready to land to the source code, reviewers would discuss potential flaws and expect the patch to be resubmitted again for further review. Such behaviour is likely to increase response from developers submitting their patches.
4.2.6 Patch Writer Experience
The contributions to Blink’s core during the studied period came from 394 developers. While Blink is developed and maintained mainly by Google — they submit 78 % of all patches — other organizations also contribute patches to the Blink repository, including Samsung (757 patches), Opera (328 patches), Intel (256 patches), Adobe (170 patches), and Igalia (21 patches) and other independent developers (274).
To understand whether the experience of a patch writer affects the timeliness and outcome, we grouped developers according to their contributions (similar to the step described in Section 4.1.7). We found that the differences of response time for group A of submitters is statistically significant (χ 2(3) = 109.04, p < 0.01) when compared to more experienced developers (B, C and D groups). From the Table 7 we conclude that more experienced patch writers are more likely to get faster responses (the median for groups B, C, and D being 51, 59 and 56 minutes respectively) than those who have not gained enough experience in filing project contributions, individuals who submitted fewer than 30 patches (the median for group A of submitters is 106 minutes).
When investigating the impact of developer experience on the likelihood of patch acceptance, we found correlation between two variables (χ 2(3) = 32.65, p < 0.01). In particular, a statistical difference was found between group A (least active contributors) and groups C and D (more active developers), as well as group B compared to the group D (most active ones). However, the median and mean values for the groups are almost same, 1.0 for the median and mean values ranges between 0.98-0.99. The statistical difference accounts for the distribution of the positivity scores within each group, showing that the developers who are more actively involved on the project almost certainly can expect their patches to be accepted. On the other hand, the least active developers receive a fair amount of rejections. This conclusion also supports the overall code review culture that we have seen from the lifecycle model (shown in Fig. 3) — Google reviewers are inclined to accept patches with only very small portion (0.3 %) of the submitted patches receiving negative reviews; patches that need reworking are simply resubmitted again, after reviewers provide their comments about the potential flaws.
Our findings show that developer experience is a key factor when it comes to review outcomes and timeliness. Similar to the WebKit study, we see that more active developers on the Blink project receive faster responses and their patches have high chances of being approved.
5 Discussion
In this section, we discuss the results from two empirical studies. We start with highlighting similarities and differences between the WebKit and Blink findings and provide our answers to the research questions. Further, we offer other interpretations of the results and discuss threats to validity.
5.1 WebKit and Blink Comparison
When studying each factor individually, we found that almost all of the studied factors have a statistically significant effect on the review time across both projects: review queue showed no effect on time for Blink patches, and priority was not studied for Blink patches because they do not have priority levels.
In terms of review positivity, we detected more differences between two projects. Only patch writer experience has a statistically significant effect on positivity in both WebKit and Blink. Another two factors, organization and review queue, have a statistically significant effect on positivity only in WebKit. The last two factors, component and reviewer activity, showed no statistically significant effect on positivity in both projects.
We now present our answers to the research questions stated at the beginning of our work.
- RQ1::
-
What factors can influence how long it takes for a patch to be reviewed?
- RQ2::
-
What factors influence the outcome of the review process?


5.2 Other Interpretations
Drawing general conclusions from empirical studies in software engineering carries risk: any software development process depends on a potentially large number of relevant contextual variables, which are often non-obvious to outsiders. While our results show that certain non-technical factors have a statistically significant effect on the review time and outcome of patch submissions, understanding and measuring the practical significance of the results remains challenging. Processes and developer behaviour around their contributions to the WebKit project depend on the organization, its culture, internal structure, settings, internal development cycles, time pressures, etc. According to Beller et al. (2014), the type of a change (maintainability vs. functionality) might also account for the variations in time and outcome of code review.
Any of these “hidden” factors could potentially influence patch review delays and outcomes; for example, let us consider time pressures. It is our understanding that Apple prefers strict deadlines for shipping hardware, and the supporting software needs to match the projected delivery dates of the new hardware. This results in Apple developers prioritizing internal development goals over external ones, and thus prioritizing patches that help them meet their short-term objectives.
Organizational and geographical distribution of the developers may also provide insights into review delays. We understand that WebKit developers at Apple are co-located within the same building, which may account for a better visibility of the patches that their co-workers are working on; conversely, WebKit developers at Google tend to be more geographically distributed, which may result in a poorer awareness of the work of others.
In summary, understanding the reasons behind observable developer behaviour requires an understanding of the contexts, processes, and the organizational and individual factors that can influence code review and its outcome. Thus, while our results may be statistically valid, care must be taken in interpreting their meaning with respect to actual developer behaviour and intent. We consider that much work remains to be done in studying how best to interpret empirical software engineering research within the context of these “hidden” contextual factors.
5.3 Threats to Validity
Internal validity concerns with the rigour of the study design. In our study, the threats are related to the data extraction process, the selection of the factors that influence code review, and the validity of the results. While we have provided details on the data extraction, data filtering, and any heuristics used in the study, we also validated our findings with the WebKit developers and reviewers. We contacted individuals from Google, Apple, BlackBerry, and Intel and received insights into their internal processes (as discussed in Section 5.2). To ensure that we are on the correct track in interpreting the results of our studies, we talked to the WebKit and Blink developers via email (for Apple, Intel, Google), as well as had face-to-face meetings with Google and Blackberry developers at the respective local offices in Waterloo, Ontario (Canada). Face-to-face meetings included a presentation of the main findings followed by the discussion about possible explanations and insights into the “hidden” factors affecting code review process and practice.
When investigating the relation between patch size and the number of patch revisions, we assumed that patches are independent; this might have introduced some bias since several different patches can often be associated with the same bug ID and “mentally” form one large patch. However, for both studies we considered the size of the largest patch due to the lack of indication of which patches are actually comprising a larger patch and which patches are being resubmits.
Unlike Bugzilla’s issue tracking — which is used by both Mozilla and WebKit to carry out code review tasks — Blink’s code review system does not support history tracking of patch changes and lacks any explicit review requests. We overcome these limitations by inferring the review start times of Blink patches by considering the most recent patch (in terms of time) in a list of the patches followed by a review flag. This heuristic is a “best effort” approximation; unfortunately, accurate timestamps of the review starting point cannot be determined by scraping the data from the existing code review system.
Our empirical study is also subject to external validity concerns; we cannot generalize our findings to say that both organizational and personal factors affect code review in all open source projects. While we compared WebKit’s code review process with that of Mozilla Firefox, and found that its patch lifecycle is similar to open source projects, the fact that WebKit is being developed by competing organizations makes it an interesting case yet a rather obvious exception. Hence, more studies on similar projects are needed.
Statistical conclusion validity refers to the ability to make an accurate assessment of whether independent and dependent variables are related and about the strength of that relationship. To determine whether relationships between variables are statistically significant, we performed null hypothesis testing. We also applied appropriate statistical tests (analysis of variance, post-hoc testing, and Spearman’s correlation).
6 Related Work
Prior work related to this study can be divided into two areas: first, on code review in open source software development; and second, on the effect of organizational structure on the effectiveness. We now provide main findings for each area.
Rigby and German (2006) presented a first study that investigated the code review processes in open source projects. They compared the code review processes of four open source projects: GCC, Linux, Mozilla, and Apache. They discovered a number of review patterns and performed a quantitative analysis of the review process of the Apache project. Later Rigby et al. (2008) analyzed 2,603 patches of the Apache open source system and found that small, independent, complete patches are more likely to be accepted. They found that 44 % of submitted patches got accepted compared to 46 % in our study. In our study, we differentiate negative and positive reviews and investigate what factors may affect time to acceptance or rejection.
Weissgerber et al. (2008) performed data mining on email archives of two open source projects to study patch contributions. They found that the probability of a patch being accepted is about 40 % and that smaller patches have higher chance of being accepted than larger ones. They also reported that if patches are accepted, they are normally accepted quickly (61 % of patches are accepted within three days). Our findings show that 91 % of WebKit patches are accepted within 24 hours (ignoring slowest 5 % of patches from the analysis).
Bacchelli and Bird (2013) have studied modern code review by exploring the motivations, challenges and outcomes of toll-based code review. Their work provides insights and observations collected by surveying developers and managers across diverse teams of Microsoft.
We have previously studied the code review process of the Mozilla Firefox project, in particular the differences in the patch lifecycles and time taken for each transition for pre- and pos-rapid development models (Baysal et al. 2012). When analysing Firefox patch acceptance rate, we did not account for the patch size. In this study we investigated the affect of various factors and dimensions on the review time and outcome.
Jiang et al. (2013) studied the relation of patch characteristics with the probability of patch acceptance and the time taken for patches to be integrated into the codebase on the example of the Linux kernel. They found that patch acceptance is affected by the developer experience, patch maturity and priori subsystem churn, while reviewing time is impacted by submission time, the number of affected subsystems, the number of suggested reviewers, and developer experience. While their patch characteristics do not line up with the factors we studied, we agreed on the same finding that developer experience correlates with the review time. We also found that for the WebKit project response time is affected by the reviewer activity, organization, component, and patch size.
Most of the related studies on code review perform mining on project’s commit history, and thus are not able to reason about negative feedback and rejection interval. We extracted information from the WebKit’s issue tracking and code review systems, providing a more comprehensive view of the code review process.
While we are not aware of a published work on the WebKit case study, Bitergia’s blog provides a general analysis of the WebKit review process, highlighting trends and summaries of how organizations contribute to the project in terms of both patch submission and reviewing activity (Bitergia 2013).
7 Conclusion
WebKit is comprised of a complex community to which a variety of organizations contribute; these organizations compete at a business level while collaborating at a technical level. Ideally, the contributions of these organizations to be treated equally, based on their technical merits alone. While some influencing factors include the size of the patch itself or the part of the code base being modified, other non-technical factors have significant impact on the code review process. Our results provide empirical evidence that organizational and personal factors influence both review timeliness as well as the likelihood of a patch being accepted. Additionally, we found significant differences in how long a patch took to be reviewed based on the organizations that wrote and reviewed a given patch along with the final outcome of the review.
Ultimately, the most influential factors of the code review process on both review time and patch acceptance are the organization a patch writer is affiliated with and their level of participation within the project. The more active role a developer decides to play, the faster and more likely their contributions will make it to the code base.
Notes
Extracted data is stored in a database and made available online: https://cs.uwaterloo.ca/~obaysal/webkit_data.sqlite
Our Blink dataset is available online: https://cs.uwaterloo.ca/~obaysal/blink_data.sqlite
References
Bacchelli A, Bird C (2013) Expectations, outcomes, and challenges of modern code review. In: Proceedings of the 2013 international conference on software engineering, pp 712–721
Baysal O, Holmes R (2012) A qualitative study of mozilla’s process management practices. Tech. Rep. CS-2012-10, David R. Cheriton School of Computer Science, University of Waterloo, Waterloo, Canada. http://www.cs.uwaterloo.ca/research/tr/2012/CS-2012-10.pdf
Baysal O, Kononenko O, Holmes R, Godfrey M (2012) The secret life of patches: a firefox case study. In: Procedings of the 19th working conference on reverse engineering, pp 447–455
Baysal O, Kononenko O, Holmes R, Godfrey MW (2013) The Influence of Non-technical Factors on Code Review. In: Proceedings of the Working Conference on Reverse Engineering, pp 122–131
Beller M, Bacchelli A, Zaidman A, Juergens E (2014) Modern code reviews in open-source projects: Which problems do they fix? In: Proceedings of the 11th working conference on mining software repositories, pp 202–211
Bitergia (2013) Reviewers and companies in the webkit project. http://blog.bitergia.com/2013/03/01/reviewers-and-companies-in-webkit-project/
Conway M (1968) How do committees invent? Datamation 14(4):28–31
Herraiz I, German DM, Gonzalez-Barahona JM, Robles G (2008) Towards a simplification of the bug report form in eclipse. In: Proceedings of the 2008 international working conference on mining software repositories, pp 145–148
Jiang Y, Adams B, German DM (2013) Will my patch make it? and how fast? – case study on the linux kernel. In: Proceedings of the 10th IEEE working conference on mining software repositories. San Francisco, CA, US
Kruskal WH, Wallis WA (1952) Use of ranks in one-criterion variance analysis. J Am Stat Assoc 47(260):583–621
Lehmann E, D’Abrera H (2006) Nonparametrics: statistical methods based on ranks. Springer
Massey FJ (1951) The kolmogorov-smirnov test for goodness of fit. J Am Stat Assoc 46(253):8–78
Mozilla Super-review policy. https://www.mozilla.org/hacking/reviewers.html
Nagappan N, Murphy B, Basili V (2008) The influence of organizational structure on software quality: an empirical case study. In: Proceedings of the 30th International Conference on Software Engeneering, pp 521–530
Protalinski E (2013) Opera confirms it will follow google and ditch webkit for blink, as part of its commitment to chromium. http://thenextweb.com/insider/2013/04/04/opera-confirms-it-will-follow-google-and-ditch-webkit-for-blink-as-part-of-its-commitment-to-chromium/
Rigby P, German D (2006) A preliminary examination of code review processes in open source projects. Tech. Rep. DCS-305-IR, University of Victoria, Canada
Rigby PC, German DM, Storey MA (2008) Open source software peer review practices: a case study of the apache server. In: Proceedings of the 30th international conference on software engineering, pp 541–550
Weissgerber P, Neu D, Diehl S (2008) Small patches get in! In: Proceedings of the 2008 international working conference on mining software repositories, pp 67–76
Acknowledgments
We thank the WebKit and Blink developers we talked to for their insights into the source code hierarchy and the review process.
Author information
Authors and Affiliations
Corresponding author
Additional information
Communicated by: Romain Robbes, Massimiliano Di Penta and Rocco Oliveto
Rights and permissions
About this article

Cite this article
Baysal, O., Kononenko, O., Holmes, R. et al. Investigating technical and non-technical factors influencing modern code review. Empir Software Eng 21, 932–959 (2016). https://doi.org/10.1007/s10664-015-9366-8
Published:
Issue Date:
DOI: https://doi.org/10.1007/s10664-015-9366-8