
Abstract
The benefits of the forests are well known and are by their existence alone an amenity. Nonetheless, urbanization as one of the most remarkable features of social development has immense effects on forest resources and land use. In this study, it is hypothesized that there are temporal interactions among the rural population dynamics, urbanization, and forest resources. Data set is based on rural population, total population, and forest areas for the period of 1990–2017. Regression analysis (the ordinary least square, OLS) and dummy variable in regression were used by taking the years into consideration. The coefficient of total population in the regression model developed in our study was positive, which means with the increasing total population, there is an increase in forest areas as well, contrary to common opinion in the literature. With this study, a positive/linear temporal relation between the forest area and urbanization via the regression statistics was determined. There is a significant inverse relation between rural population decline and forest area increase too. Our results provide also a compelling evidence that rural population mobility, afforestation, and forestry policy have strong effects and play an important role over the forest management and forest policy in Turkey.
Introduction
In a society, political and economic elements of development consisting of social structure, knowledge, powers, livelihood quality (both socially and environmentally understandable in general), and ecological resilience have aroused as especially prominent aspects of human/environment interactions (Nightingale 2003). Human activities and environmental issues are the two most common research subjects as well (Gibson 2018). In the sense of the biological concept, that argument stems from the carrying capacity of natural resources such as water, air, soil (Ramakrishnan 1998), and forests. Forests are an inherent component of the landscape and existence of mankind (Ciesielski and Stereńczak 2018); provide multiple benefits to multiple users (Kishor and Belle 2004); improve the environmental quality, economic opportunity, and esthetic values (Sanesi et al. 2007; Marziliano et al. 2013; Coletta et al. 2016); behave like biodiversity vaults (Christopoulou et al. 2007); and are an important carbon storage affecting climate change by acting like a regulator in ecosystem services (MAE 2003; Delphin et al. 2016). The benefits generated from forests are widely known and are by their existence alone an amenity. That is why, the forest protection must be considered with regard to social, economic, and political nature and habits (Piussi and Farrell 2000). They are increasingly at risk due to climate change, pests, diseases, exploitation, and urbanization (Coletta et al. 2016).
Urbanization has gained attention as one of the most noteworthy features of social development (Li et al. 2012; He et al. 2016; Allington et al. 2017) via the rural to urban migration; thus, population has been excepted as a dominant trend globally (UNFPA 2007) in the twentieth century. Hence, cities have become the most important habitats for the people (Su et al. 2011). By 2050, the population in the world is predicted to reach 9 billion which was once 6 billion in 2000 and 3 billion in 1960 (UNFPA 2007). The pressure emerging from population is a great distress for the developing world, albeit the immensely restricted per capita demand for resources in the developing countries (Ramakrishnan 1998). Increase in population will cause land use and cover changes (LULCC) in a significant way and hinder the provisioning ecosystem services (Vitousek et al. 1997; MAE 2003; EC 2009; Hoyer and Chang 2014). Rural population dynamics may cause two opposite scenarios of LULCC and are not tied to just one factor (Blaikie and Brookfield 1987). It is also the main subject of environmental and ecological change (GLP 2005; Mooney et al. 2013), deforestation, or forest transition (Angelsen and Kaimowitz 1999; Grau and Aide 2008; Taylor et al. 2016). Expanding urbanization throughout non-urban lands for new urban areas is a significant anthropogenic factor that affects ecosystems (Bengston et al. 2005; Zhang et al. 2012; Yue et al. 2013; He et al. 2016; Delphin et al. 2016), directly through the transformation of vegetation into urban infrastructure (Pennington et al. 2010). LULCC has transformed environmental and natural ecosystems via rapid urbanization (Huang et al. 2009; Lin and Ben 2009; Göl et al. 2011; Liu et al. 2014) and is under the growing pressure of the anthropogenic stressors (Sicard et al. 2016). As an ecosystem, forests are highly vulnerable/sensitive to anthropologic activities (Lele et al. 2008) as well. Deforestation rates are far from being uniform across the world (Allen and Barnes 1985). Although deforestation has declined, it is still a serious problem in scope and quantity (Köthke et al. 2013; Calle et al. 2016) and is a real trend almost in all developing countries (Allen and Barnes 1985). Understanding drivers of deforestation has an important role to develop policies and measures allowing modifications in current trend in forestry towards a more climate/biodiversity/ecosystem friendly outcomes (Kissinger et al. 2002; Hosonuma et al. 2012; Van Khuc et al. 2018) and to get long-term social-ecological sustainability (Allen and Padgett Vásquez 2017). Furthermore, assessment of the effects of LULCC in the sense of ecology and environment could also provide a starting point for decisions on land use, environmental governance, and urban planning when deforestation is taken into account.
It is hard to draw obvious causal linkages among the migration, urbanization, LULCC, and deforestation due to its influential interactions with other causes (Gray and Bilsborrow 2014; Walters 2016; Erkan Buğday and Özden 2017). Urbanization deserves special emphasis as it converts forestlands to many kinds of other developments (De Chant et al. 2010), because the migratory patterns could have important social effects depending on changing conditions (Ramakrishnan 1998). A few studies condense on implications such as degradation of multi-environmental forest functions (i.e., conservation of biodiversity, regulatory functions on microclimate, removal of atmospheric pollutants, preservation of water resources, soil protection from erosion, and flooding); reduce in recreation opportunities; and devious damaging effects on present economic activities (Christopoulou et al. 2007). Thus, this paper explores and explains the relationship among rural population dynamics, migration, urbanization, and deforestation by asking the following questions: (i) Did urbanization affect forest policies in Turkey? (ii) How did the forest resources change, and which factors influenced that? To answer these questions, we analyzed the population trends and changes in forest resources from 1990 to 2017. It is also explored the potential relationships between these variables. We conducted an empirical study to evaluate the effect of urbanization (from rural areas to urban areas) with currently available data. There are many studies on migration related to its socioeconomic and cultural dimensions (Walters 2016), but there are few studies, which specifically examine the influence of urbanization on forest resources in Turkey. We hypothesized that there are temporal interactions among rural population dynamics such as migration, urbanization, and forest resources.
Material and methods
Data description
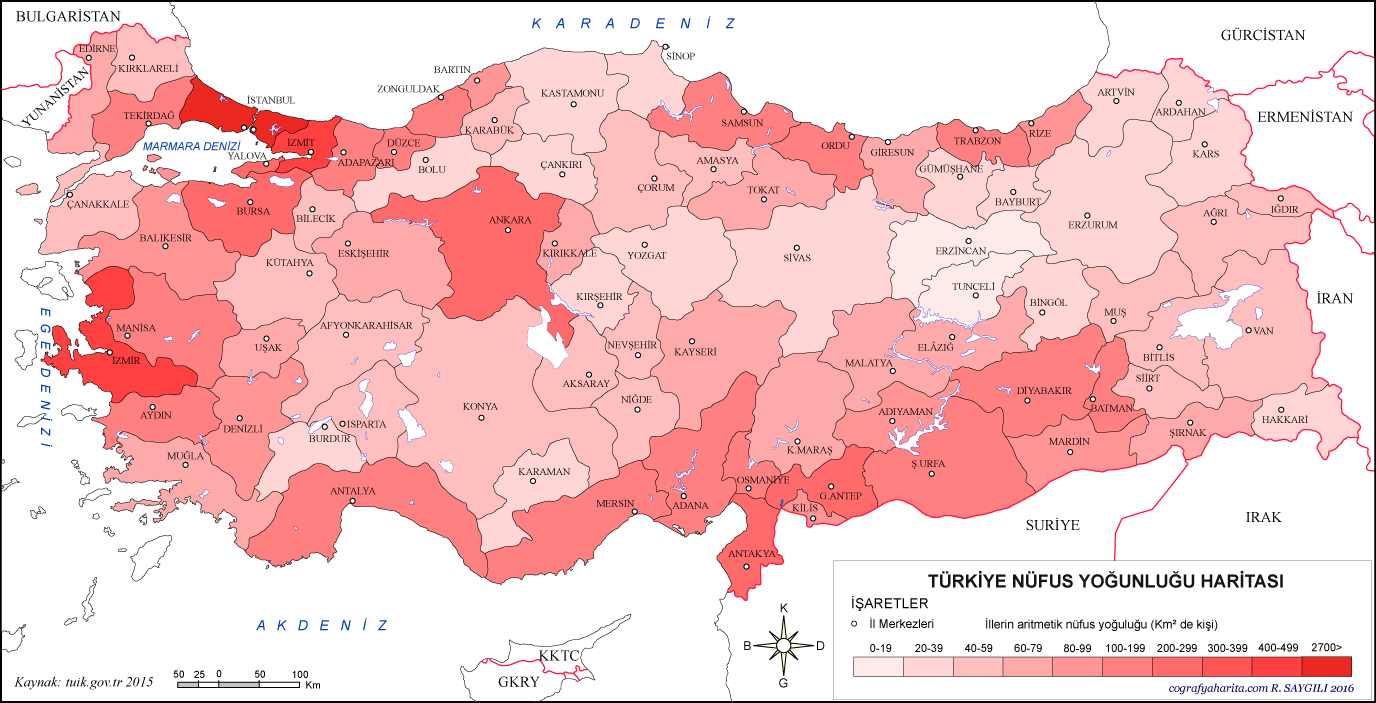
Data used in the study are the official data gathered from various relevant institutions, of which are General Directorate of Forestry (GDF), Ministry of Development, and Turkish Statistical Institute of Turkey. In the 1990s, the population increased by about six times. Referring to changes both in the rural and urban population in 1927, mechanization in agriculture has caused a decrease in rural population and was approximately 76%, in the 1950s. A detailed map for the population density in Turkey is given in Fig. 1.

The population density in Turkey (Saygılı 2016) (The place that is shown in a circular is the capital of Turkey)
As of 2017, the rate of rural population fell to 7.5% and urban population increased to 92.5%. In addition to that, 7.1 million people representing about 8.7% of the total population live in 21.723 forest villages in or nearby forests (OGM 2014, 2015, 2017) (Table 1).
Data set used in this study is based on the amount of rural population, total population, and forest areas for the period of 1990–2017. The period was taken between 1990 and 2017 because data for the pre-1990 period were not available for some of the variables.
There has been an increase of 2.143.639-ha forest area since the first forest inventory in 1963 (OGM 2015). Figure 2 shows the forest cover distribution in Turkey. A total of 2.338.073 ha was afforested throughout the history of the Republic in Turkey. According to official statistics for the period of 1990–2016, which we took as a base for our research, a total of 957.662 ha was afforested, which represents 40% of all afforestation. As of 2017, according to the management plans, the total forest area amounted to 22.342.935 ha, of which 12.704.148 ha productive and 9.638.787 ha nonproductive (OGM 2015, 2017).

Forest cover in Turkey (OGM 2017) (The place that is shown in a circular is the capital of Turkey)
To understand and to see both the density of forest cover and population at the same time, Fig. 3 is given.

Forest density in provinces of Turkey (OGM 2017) (The place that is shown in a circular is the capital of Turkey)
Data analysis
Minimum, maximum, mean, and standard deviation for the forest area, rural population, and total population are given in Table 2 and their yearly changes are shown in Table 3. While data on the forest area could be obtained at regional level (Fig. 4), rural population could be obtained at country level. Thus, we did not evaluate our data set at regional level. A flowchart explaining the designed study is shown in Fig. 4.

Flowchart explaining the designed data processing procedure
We conducted an analysis of our data by years. Regression analysis (the ordinary least square, OLS) was separately performed to describe relationships between the amount of forest area-total population and the amount of forest area-rural population for each year.
where βFA is the parameter vector to be estimated and εFA is the error term associated with models.
Rural population mobility was a critical factor, affecting the change in forest areas. Therefore, we also focused on temporal change of rural population mobility. So, regression analysis with dummy variable was used for evaluating the effects of temporal variation in rural population on change in forest areas. In our study, all analyses were made by using SPSS® software package 22 IBM Inc., USA. The equation belongs to dummy variable approach is as follows:
where Y is the actual forest area, X is the rural population, β1 and β2 are the fitting parameters, S is the dummy variable, and ε is the error term.
Evaluation method
We evaluated OLS and dummy variable approach for rural population in terms of goodness-of-fit statistics, including the adjusted coefficient of determination (\( {R}_{\mathrm{adjusted}}^2 \)) and the percentage of root mean squared error (RMSE (%)).
where n is the number of observed data, p is the number of fitting parameters, yi is the observation value for ith forest area, and \( {\widehat{y}}_i \) is the prediction value for ith forest area. In addition, we evaluated model performance visually by error patterns. We also evaluated these relationships in detail in terms of rural mobility, afforestation, and forest policies because rural mobility is often not sufficient alone to explain the forest area changes. Therefore, information on afforestation and forest policies are needed to comprehensively evaluate the relationships among these factors.
Results and discussion
Determination of the relationships by OLS technique
The first analysis was performed using total population as an explanatory variable. The regression model developed for the 1990–2000 period explained 38% of the forest area variability. This value was 87% for the 2001–2010 period and 78% for the 2011–2017 period (Table 4).
When rural population was used as an explanatory variable, 23%, 80%, and 29% of the forest area variability for 1990–2000 (R1 model), 2001–2010 (R2 model), and 2011–2017 (R3 model) period were explained, respectively (Table 5). Except for models R1 and R3, others were significant at 95% significance level, which was attributed to the inadequacy of data. R1 model was not significant but it might be tolerated owing to the fact that it had P value of 0.07. However, the coefficient of rural population parameter in R1 model was positive. With the decreasing rural population, it is expected to increase in forest areas. While the R3 model was not significant at 95% level, its results were similar to actual values. Therefore, we decided to use the R2 and R3 to explain the relationship between the rural population and forest area.
The coefficient of total population in the regression model developed in our study was positive, that means with the increasing total population, there is an increase in forest areas as well. This result was inconsistent with the results of d’Annunzio et al. (2015). They found that forest cover changes in West Asia were stable for the 1990–2010 period. Our results showed a reasonable increase in forest areas for the same period in Turkey. However, Keenan et al. (2015) reported 10.6% of the increase in forest area from 1990 to 2015 for West Asia. Similarly, the percentage change in forest areas of Turkey for the period of 1990–2017 was 10.6.
Delineating the population movements taking place in Turkey in the last 50 years, internal migration can be examined mainly in three separate periods (1950–1960, 1960–1980, 1980–2000). The results revealed that the rural population mobility has strong effects on the change of forest area; the increase of the village populations; the limited supply of agricultural land, and the uneven distribution of land ownership. The increase in labor originated from industrialization has been influential on migration trend over villagers who are seeking for better health and education services in urban areas. In the 1980–2000 period, all obstacles to the mobility and migration within the country were overcome with investments in transportation infrastructure and communication and information technology. Therefore, the temporal analysis of rural population mobility (migration from rural to urban) is necessary for an adequate understanding of the forest area changes.
Analysis of temporarily rural mobility by DVR
When we did not take temporal variation in rural population into account, the adjusted coefficient of determination (\( {R}_{\mathrm{adj}}^2 \)) was 0.62, but when we did, \( {R}_{\mathrm{adj}}^2 \) increased from 0.62 to 0.94 as in Table 6. The inclusion of dummy variable method (M2) to the model contributed substantially the model performance. In addition, RMSE was lower for M2 method than OLS (M1) method in predicting forest area.
The results showed that the correlation coefficient between actual and predicted forest area was 0.96 for M2 method and 0.78 for M1 method (Fig. 5). The distribution of error terms for both methods indicated that there is an overestimation across the range of our data in predicting forest area (Fig. 6). However, that of M2 method showed a decreasing trend with increasing predicted values indicating that M2 method was more reliable than M1 method in predicting forest area. The results revealed that the rural population mobility has strong effects on the change of forest area.

Scatter plots for actual versus predicted values of forest area by OLS (left) and dummy variables in regression (DVR) (right)

Distribution of standardized residuals for OLS method (left) and dummy variables in regression (DVR) (right)
The number of people employed in rural areas has decreased substantially after the year 2002 (Yakışık and Zülfikar 2013). This situation caused migration from rural to urban and thus the social pressure on the forests has reduced. While the regression model improved (R1 model) for the 1990–2000 period explained 23% of forest area variability, the R2 model had a high explanatory after the 2001–2010 period and the coefficient of rural population was negative (Table 5). This result indicated the decreasing social pressure on the forests.
Evaluation of the factors relation to change in forest areas
Performance of the R1 and R3 was inadequate for the 1990–2000 and 2011–2017 period (Table 5) since the afforestation and forest policies have an important influence on forest area change for the mentioned period and their effects could not be included in the regression model. Rapidly growing population, urbanization, economic activities, and varying consumption habits increased the pressure on the environment and natural resources (KB 2013). Turkey carries out policies and practices to improve life quality and to protect the environment along with economic and social development in order to safeguard future generations to benefit from scarce natural resources. About half of the forests in Turkey is degraded. Reforestation and rehabilitation of such areas have a special significance in Turkey’s forest policy since 1937 (OGM 2012).
While the decrease in forest areas in Turkey is an expected situation due to forest degradation and losses caused by population growth, migration, and rapid urbanization, in the last 30 years, there is a remarkable increase (about 1 million ha) in forest areas. In the emergence of this result, the strong political desire to increase the spatial size of forest areas through the protection, development, and afforestation, the effective and continuously updated legal legislation (national and international), and the perception of society to nature and forests have played an important role. Tables 7 and 8 show the political and legal basis, which have influenced the expansion of forest areas over the years.
When the past and present situations are evaluated together in general and while the current yearly increase in the growing stock and increment is remarkable, it is also remarkable that the ratio of tree felling is decreasing, and leading a political shift from mere timber production to multipurpose use (Ecological and Socio-cultural) in recent periods (Keleş et al. 2017) (Table 9).
Regeneration of the forests in areas where human impact decreased is also noteworthy. In recent years, clear cuts have been reduced in coppice forests and speeding up the conversion of these areas into high forest has been accelerated. Private afforestation efforts in Turkey have started in 1986. It is expected that the promotion of private afforestation by the afforestation legislation, the development of the people’s environmental consciousness, and the changes in the understanding of Statism shall take this ratio beyond. International agreements on forestry have also been implemented. In this context, the Forestry Sector Review Study was prepared in cooperation with the World Bank, and Turkey’s National Forestry Program was prepared with the support of the FAO. The identification and implementation of the National Criteria and Indicators for Sustainable Forest Management are important outcomes of international process/support (DTP 2007).
Conclusion
Turkey has adopted sustainable development as a main forest policy in the early 1930s. In particular, sustainable development was at the forefront of the basic principles. However, rapidly growing population, urbanization, economic activities, and diversified consumption habits have increased the pressure on the environment and natural resources. The most basic nature of the relationship between the population and the environment is in the form of mutual interaction. This interaction is realized through intermediate variables of social and economic nature. For example, size, distribution, and increase rate of the population are influential on variables such as land, income distribution, and consumption level which affect the use of natural resources (water, air, soil, forests, minerals) as volume and productivity (rate of transformation). From this point of view, the population will continue to impact the environment through destruction of forests and shrubs, the abandonment of rangelands, and fallow requirements in agriculture (DPT 1997).
The decline in the rural population due to the immigration has altered the pressure on forest resources. In addition, the decrease in land clearing for agriculture, forest degradation, and natural forest regeneration of the abandoned lands has increased the forest areas. Nevertheless, in Turkey, the neglects to migrants and their problems have been maintained (Alkan 2014). This study shows a temporal relation between the forest area and urbanization via the regression statistics. That is also very clear in the official inventories, which shows the changes in main functions of the forests as in Table 7.
There are rapid changes among the main functions of the forests—a 10% increase at ecological functions and a 3% increase at socio-cultural functions from 2012 to 2015. In 2015, economic functions rate was well below the 13% for the 2012 rate steaming from changing demands caused by the urbanization and socioeconomic factors that are also affecting the forest policy and management. The rural population mobility, especially decrease in rural population, is highly influential on forest policy and management that, even when we only consider the conversion of coppice forests (6.344.908 ha in 1999 and 2.723.217 ha in 2015) to high forests via the functional forest planning, we can see that effect. For further research, interchanges in population between the regions are more important than the chances in county/cities.
References
ADNKS (2013). Adrese Dayalı Nüfus Kayıt Sistemi. Accessed 4 Mar 2016. http://tuikapp.tuik.gov.tr/ADNKS.
Alkan, S. (2014). Kırsal Nüfus Değişiminin, Ormanlar ve Ormancılık Üzerine Etkileri (Trabzon İli Örneği). Kastamonu University Journal of Forestry Faculty, 14(1), 69–78.
Allen, J. C., & Barnes, D. F. (1985). The causes of deforestation in developing countries. Annals of the Association of American Geographers, 75(2), 163–184.
Allen, K. E., & Padgett Vásquez, S. (2017). Forest cover, development, and sustainability in Costa Rica: can one policy fit all? Land Use Policy, 67, 212–221.
Allington, G. R. H., Li, W., & Brown, D. G. (2017). Urbanization and environmental policy effects on the future availability of grazing resources on the Mongolian Plateau: modeling socio-environmental system dynamics. Environmental Science & Policy, 68, 35–46.
Angelsen, A., & Kaimowitz, D. (1999). Rethinking the causes of deforestation: lessons from economic models. The World Bank Research Observer, 14(1), 73–98.
Bengston, D. N., Potts, R. S., Fan, D. P., & Goetz, E. G. (2005). An analysis of the public discourse about urban sprawl in the United States: monitoring concern about a major threat to forests. Forest Policy and Economics, 7(5), 745–756.
Blaikie, P., & Brookfield, H. (1987). Land degradation and society. London: Methuen.
Calle, L., Canadell, J. G., Patra, P., Ciais, P., Ichii, K., Tian, H., Kondo, M., Piao, S., Arneth, A., Harper, A. B., Ito, A., Kato, E., Koven, C., Sitch, S., Stocker, B. D., Vivoy, N., Wiltshire, A., Zaehle, S., & Poulter, B. (2016). Regional carbon fluxes from land use and land cover change in Asia, 1980–2009. Environmental Research Letters, 11(7), 074011.
Christopoulou, O., Polyzos, S., & Minetos, D. (2007). Peri-urban and urban forests in Greece: obstacle or advantage to urban development? Management of Environmental Quality: An International Journal, 18(4), 382–395.
Ciesielski, M., & Stereńczak, K. (2018). What do we expect from forests? The European view of public demands. Journal of Environmental Management, 209, 139–151.
Coletta, V., Lombardi, F., Altieri, V., Bombino, G., Marcianò, C., Menguzzato, G., & Marziliano, P. A. (2016). Environmental resources conservation through sustainable forest management. Procedia - Social and Behavioral Sciences, 223, 758–763.
d’Annunzio, R., Sandker, M., Finegold, Y., & Min, Z. (2015). Projecting global forest area towards 2030. Forest Ecology and Management, 352, 124–133.
De Chant, T., Hernando Gallego, A., Velázquez Saornil, J., & Kelly, M. (2010). Urban influence on changes in linear forest edge structure. Landscape and Urban Planning, 96(1), 12–18.
Delphin, S., Escobedo, F. J., Abd-Elrahman, A., & Cropper, W. P. (2016). Urbanization as a land use change driver of forest ecosystem services. Land Use Policy, 54, 188–199.
DPT (1997). Ulusal Çevre Eylem Planı. Devlet Planlama Teşkilatı, Ankara.
DTP (2007). Dokuzuncu Kalkınma Planı Ormancılık Özel İhtisas Komisyonu Raporu. Ankara.
EC (2009). Ecosystem goods and services European Commission. Accessed 22 Mar 2017. http://ec.europa.eu/environment/nature/info/pubs/docs/ecosystem.pdf.
Erkan Buğday, S., & Özden, S. (2017). The relationship between terrain and rural migration (1965–2013) on the north of Turkey (the case of Kastamonu). Environmental Monitoring and Assessment, 189(4), 154.
Gibson, J. (2018). Forest loss and economic inequality in the Solomon Islands: using small-area estimation to link environmental change to welfare outcomes. Ecological Economics, 148, 66–76.
GLP (2005). Science plan and implementation strategy. Stockholm.
Göl, C., Özden, S., & Yilmaz, H. (2011). Interactions between rural migration and land use change in the forest villages in the Gökçay Watershed. Turkish Journal of Agriculture and Forestry, 35, 247–257.
Grau, H.R., Aide, M. (2008). Globalization and land use transitions in Latin America. Ecology and Society, 13(2), 60p.
Gray, C. L., & Bilsborrow, R. E. (2014). Consequences of out-migration for land use in rural Ecuador. Land Use Policy, 36, 182–191.
He, C., Zhang, D., Huang, Q., & Zhao, Y. (2016). Assessing the potential impacts of urban expansion on regional carbon storage by linking the LUSD-urban and InVEST models. Environmental Modelling & Software, 75, 44–58.
Hosonuma, N., Herold, M., De Sy, V., De Fries, R. S., Brockhaus, M., Verchot, L., Angelsen, A., & Romijn, E. (2012). An assessment of deforestation and forest degradation drivers in developing countries. Environmental Research Letters, 7(4), 044009.
Hoyer, R., & Chang, H. (2014). Assessment of freshwater ecosystem services in the Tualatin and Yamhill basins under climate change and urbanization. Applied Geography, 53, 402–416.
Huang, S., Meng, S. X., & Yang, Y. (2009). Estimating a nonlinear mixed volume-age model with and without taking into account serially-correlated errors: differences and implications. Modern Applied Science, 3(5), 3–20.
KB (2013). Onuncu Kalkınma Planı (2014–2018). Ankara.
Keenan, R. J., Reams, G. A., Achard, F., de Freitas, J. V., Grainger, A., & Lindquist, E. (2015). Dynamics of global forest area: results from the FAO global forest resources assessment 2015. Forest Ecology and Management, 352, 9–20.
Keleş, S., Durusoy, İ., & Çakır, G. (2017). Analysis of the changes in forest ecosystem functions, structure and composition in the Black Sea region of Turkey. Journal of Forestry Research, 28(2), 329–342.
Kishor, N., & Belle, A. (2004). Does improved governance contribute to sustainable forest management? Journal of Sustainable Forestry, 19(1–3), 55–79.
Kissinger, G., Herold, M., & De Sy, V. (2002). Drivers of deforestation and forest degradation: A synthesis report for REDD+ Policymake. Kissinger, G Herold, M De Sy, Veronique, 1–46.
Köthke, M., Leischner, B., & Elsasser, P. (2013). Uniform global deforestation patterns—an empirical analysis. Forest Policy and Economics, 28, 23–37.
Lele, N., Joshi, P. K., & Agrawal, S. P. (2008). Assessing forest fragmentation in northeastern region (NER) of India using landscape matrices. Ecological Indicators, 8(5), 657–663.
Li, Y., Li, Y., Zhou, Y., Shi, Y., & Zhu, X. (2012). Investigation of a coupling model of coordination between urbanization and the environment. Journal of Environmental Management, 98, 127–133.
Lin, S.-W., & Ben, T.-M. (2009). Impact of government and industrial agglomeration on industrial land prices: a Taiwanese case study. Habitat International, 33(4), 412–418.
Liu, Y., Huang, X., Yang, H., & Zhong, T. (2014). Environmental effects of land-use/cover change caused by urbanization and policies in Southwest China Karst area – a case study of Guiyang. Habitat International, 44, 339–348.
MAE. (2003). Ecosystems and human well-being: a framework for assessment. Washington D.C.: Millennium Ecosystem Assessment Island Press.
Marziliano, P. A., Lafortezza, R., Colangelo, G., Davies, C., & Sanesi, G. (2013). Structural diversity and height growth models in urban forest plantations: a case-study in northern Italy. Urban Forestry & Urban Greening, 12(2), 246–254.
Mooney, H. A., Duraiappah, A., & Larigauderie, A. (2013). Evolution of natural and social science interactions in global change research programs. Proceedings of the National Academy of Sciences of the United States of America, 110(Suppl(Supplement 1)), 3665–3672.
Nightingale, A. (2003). Nature–society and development: social, cultural and ecological change in Nepal. Geoforum, 34(4), 525–540.
OGM (2012). Annual administrative activity report. Ankara.
OGM (2014). Ormancılık İstatistikleri.
OGM (2015). Türkiye Orman Varlığı. Ankara.
OGM (2017). Türkiye Orman Varlığı. https://www.ogm.gov.tr/ekutuphane/Yayinlar/TürkiyeOrman arlığı-2016-2017.pdf.
Pennington, D. N., Hansel, J. R., & Gorchov, D. L. (2010). Urbanization and riparian forest woody communities: diversity, composition, and structure within a metropolitan landscape. Biological Conservation, 143(1), 182–194.
Piussi, P., & Farrell, E. P. (2000). Interactions between society and forest ecosystems: challenges for the near future. Forest Ecology and Management, 132(1), 21–28.
Ramakrishnan, P. S. (1998). Ecology, economics and ethics. International Journal of Social Economics, 25(2/3/4), 207–225.
Sanesi, G., Lafortezza, R., Marziliano, P. A., Ragazzi, A., & Mariani, L. (2007). Assessing the current status of urban forest resources in the context of Parco Nord, Milan, Italy. Landscape and Ecological Engineering, 3(2), 187–198.
Saygılı, R. (2016). Population density of Turkey. http://cografyaharita.com/haritalarim/4aturkiye-2015-nufus-yogunlugu-haritasi.png.
Sicard, P., Augustaitis, A., Belyazid, S., Calfapietra, C., de Marco, A., Fenn, M., Bytnerowicz, A., Grulke, N., He, S., Matyssek, R., Serengil, Y., Wieser, G., & Paoletti, E. (2016). Global topics and novel approaches in the study of air pollution, climate change and forest ecosystems. Environmental Pollution, 213, 977–987.
Su, S., Jiang, Z., Zhang, Q., & Zhang, Y. (2011). Transformation of agricultural landscapes under rapid urbanization: a threat to sustainability in Hang-Jia-Hu region, China. Applied Geography, 31(2), 439–449.
Taylor, M. J., Aguilar-Støen, M., Castellanos, E., Moran-Taylor, M. J., & Gerkin, K. (2016). International migration, land use change and the environment in Ixcán, Guatemala. Land Use Policy, 54, 290–301.
TKİB (2011). Kırsal Kalkınma Planı (2010–2013). Ankara.
TÜİK (2011). Adrese Dayalı Nüfus Kayıt Sistemi Sonuçları. Accessed 8 Mar 2017. http://www.tuik.gov.tr/PreHaberBultenleri.do?id=10736.
TÜİK (2012). Göstergeler. Accessed 13 May 2017. http://www.tuik.gov.tr/Gosterge
TÜİK (2016). Haber Bülteni. Accessed 13 May 2017. http://www.tuik.gov.tr/PreHaberBultenleri.do?id=21507.
Ünal, H.E., Birben, Ü., 2016. Rural Development and Forests in Turkey. In Šulek Rastislav, Hrib Michal, Šodková Miroslava (Eds.), 17th International Symposium on Legal Aspects of European Forest Sustainable Development, Prague, Czech Republic, May 18– 20, 2016, (pp. 35-44): Czech University of Life Sciences Prague.
UNFPA (2007). State of the world population. Unleashing the potential of urban growth.
Van Khuc, Q., Tran, B. Q., Meyfroidt, P., & Paschke, M. W. (2018). Drivers of deforestation and forest degradation in Vietnam: an exploratory analysis at the national level. Forest Policy and Economics, 90, 128–141.
Vitousek, P. M., Mooney, H. A., Lubchenco, J., & Melillo, J. M. (1997). Human domination of earth’s ecosystems. Science, 277(5325), 494–499.
Walters, B. B. (2016). Migration, land use and forest change in St. Lucia, West Indies. Land Use Policy, 51, 290–300.
Yakışık, H., & Zülfikar, B. Ş. (2013). 2000 Sonrası Türkiye’de Kırsal ve Kentsel Yoksulluk: Kırsal Yoksullukla Mücadele Uygulama Örnekleri. Çukurova Üniversitesi İktisadi ve İdari Bilimler Fakültesi Dergisi, 17(2), 424.
Yue, W., Liu, Y., & Fan, P. (2013). Measuring urban sprawl and its drivers in large Chinese cities: the case of Hangzhou. Land Use Policy, 31, 358–370.
Zhang, C., Tian, H., Chen, G., Chappelka, A., Xu, X., Ren, W., Hui, D., Liu, M., Lu, C., Pan, S., & Lockaby, G. (2012). Impacts of urbanization on carbon balance in terrestrial ecosystems of the southern United States. Environmental Pollution, 164, 89–101.
Acknowledgements
The authors are grateful to Dr. Sabit Erşahin for his suggestions and two anonymous reviewers for the valuable comments.
Author information
Authors and Affiliations
Corresponding author
Additional information
Publisher’s Note
Springer Nature remains neutral with regard to jurisdictional claims in published maps and institutional affiliations.
Rights and permissions
About this article

Cite this article
Ünal, H.E., Birben, Ü. & Bolat, F. Rural population mobility, deforestation, and urbanization: case of Turkey. Environ Monit Assess 191, 21 (2019). https://doi.org/10.1007/s10661-018-7149-6
Received:
Accepted:
Published:
DOI: https://doi.org/10.1007/s10661-018-7149-6