
Abstract
Magnetoencephalography (MEG) is a noninvasive imaging method for localization of focal epileptiform activity in patients with epilepsy. Diffusion tensor imaging (DTI) is a noninvasive imaging method for measuring the diffusion properties of the underlying white matter tracts through which epileptiform activity is propagated. This study investigates the relationship between the cerebral functional abnormalities quantified by MEG coherence and structural abnormalities quantified by DTI in mesial temporal lobe epilepsy (mTLE). Resting state MEG data was analyzed using MEG coherence source imaging (MEG-CSI) method to determine the coherence in 54 anatomical sites in 17 adult mTLE patients with surgical resection and Engel class I outcome, and 17 age- and gender- matched controls. DTI tractography identified the fiber tracts passing through these same anatomical sites of the same subjects. Then, DTI nodal degree and laterality index were calculated and compared with the corresponding MEG coherence and laterality index. MEG coherence laterality, after Bonferroni adjustment, showed significant differences for right versus left mTLE in insular cortex and both lateral orbitofrontal and superior temporal gyri (p < 0.017). Likewise, DTI nodal degree laterality, after Bonferroni adjustment, showed significant differences for right versus left mTLE in gyrus rectus, insular cortex, precuneus and superior temporal gyrus (p < 0.017). In insular cortex, MEG coherence laterality correlated with DTI nodal degree laterality (\(R^{2} = 0.46; p = 0.003)\) in the cases of mTLE. None of these anatomical sites showed statistically significant differences in coherence laterality between right and left sides of the controls. Coherence laterality was in agreement with the declared side of epileptogenicity in insular cortex (in 82 % of patients) and both lateral orbitofrontal (88 %) and superior temporal gyri (88 %). Nodal degree laterality was also in agreement with the declared side of epileptogenicity in gyrus rectus (in 88 % of patients), insular cortex (71 %), precuneus (82 %) and superior temporal gyrus (94 %). Combining all significant laterality indices improved the lateralization accuracy to 94 % and 100 % for the coherence and nodal degree laterality indices, respectively. The associated variations in diffusion properties of fiber tracts quantified by DTI and coherence measures quantified by MEG with respect to epileptogenicity possibly reflect the chronic microstructural cerebral changes associated with functional interictal activity. The proposed methodology for using MEG and DTI to investigate diffusion abnormalities related to focal epileptogenicity and propagation may provide a further means of noninvasive lateralization.
Introduction
Over sixty-five million people worldwide and three million people in the United States are diagnosed with epilepsy, 15 to 20 % of which remain medically refractory in spite of antiepileptic medical therapy (Kohrman 2007; England et al. 2012). Mesial temporal lobe epilepsy (mTLE) is the most common form of surgically remediable focal epilepsy, accounting for 60–75 % of patients undergoing surgery for medically refractory epilepsy (Engel 1996). Intracranial electroencephalography (icEEG) optimizes localization of focal epileptogenicity, although it incurs great expense (Kuzniecky et al. 1997; Bulacio et al. 2012), and carries risks of infection, intracranial hemorrhage and elevated intracranial pressure (Arya et al. 2013). This has inspired further work with noninvasive neuroimaging methods to provide better definition of focal epileptogenicity and obviate the need for invasive study in some patients and perhaps altogether (Aghakhani et al. 2014; Zhang et al. 2014).
Magnetoencephalography (MEG) is a noninvasive method of recording the magnetic fields that principally arise from intracellular electric currents flowing in active neurons (Cohen and Hosaka 1976; Hamalainen et al. 1993). MEG is used clinically to localize interictal and, sometimes, ictal activity (Barkley and Baumgartner 2003; Ebersole and Hawes-Ebersole 2007; Knowlton 2008; Sutherling et al. 2008; Englot et al. 2015a, b). Abnormal transients and oscillations can be modeled to identify underlying sources. Synchronization of neuronal activity, a characteristic of epileptogenicity, can be quantified by coherence, a measure of the strength of functional interrelation between pairs of cerebrocortical regions. Use of EEG mean phase coherence has revealed that regions of highly coherent nodes in the cerebral cortex are adjacent to seizure onset zones (Schevon et al. 2007). During the interictal period, local increases in coherence between EEG electrodes have been reported (Towle et al. 1999) as well as increased levels of synchronization in the involved hemisphere (Kraskov 2004). MEG coherence analysis was first used in 2011 to ascertain the laterality of epileptic networks in epilepsy patients where highly coherent activity was found in epileptic neural networks while control subjects lacked similar manifestations (Elisevich et al. 2011).
Diffusion tensor imaging (DTI) is a noninvasive MRI technique which quantifies diffusion properties of water molecules and the degree and direction of anisotropy in biological tissues. Cerebral tissue has highly heterogeneous diffusion properties due to regional differences in nerve fiber density, concentrations of macromolecules and intracellular organelles and myelination density. Tractography can identify virtual pathways of major nerve fiber tracts and quantify abnormalities in these tracts that underlie disruption of the microstructural environment with subsequent reduction of diffusion anisotropy (Rugg-Gunn 2007, Yogarajah and Duncan 2007).
MEG and DTI data have been independently considered for evaluation of epilepsy surgery candidates (Stefan et al. 2007). MEG data has been used in combination with DTI to evaluate subcortical white matter adjacent to cortical tubers (Widjaja et al. 2010). Reduced FA and increased radial diffusion in the subcortical white matter of epileptogenic zones contrasted with adjacent nonepileptogenic zones determined by coregistered MEG data. However, to the best of our knowledge, no study has used MEG data in nonlesional cases to identify white matter fiber tracts intimate with such epileptogenic zones and to evaluate the diffusion properties of these tracts. This paper presents a method by which both MEG and DTI can be used in such a fashion to investigate a putative epileptogenic network. We hypothesize that MEG coherence laterality can be related to the nodal degree laterality extracted by analysis of DTI connectivity, and both indices contribute to noninvasive lateralization of mTLE patients.
Methods and Materials
Subjects
This retrospective study was approved by the Institutional Review Board (IRB) of the Henry Ford Health System. Seventeen consecutive adult patients with refractory TLE (mean age: 33.5 ± 15.4 years; nine females) who had undergone both preoperative MEG evaluation and DTI study with 25 gradient directions, and achieved a post-surgical outcome of Engel class I for at least 1 year follow-up were selected for this study. A retrospective review of each patient’s information was obtained through Henry Ford Health System’s electronic medical record system (CarePlus Henry Ford Health System, Detroit, MI, USA.). Each had undergone inpatient video-electroencephalography, MRI, single photon emission computed tomography (SPECT), neuropsychological evaluation and intracarotid sodium amobarbital injection for evaluation of verbal memory capacity. Those lacking sufficient lateralization by this stage underwent further study by intracranially implanted electrodes for extraoperative electroencephalography. Patients were excluded if their MRI indicated cortical dysplasia, tumor, dilated ventricles or previous resection. Four patients had pathologically-proven hippocampal sclerosis. Table 1 summarizes the patient demographic data. Seventeen age- and gender- matched healthy control subjects without neurologic disorders (mean age: 34.2 ± 15.3 years; nine females) underwent both MEG and DTI study with the same parameters.
MEG Imaging and Analysis
For each epilepsy patient, 10 min of spontaneous resting state MEG data sampled at 508 Hz with band pass filters set from 0.1 to 100 Hz was acquired while the subject was asked to lie still and minimize movement. Post-acquisition data processing was performed using MEG Tools, an open-source Matlab (The Mathworks Inc., Natick, MA, USA) -based software module for cortical source imaging including single current dipole and multiresolution focal underdetermined system solution (MR-FOCUSS) methods (Moran et al. 2004, 2005, 2006) (http://www.megimaging.com). The data were forward and backward filtered using a 3–50 Hz bandpass filter to remove movement and synchronous breathing and heart artifacts, as well as high frequency electronic noise and 60 Hz powerline. In addition, Independent Component Analysis (ICA) was used to remove cardiac artifact from the MEG data and singular value decomposition (SVD) method was used to eliminate high amplitude artifacts associated with head, eye and mouth movement (Duda and Hart 1973; Tufts et al. 1982). All data were visually inspected for epileptic spikes by board-certified neurophysiologists. During their 10-min recording of resting state MEG, no patient showed ictal events. The American Clinical Magnetoencephalography Society (ACMEGS) clinical practice guideline 1 indicates that there must be more than five epileptic spikes seen before the findings are classified as interictal (Bagic et al. 2011). Hence, five patients were declared to have no interictal events (i.e., less than 5 spikes), while 12 patients had occasional epileptic spikes or sharp waves (over 100 for four cases) scattered across the cortex. We did not see any slow waves as they were filtered out by our bandpass filter.
MEG coherence source imaging (MEG-CSI), capable of source space analysis, was calculated using the 10 min of resting state MEG data. Coherence cross-spectra between all active cortical sites was performed separately for each 7.5 s of data of relatively uniform brain behavior (Moran et al. 2004, 2005). For these calculations, 20 fast Fourier transform (FFT) spectra with 2 Hz bin resolution between 3 and 50 Hz, were generated for 0.5 s long data segments that were Hanning windowed and overlapped by 25 %. For each of these data segments, signals from neuronal sources were isolated using an ICA spatiotemporal decomposition technique designed to extract signals from distinct compact sources that exhibit burst behavior and minimal temporal overlap with other active sources. These ICA signal components have MEG spatial magnetic field patterns corresponding to one or a few spatially distinct compact sources which can be imaged accurately in source space using MR-FOCUSS (Moran et al. 2005). Finally, for the entire study, coherence spectra, both real and imaginary components, were average across time and frequency to obtain a final measure of connectivity.
Gray Matter Model
To localize cortical source activation of epileptogenic activity, a model of gray matter was constructed for each individual’s T1-weighted high-resolution volumetric MR image (see “Appendix”). We used a probabilistic brain atlas composed of 56 structures from manually delineated MRI data constructed by Shattuck et al. (2008) as a standard volumetric head model with each location specified in MNI305 coordinates. This atlas contains all cerebral lobes and, specifically, the right and left hippocampi, limbic gyri, insular cortices, caudate, putamen, cerebellum and brainstem. Excluding the cerebellum and brainstem reduced the number of anatomical regions to 27 in each cerebral hemisphere (Table 2; Fig. 1) (Shattuck et al. 2008). The realistic head model consisted of X-, Y- and Z- oriented dipoles at approximately 4000 locations such that every location represented the same amount of gray matter identified in the individual’s MR image. These MR images were coregistered with the individual’s digitized head shape recorded at the time of MEG data collection.

Left Cortical modeling of the brain in the MNI coordinates; the average cortical model and its surface in red. Right The delineated anatomical structures (Shattuck et al. 2008). Regions of this slice are color-coded according to their anatomical identification using MEG Tools. Note that the average cortical model is blurred and its surface is smooth as it is created from a large number of volumetric MRIs of normal individuals (40 cases) (Color figure online)
Calculating MEG Coherence Laterality
The imaging results and the signal cross-spectrum were used to calculate the coherence between all pairings of each of the 54 cortical locations within each of the 24 frequency bins. Finally, for each active source, the average coherence with all other sources was calculated for each frequency and then averaged across the bandwidth of 3 to 50 Hz, ranging from 0 (no coherence) to 1 (highly coherent) (Moran et al. 2006; Elisevich et al. 2011). In these coherence imaging results, the localization of imaged brain activity is strongly dependent on the frequency bands with greatest power. When these coherence results are averaged across the full 10 min of data, only cortical sources that are consistently engaged in synchronous activity contribute to the final results. The MEG-CSI results were coregistered to individual volumetric MRI scans and areas of significant coherence were identified for each subject (“Diffusion Tensor Imaging and Analysis” section).
The coherence laterality Coh_Lat was computed to determine which hemisphere exhibited higher coherence over the entire time interval of spontaneous acquisition. It was calculated for each cortical site as:
where \(Coh\left( i \right)\) and Coh(i + 27) represent the coherence for the site i in the left and right hemispheres, respectively. A positive value indicates that a greater fraction of the right hemisphere was engaged in coherent activity of a cortical site compared to the left hemisphere on average for the patient across the 10 min of MEG data.
Diffusion Tensor Imaging and Analysis
All subjects underwent preoperative imaging in a 3.0T MRI system (GE Medical Systems, Milwaukee, USA.) using a standardized protocol for image acquisition. Coronal T1-weighted images were acquired using the spoiled gradient echo (SPGR) protocol with TR/TI/TE = 10400/4500/300 ms, flip angle = 15°, near cubic voxel size = 0.9375 × 0.9375 × 1.00 mm3, \({\text{imaging matrix }}256 \times 256 ,\) field-of-view (FOV) of 240 × 240 mm2 that includes the entire skin surface of the head for construction of head and cortical model for MEG analysis. DTI images (b-value of 1000 \(\frac{\text{s}}{{{\text{mm}}^{2} }}\)) along with a set of null images (b-value of 0 \(\frac{\text{s}}{{{\text{mm}}^{2} }}\)) were acquired using echo planar imaging (EPI) (Stieltjes et al. 2001; Mori and van Zijl 2002) with TR/TI/TE = 7500/0/76 ms, flip angle = 90°, voxel size = 1.96 × 1.96 × 2.6 mm3, \({\text{imaging matrix }}128 \times 128\), FOV of 240 × 240 mm2 and 25 diffusion gradient directions.
DTI Preprocessing
Before tractography and connectivity analysis, the DTI data were prepared by interpolation to a cubic voxel size of 1.96 mm and tensor, FA and MD calculation (Pierpaoli et al. 2001, Nazem-Zadeh et al. 2012). For the purpose of tractography, the principal diffusion direction (PDD), the eigenvector corresponding to the largest eigenvalue of the tensor, was also calculated from the tensor. Using an affine transformation (FSL, FLIRT), T1-weighted images and subsequently the gray matter anatomical regions extracted by MEG Tools were coregistered to the DTI data to establish the input ROI for tractography (Jenkinson et al. 2002).
DTI Tractography and Connectivity
Tractography offers a method of identifying diffusion parameters associated with white matter tracts that may facilitate the propagation of epileptic activity. The tractography was performed automatically using FACT Streamline (Mori and van Zijl 2002) implemented in a home-made tractography application between all 54 anatomical regions. Streamline fiber tracking parameters comprised an FA threshold = 0.10, minimum fiber length = 0.10 mm, and maximum allowed angle bending between two fiber segments = 45°. The FA threshold eliminated the inclusion of gray matter to allow comparison of diffusion properties of only the resultant white matter tracts. The minimum fiber length threshold eliminated the irrelevant minor fibers that are essentially constructed from DTI noise. The maximum allowed angle threshold guaranteed a smooth fiber trajectory expected in practice. With the reconstructed fibers, a connectivity matrix was constructed for each subject by calculating the mean FA value of the voxels of all fibers connecting each pair of regions:
where k represents the kth fiber connecting the brain sites i, j.
Nodal Degree Laterality
The nodal degree (ND) of a brain site i is defined as (DeSalvo et al. 2014):
where C and S denote the cohorts of controls and all subjects, respectively. The nodal degree laterality ND_Lat was computed to determine which hemisphere exhibited the higher nodal degree:
where \(ND\left( i \right)\) and ND(i + 27) represent the nodal degree for the site i in the left and right hemispheres, respectively.
Statistical Analysis
Two-way repeated measures analysis of variance (RMANOVA) was used to examine the relationships of the MEG coherence laterality measurements and the DTI nodal degree laterality measurements with the brain regions (i.e., a repeated factor) and the mTLE laterality type (i.e., a fixed factor) (Nazem-Zadeh et al. 2015). Of particular interest were tests for interaction between a region and a laterality type, since a significant interaction would imply that separate one-way ANOVAs are required to assess mTLE laterality type.
For each region, one-way ANOVA on the mTLE laterality type was performed and multiple comparisons were addressed by Bonferroni adjustments for three pairwise comparisons between laterality types (p < 0.05/3 = 0.0167). However, the one-way ANOVAs were considered statistically significant only if the overall ANOVA F-test for all mTLE laterality types was also significant after a multiple comparisons adjustment (p < 0.05/27 = 0.0019).
One-way RMANOVA was performed for 27 anatomical regions followed by paired t-tests between the corresponding ipsilateral and contralateral subregions. It was considered statistically significant only if the overall RMANOVA F-test was also significant for the corresponding sites after Bonferroni adjustments for 27 pairwise comparisons between ipsilateral and contralateral sides (p < 0.05/27 = 0.0019).
Individual Analysis of Laterality
Although the anatomical sites with the highest laterality may be ranked, as in the case of coherence, using MEG Tools (Moran et al. 2005), the threshold for establishing the number of sites with the highest laterality may vary from one subject to another. Alternatively, the observed laterality variation for MEG coherence and DTI nodal degree in anatomical sites in individual patients may be compared to the laterality variation uncertainty (LVU) level estimated from controls. If it falls beyond a certain level, the site can be considered a high coherence site. The LVU is estimated by laterality analysis of a control cohort who have undergone imaging with the same scanner, under the same imaging conditions. Any laterality variation in control cohort should be attributable to natural physiological occurrences, thus, no significant laterality is expected to be observed in control subjects (Nazem-Zadeh et al. 2014c).
Lateralization Response-Driven Models
For both coherence and nodal degree, statistically significant laterality measures between the left and right mTLE cohorts were considered as multivariate independent variables and incorporated into the development of response-driven models of laterality using logistic function regression (Hosmer et al. 2013; Nazem-Zadeh et al. 2014a, b).
Correlation Between MEG Coherence and DTI Nodal Degree Laterality
Among the anatomical sites where significant differences in laterality of both coherence and nodal degree between the right and left mTLE patients were seen, the correlation between the laterality measures were evaluated using the coefficient of determination denoted by R 2 extracted by linear regression. A statistically significant high value of R 2 implies a high level of correlation between the MEG and DTI laterality measures.
Results
The ages of the male and female subjects across any of the right and left mTLE and control cohorts were statistically comparable. Table 1 shows the significant anatomical sites with the laterality variation of MEG coherence and DTI nodal degree beyond the LVU level for individual patients.
MEG Coherence Laterality and mTLE Lateralization
MEG-CSI identified epileptic network sites for each of the 17 mTLE patients (Fig. 2).

MEG -CSI map for patient #16 in Table 1 with right TLE. High coherence was detected in the right mesial temporal region (Color figure online)
Two-way RMANOVA demonstrated significant interaction between regional and mTLE laterality type with coherence laterality measures (p < 0.001). Statistical analysis in mTLE patients using RMANOVA followed by t-tests between pairs of ipsilateral side (i.e., the resected side) versus contralateral side showed significant interhemispheric variation in MEG mean coherence (p < 0.0019), particularly the insular cortex (ipsi: contra, 0.027 ± 0.004:0.012 ± 0.001), the superior temporal (ipsi:contra, 0.111 ± 0.009: 0.064 ± 0.006), lateral orbitofrontal (ipsi:contra, 0.102 ± 0.011: 0.054 ± 0.008) and middle temporal (ipsi:contra, 0.120 ± 0.012: 0.084 ± 0.009) gyri and putamen (ipsi:contra, 0.077 ± 0.003:0.007 ± 0.001) (p < 0.05; Fig. 3). For controls, no single anatomical site showed a significant difference in coherence between the right and left sides, although the overall RMANOVA F-test was significant across all sites (p < 0.0019). This finding is in concordance with the evidence that control subjects did not exhibit areas of high coherence during spontaneous MEG study (Elisevich et al., 2011).

MEG coherence at anatomical sites with significant differences between the ipsilateral and contralateral structures of the mTLE patients and the average coherence on the left and right sides of the controls. The error bars represent the standard error of the mean coherence
For the insular cortex and the lateral orbitofrontal and superior temporal gyri, the overall ANOVA F-test in all mTLE laterality types was significant after Bonferroni adjustments (p < 0.0019). In t-tests between pairs of laterality types, the coherence laterality showed significant differences in insular cortex for the right versus left mTLE cases, right mTLE versus control cases and left mTLE versus control cases (p < 0.0167; Fig. 4). However, for the lateral orbitofrontal and superior temporal gyri, significant differences were found in coherence laterality only for the right versus left mTLE cases and the right mTLE versus control cases (p < 0.0167). Figure 5 shows the MEG mean coherence in the insular cortex and the lateral orbitofrontal and superior temporal gyri overlaid upon the MNI registered brain (Xia et al. 2013) for the right and left mTLE patient cohorts. Figure 6 shows the MEG coherence laterality in these regions for individual patients.

MEG coherence laterality in the brain sites with significant differences between the right and left mTLE patients. The error bars represent the standard error of the mean coherence laterality

The MEG mean coherence in insular cortex and the lateral orbitofrontal and superior temporal gyri overlaid upon the MNI registered brain (Xia et al. 2013) in the right and left mTLE patients where significant differences in coherence laterality between the right and left mTLE patients are demonstrated. The spheres and lines show the significant cortical sites and their corresponding connections, respectively. The right and left cortical sites are shown in yellow and red, respectively. The mean coherence values are represented by the size of the spheres (Color figure online)

MEG coherence laterality in individual patients for insular cortex (a) and the lateral orbitofrontal (b) and superior temporal (c) gyri where significant differences exist between the right and left mTLE patients. Patient numbers correspond to the numerical allocation in Table 1
Figure 7 shows the laterality models by logistic regression of the MEG coherence laterality data in these anatomical sites with significant differences identified between the left and right mTLE patients. The laterality results of these models agreed with the side of epileptogenicity for the coherence laterality in the insular cortex and the lateral orbitofrontal and superior temporal gyri for 82, 88 and 88 % of patients, respectively. Combining the laterality measures in these three anatomical sites improved lateralization results to 94 % of the patients (Fig. 7d).

The laterality model of the right mTLE (i.e., probability of being right mTLE) by logistic regression of the MEG coherence laterality data in the insular cortex (a) and the lateral orbitofrontal (b) and the superior temporal (c) gyri, and the integrated model (d). The result of laterality achieved by these models agreed with the side of epileptogenicity for 82, 88, 88 and 94 % of patients, respectively
DTI Nodal Degree Laterality and mTLE Lateralization
Two-way RMANOVA demonstrated significant interaction in DTI nodal degree laterality between both regional and mTLE laterality types (p < 0.001). In mTLE patients, statistical analysis using RMANOVA followed by t-tests between case pairs of ipsilateral side (i.e., resected side) versus contralateral side showed no significant interhemispheric variation in the DTI nodal degree. The same finding was evident in the side-to-side comparison in the control cases. However, the nodal degree laterality showed significant differences in the gyrus rectus, insular cortex, precuneus and the superior temporal gyrus in both overall ANOVA F-test for mTLE laterality types and t-tests between pairs of right and left mTLE, after Bonferroni adjustments (p < 0.0019 and p < 0.0167, resp; Fig. 8). Figure 9 shows the mean nodal degree in these same anatomical sites in both right and left mTLE patient cohorts and Fig. 10 shows the nodal degree laterality in these sites for each patient.

DTI nodal degree laterality at anatomical sites with significant differences between right and left mTLE patients. The error bars represent the standard error of the mean nodal degree laterality

The DTI nodal degree in gyrus rectus, insular cortex, precuneus and superior temporal gyrus overlaid upon the MNI registered brain (Xia et al. 2013), in the right and left mTLE patients, where significant differences in the nodal degree laterality were identified between the right and left mTLE patients. The spheres and lines show the significant cortical sites and their corresponding connections, respectively. The right and left cortical sites are shown in yellow and red, respectively. The nodal degree values are represented by the size of the spheres (Color figure online)

DTI nodal degree laterality in gyrus rectus (a), insular cortex (b), precuneus (c) and superior temporal gyrus (d), where significant differences were identified between the right and left mTLE patients. Patient numbers correspond to the numerical allocation in Table 1
Figure 11 shows the averaged density map of tracts originating from the gyrus rectus, insular cortex, precuneus and superior temporal gyrus, for the cohorts of left and right mTLE patients. As can be seen, fewer tracts were reconstructed originating from the ipsilateral insular cortex (posteriorly) and superior temporal gyrus, compared to the side contralateral to the epileptogenicity. A substantial interhemispheric variation of the density map was also observed for the gyrus rectus only in the left mTLE cohort.


Averaged density map of tracts overlaid upon the MNI registered brain (Xia et al. 2013), between the gyrus rectus (a), insular cortex (b), precuneus (c) and the superior temporal gyrus (d) as the input ROI and all other anatomical ROIs. The density maps are averaged on the left mTLE patients (left images) as well as right mTLE patients (right images). Note that in (b), the tracts originating from the insular cortex are deep intracranial tracts and cannot be rendered on the surface of the MNI registered brain (Color figure online)
Laterality models determined by logistic regression on the DTI nodal degree laterality data agreed with the side of epileptogenicity as it pertained to the gyrus rectus, insular cortex, precuneus and superior temporal gyrus for 88, 71, 82 and 94 % of patients, respectively (Fig. 12). Combining the laterality measures in these four anatomical sites improved the results further with correct lateralization of 100 % for all patients (Fig. 12e).

The laterality model (i.e., probability of right mTLE) by logistic regression on the DTI nodal degree laterality data in the gyrus rectus (a), insular cortex (b), precuneus (c) and superior temporal gyrus (d) and the integrated model (e)
Correlation Between MEG Coherence and DTI Nodal Degree Laterality
A high correlation was observed between the MEG coherence and the DTI nodal degree laterality in the insular cortex, where significant differences were observed between the right and left mTLE patients with R 2 = 0.46 (p = 0.003; Fig. 13).

A high level of correlation between MEG coherence and DTI nodal degree laterality measures in the insular cortex with R2 = 0.46 (p = 0.003)
Discussion
This study described a method of combining MEG and DTI to investigate white matter fibers associated with epileptiform activity in the mTLE patients. The MEG coherence laterality in the insular cortex was correlated with the DTI nodal degree laterality obtained from analysis of DTI connectivity. Both insular cortex and superior temporal gyrus showed significant differences in both MEG coherence and DTI nodal degree laterality measures for the right and left mTLE. These same regions in both modalities could be used to model laterality. The MEG coherence laterality applied to the lateral orbitofrontal area and the DTI nodal degree laterality to both the gyrus rectus and precuneus also showed significant differences between the right and left mTLE patients with subsequent successful laterality modeling. These findings imply that there are both common and distinctive hubs for functional activity and diffusivity detectable by the MEG coherence and the DTI connectivity measures. It also shows that the hemisphere containing the epileptic focus in the mTLE patients may be determined using a dual MEG-DTI laterality model involving these brain areas.
The MEG coherence laterality measure of an anatomical region was calculated by averaging the MEG activities between that and all other anatomical regions. Similarly, the nodal degree laterality measure was calculated by averaging the fractional anisotropy of all tracts originating from that and connecting all other regions. An anatomical node such as hippocampus may have some laterality-sensitive connections when considered individually, as well as some laterality-insensitive connections. Therefore, it is not surprising that the hippocampus stays insensitive to the laterality by lumping all the propertied of its functional or structural connections. Nevertheless, the other anatomical regions were found sensitive enough for the purpose of lateralization with sufficient reliability when the functional and structural properties are averaged between the connections. Laterality, in the end, is determined more by the local regional network activity rather than a single anatomical site.
In mTLE, epileptic network behavior is associated with alteration of both of the gray and white matter (Bernasconi et al. 2004). Loss of anisotropy has been demonstrated in the arcuate fasciculus (Powell et al. 2007; Govindan et al. 2008), uncinate fasciculus (Rodrigo et al. 2007), external capsule (Gross et al. 2006), inferior longitudinal fasciculus (Govindan et al. 2008), corpus callosum (Chahboune et al. 2009, Nazem-Zadeh et al. 2015), the afferent and efferent tracts of the parahippocampal gyrus (Yogarajah et al. 2008), fornix and cingulum (Concha et al. 2005, 2009; Nazem-Zadeh et al. 2014c, 2015), thalamic fibers (Bonilha et al. 2012) and widely spread tracts in the temporal lobe ipsilateral to epileptic focus (Concha et al. 2005, Focke et al. 2008). The apparent diffusion coefficient (ADC) is calculated from the trace of the diagonalized diffusion tensor to give the mean bulk mobility of water without directional information. Increases of ADC in epileptogenic zones have been identified in mTLE suggesting an increased extracellular space possibly attributable to changes in cellular volume or geometry congruent with interictal spiking (Thivard et al. 2006). Taken together, these studies suggest that abnormal water diffusion, identified as changes in FA or ADC, may be found in identified white matter tracts of epileptic networks in both temporal and extratemporal structures.
Investigation of structural connectivity in mTLE using DTI and functional activity from fMRI (Sporns 2011) has shown similar promise in lateralizing epileptogenicity (Lemkaddem et al. 2014). In this context, the brain is modeled as a network(s) of connected nodes. The nodes are selected based upon structural and functional parcellation of the brain. The connectivity matrix is then established either from DTI or fMRI connectivity analysis. The entire connectivity matrix or specific connections may be compared between groups of individuals. Major differences may be found between groups, although at the expense of higher sampling volume and more complex statistical analysis (Zalesky et al. 2010). An alteration in structural connectivity of the temporal pole and the inferolateral and perisylvian cortices has been identified in unilateral mTLE (Besson et al., 2014). A decrease in structural connectivity with DTI, both within-module and between-module, throughout the default mode network (DMN) has also been observed in mTLE compared to nonepileptic subjects (Vaessen et al. 2011; Chiang and Haneef 2014; DeSalvo et al. 2014). This appears to underlie a loss of functional connectivity determined by fMRI (Skudlarski et al. 2008; Pittau et al. 2012). A widespread increase in global network efficiency is seen within the DMN in mTLE (Vaessen et al. 2011; Chiang and Haneef 2014; DeSalvo et al. 2014), implying a facilitation of propagation of epileptogenicity throughout the region. Some reorganization of the limbic system in mTLE has also been identified (Bonilha et al. 2012). Functional MRI connectivity analysis has shown increased DMN connectivity with other brain regions in left TLE (Centeno and Carmichael 2014), but decreased connectivity in right TLE (Haneef et al. 2014a). Several investigations using seed-based analysis of specific cerebral connections in TLE have focused upon the thalamus (Barron et al. 2014; Keller et al. 2014; Barron et al. 2015; He et al. 2015) and hippocampus (Haneef et al. 2014b; Dinkelacker et al. 2015). While most studies address either DTI or fMRI connectivity, a few have investigated both connectivity measures (Dinkelacker et al. 2015). Moreover, some have used connectivity analysis for lateralization of epileptogenicity (Morgan et al. 2012, Barron et al. 2015). A comprehensive review of fMRI connectivity studies in epilepsy can be found elsewhere (Centeno and Carmichael 2014).
EEG coherence in sensor space (i.e., at the electrode site) has been widely used in studying epileptiform activity to determine ictal onset zones. Brazier (1972) was the first to use coherence to detect the influence of one brain region over another during an ictus (Brazier 1972). Later Gotman (1981) made the method more reliable by including more frequencies and validating the use of this method to detect inter hemispheric interactions (Gotman 1981). A recent study (Song et al. 2013) has shown that EEG coherence can be used to characterize a pattern centered upon temporal lobe structures. A problem with this traditional way of mapping coherence in sensor space concerns the spread of the electric current over the surface of the head. Electromagnetic field spread creates a problem when trying to interpret coherence at the sensor level. Since recordings from all EEG electrodes or MEG coils measure the sum of the activity from several brain regions, it is difficult to resolve coherence to a specific location (Schoffelen and Gross 2009). In the past 10 years, developments in the computational analysis of source localization for MEG have advanced the ability for connectivity to be imaged directly within specific regions (i.e., source space), providing a better anatomical localization as well as greater ease for co- registering to the DTI data. The high temporal resolution of MEG allows for investigations of function and effective connectivity with millisecond precision. It is possible now to study the mechanisms by which information is exchanged across brain regions, including oscillatory and synchronized neuronal activity. Only a handful of MEG coherence studies using different inverse methods (dipoles, minimum norm or beamformers) to localize source space coherence have been performed in the past decade. Elisevich et al. (2011) showed that MEG-CSI can provide targets for successful surgical resection in patients with epilepsy with a detection rate of 77 % of the patients who had high coherence in the area of the later resection (Elisevich et al. 2011). MEG-CSI uses a current distribution technique, MR-FOCUSS, to image underlying sources based on a 10 min resting state scan. More recently, Englot et al. (2015a, b) used a beamforming technique to image underlying sources and studied regional and global functional connectivity of MEG coherence in patients with epilepsy, based on a 1-min resting state scan (Englot 2015a, b). An Engel class I outcome was seen in 87.5 % of patients where increased connectivity was found in the region of the later resection. The current paper has shown how coupling MEG coherence to DTI nodal imaging can increase this predictability.
Ictal activity in epilepsy patients who are sent for a MEG scan can influence coherence between brain structures across the entire frequency band with significant individual variation in the degree of disturbance of the normal brain network activity. However, in our application, averaging the coherence over the full pass band over the entire 10 min decreases the variance of the measured coherence across patients and the underlying focal network ongoing in the background of the spike activity can be detected.
Moreover, we have seen that ictal activity often has a peak coherence in the 20–40 Hz range. Therefore splitting up this range into smaller bands (beta: 15–30 Hz and gamma: 30–50 Hz) may divide the region of interest inadvertently. There might still be some activity in the network of interest outside but near this frequency range (20–40 Hz) that should be preserved.
Coherence was used to quantify the contribution of individual brain structures to network interactions. MEG-CSI utilizes coherence from both the real and imaginary sides, with the magnitude of a site’s functional connectivity within the brain network calculated as an average of the (full) coherence of the site with all the other active cortical sources. This avoids the need to account for the effect of image blur on the individual site-to-site coherence calculations between active brain sites, and provides a better measure of direct and indirect connectivity, with better statistical performance than imaginary coherence alone. This method has been validated with EEG coherence in a small cohort of patients that had a MEG then were implanted with icEEG (Moran et al. 2006).
Comparison of MEG results across subjects becomes possible when images of individual subjects are coregistered with a common brain coordinate system such as with Talairach or MNI coordinates. Likewise, multimodal comparisons of MEG with other imaging studies becomes possible when coordinates of individual imaging data are coregistered with a common brain coordinate system. Establishing correspondence of subject MRI voxel locations to MNI locations requires the mapping of the subject’s brain image to the corresponding MNI brain structure using AC-PC coordinates. A variety of linear and nonlinear transform techniques have been developed to accomplish this task. These techniques attempt to match either the volume or surface structure with the corresponding structure in the MNI brain atlas. The three popular registration techniques used are AIR (Woods et al. 1998), FLIRT (Smith et al. 2004) and SPM (Ashburner and Friston 2005). The MRI/MNI coregistration techniques are not part of a unified MEG/MRI imaging application and, therefore, are not readily applicable for MEG. Moreover, MEG involves the allocation of cortical activity, often in diseased or surgically altered brain, onto a standard MRI introducing potential error in localization. The nonlinear MRI-to-MNI transforms developed here are part of a complete MRI import and processing utility, available in the MEG imaging software, MEG TOOLS, (www.megimaging.com ), designed to accommodate a wide range of MRI distortions, brain malformations and surgical resections. This transform included both MEG to MRI and MRI to MNI coregistration as well as cortical volume extraction by a partially automated algorithm. MRI to MNI coregistration utilizes a combination of linear and second-order polynomial transforms to produce volumetric warping of brain structure such that the patient brain surface matches the brain surface template of the MNI305 average brain. The anatomical identity of all cortical locations is determined by consulting an anatomical atlas corresponding to the MNI-305 brain.
Conclusions
An epileptic network is comprised of multiple neuronal sites behaving synchronously connected by white matter tracts that propagate this activity. In this paper we investigated the relationship between cerebral functional abnormalities quantified by MEG coherence and structural abnormalities quantified by DTI in mesial temporal lobe epilepsy (mTLE). Two recent studies have shown that MEG-CSI provides clinicians with valuable information regarding surgical candidacy. We have combined a MEG-CSI method with the DTI nodal degree (i.e., number of links connected to a node) to further analyze the detection of the side of epileptogenicity. With increasingly sophisticated signal processing methods and the use of multimodal neuroimaging and neurophysiological biomarkers, noninvasive investigational techniques may ultimately supplant invasive monitoring as a means of localizing focal epileptogenicity and establishing surgical candidacy.
References
Aghakhani Y, Liu X, Jette N, Wiebe S (2014) Epilepsy surgery in patients with bilateral temporal lobe seizures: a systematic review. Epilepsia 55:1892–1901
Arya R, Mangano FT, Horn PS, Holland KD, Rose DF, Glauser TA (2013) Adverse events related to extraoperative invasive EEG monitoring with subdural grid electrodes: a systematic review and meta-analysis. Epilepsia 54:828–839
Ashburner J, Friston KJ (2005) Unified segmentation. Neuroimage 26:839–851
Bagic AI, Knowlton RC, Rose DF, Ebersole JS, Committee ACPG (2011) American clinical magnetoencephalography society clinical practice guideline 1: recording and analysis of spontaneous cerebral activity*. J Clin Neurophysiol 28:348–354
Barkley GL, Baumgartner C (2003) MEG and EEG in epilepsy. J Clin Neurophysiol 20:163–178
Barron DS, Tandon N, Lancaster JL, Fox PT (2014) Thalamic structural connectivity in medial temporal lobe epilepsy. Epilepsia 55:e50–e55
Barron DS, Fox PT, Pardoe H, Lancaster J, Price LR, Blackmon K, Berry K, Cavazos JE, Kuzniecky R, Devinsky O, Thesen T (2015) Thalamic functional connectivity predicts seizure laterality in individual TLE patients: application of a biomarker development strategy. Neuroimage Clin 7:273–280
Bernasconi N, Duchesne S, Janke A, Lerch J, Collins DL, Bernasconi A (2004) Whole-brain voxel-based statistical analysis of gray matter and white matter in temporal lobe epilepsy. NeuroImage 23:717–723
Besson P, Dinkelacker V, Valabregue R, Thivard L, Leclerc X, Baulac M, Sammler D, Colliot O, Lehericy S, Samson S, Dupont S (2014) Structural connectivity differences in left and right temporal lobe epilepsy. Neuroimage 100:135–144
Bonilha L, Nesland T, Martz GU, Joseph JE, Spampinato MV, Edwards JC, Tabesh A (2012) Medial temporal lobe epilepsy is associated with neuronal fibre loss and paradoxical increase in structural connectivity of limbic structures. J Neurol Neurosurg Psychiatry 83:903–909
Brazier MA (1972) Spread of seizure discharges in epilepsy: anatomical and electrophysiological considerations. Exp Neurol 36:263–272
Bulacio JC, Jehi L, Wong C, Gonzalez-Martinez J, Kotagal P, Nair D, Najm I, Bingaman W (2012) Long-term seizure outcome after resective surgery in patients evaluated with intracranial electrodes. Epilepsia 53:1722–1730
Centeno M, Carmichael DW (2014) Network connectivity in epilepsy: resting state fMRI and EEG-fMRI contributions. Front Neurol 5:93
Chahboune H, Mishra AM, DeSalvo MN, Staib LH, Purcaro M, Scheinost D, Papademetris X, Fyson S, Lorincz M, Crunelli V (2009) DTI abnormalities in anterior corpus callosum of rats with spike–wave epilepsy. Neuroimage 47:459–466
Chiang S, Haneef Z (2014) Graph theory findings in the pathophysiology of temporal lobe epilepsy. Clin Neurophysiol 125:1295–1305
Cohen DJ, Hosaka JJ (1976) Magnetic field produced by a current dipole. J Electrocardiol 9:409–417
Concha L, Beaulieu C, Gross DW (2005) Bilateral limbic diffusion abnormalities in unilateral temporal lobe epilepsy. Ann Neurol 57:188–196
Concha L, Beaulieu C, Collins DL, Gross DW (2009) White-matter diffusion abnormalities in temporal-lobe epilepsy with and without mesial temporal sclerosis. J Neurol Neurosurg Psychiatry 80:312–319
DeSalvo MN, Douw L, Tanaka N, Reinsberger C, Stufflebeam SM (2014) Altered structural connectome in temporal lobe epilepsy. Radiology 270:842–848
Dinkelacker V, Valabregue R, Thivard L, Lehericy S, Baulac M, Samson S, Dupont S (2015) Hippocampal-thalamic wiring in medial temporal lobe epilepsy: enhanced connectivity per hippocampal voxel. Epilepsia 56:1217–1226
Duda R, Hart P (1973) Linear Discriminant Functions. In: Classification P, Analysis S (eds) pp. Wiley-Interscience, New York, pp 130–185
Ebersole JS, Hawes-Ebersole SH (2007) Clinical application of dipole models in the localization of epileptiform activity. J Clin Neurophysiol 24:120–129
Elisevich K, Shukla N, Moran JE, Smith B, Schultz L, Mason K, Barkley GL, Tepley N, Gumenyuk V, Bowyer SM (2011) An assessment of MEG coherence imaging in the study of temporal lobe epilepsy. Epilepsia 52:1110–1119
Engel J Jr (1996) Surgery for seizures. N Engl J Med 334:647–653
England MJ, Liverman CT, Schultz AM, Strawbridge LM (2012) Epilepsy across the spectrum 25:266–276
Englot DJ, Hinkley LB, Kort NS, Imber BS, Mizuiri D, Honma SM, Findlay AM, Garrett C, Cheung PL, Mantle M, Tarapore PE, Knowlton RC, Chang EF, Kirsch HE, Nagarajan SS (2015a) Global and regional functional connectivity maps of neural oscillations in focal epilepsy. Brain Res 138:2249–2262
Englot DJ, Nagarajan SS, Imber BS, Raygor KP, Honma SM, Mizuiri D, Mantle M, Knowlton RC, Kirsch HE, Chang EF (2015b) Epileptogenic zone localization using magnetoencephalography predicts seizure freedom in epilepsy surgery. Epilepsia 56:949–958
Focke NK, Yogarajah M, Bonelli SB, Bartlett PA, Symms MR, Duncan JS (2008) Voxel-based diffusion tensor imaging in patients with mesial temporal lobe epilepsy and hippocampal sclerosis. Neuroimage 40:728–737
Gotman J (1981) Interhemispheric relations during bilateral spike-and-wave activity. Epilepsia 22:453–466
Govindan RM, Makki MI, Sundaram SK, Juhász C, Chugani HT (2008) Diffusion tensor analysis of temporal and extra-temporal lobe tracts in temporal lobe epilepsy. Epilepsy Res 80:30–41
Gross DW, Concha L, Beaulieu C (2006) Extratemporal white matter abnormalities in mesial temporal lobe epilepsy demonstrated with diffusion tensor imaging. Epilepsia 47:1360–1363
Hamalainen M, Hari R, Ilmoniemi J, Knuutila J, Lounamaa O (1993) Magnetoencephalography-theory, instrumentation and applications to noninvasive studies of the working human brain. Rev Mod Phys 65:413–497
Haneef Z, Lenartowicz A, Yeh HJ, Engel J Jr, Stern JM (2014a) Network analysis of the default mode network using functional connectivity MRI in Temporal Lobe Epilepsy. J Vis Exp. doi:10.3791/51442
Haneef Z, Lenartowicz A, Yeh HJ, Levin HS, Engel J Jr, Stern JM (2014b) Functional connectivity of hippocampal networks in temporal lobe epilepsy. Epilepsia 55:137–145
He X, Doucet GE, Sperling M, Sharan A, Tracy JI (2015) Reduced thalamocortical functional connectivity in temporal lobe epilepsy. Epilepsia 56:1571–1579
Hosmer DW Jr, Lemeshow S, Sturdivant RX (2013) Applied logistic regression. Wiley, New York
Jenkinson M, Bannister P, Brady M, Smith S (2002) Improved optimization for the robust and accurate linear registration and motion correction of brain images. Neuroimage 17:825–841
Keller SS, O’Muircheartaigh J, Traynor C, Towgood K, Barker GJ, Richardson MP (2014) Thalamotemporal impairment in temporal lobe epilepsy: a combined MRI analysis of structure, integrity, and connectivity. Epilepsia 55:306–315
Knowlton RC (2008) Can magnetoencephalography aid epilepsy surgery? Epilepsy Curr 8:1–5
Kohrman MH (2007) What is Epilepsy? Clinical perspectives in the diagnosis and treatment. J Clin Neurophysiol 24:87–95
Kraskov A (2004) Applications of synchronization and interdependence measures in particular to EEG of epilepsy patients. In: John Von Neumann Institute for Computing, NIC, vol. PhD thesis
Kuzniecky R, Bilir E, Gilliam F, Faught E, Palmer C, Morawetz R, Jackson G (1997) Multimodality MRI in mesial temporal sclerosis: relative sensitivity and specificity. Neurology 49:774–778
Lemkaddem A, Daducci A, Kunz N, Lazeyras F, Seeck M, Thiran JP, Vulliémoz S (2014) Connectivity and tissue microstructural alterations in right and left temporal lobe epilepsy revealed by diffusion spectrum imaging. Neuroimage 5:349–358
Moran JE, Drake CL, Tepley N (2004) ICA methods for MEG imaging. Neurol Clin Neurophysiol 2004:72
Moran J, Bowyer S, Tepley N (2005) Multi-resolution FOCUSS: a source imaging technique applied to MEG data. Brain Topogr 18:1–17
Moran J, Manoharan A, Bowyer SM, Mason KM, Tepley N, Morrell M, Greene D, Smith BJ, Barkley GL (2006) MEG coherence imaging compared to electrocortical recordings from neuropace implants to determine the location of ictal onset in epilepsy patients. In: Cheyne D, Stroink BRG, Weinberg H (eds), 15th international conference on biomagnetism, vol 1300. Elsiver, Vancouver, pp 673–676
Morgan VL, Sonmezturk HH, Gore JC, Abou-Khalil B (2012) Lateralization of temporal lobe epilepsy using resting functional magnetic resonance imaging connectivity of hippocampal networks. Epilepsia 53:1628–1635
Mori S, van Zijl PC (2002) Fiber tracking: principles and strategies: a technical review. NMR Biomed 15:468–480
Nazem-Zadeh MR, Chapman CH, Lawrence TL, Tsien CI, Cao Y (2012) Radiation therapy effects on white matter fiber tracts of the limbic circuit. Med Phys 39:5603–5613
Nazem-Zadeh M-R, Elisevich KV, Schwalb JM, Bagher-Ebadian H, Mahmoudi F, Soltanian-Zadeh H (2014a) Lateralization of temporal lobe epilepsy by multimodal multinomial hippocampal response-driven models. J Neurol Sci 347:107–118
Nazem-Zadeh M-R, Schwalb JM, Elisevich KV, Bagher-Ebadian H, Hamidian H, Akhondi-Asl A-R, Jafari-Khouzani K, Soltanian-Zadeh H (2014b) Lateralization of temporal lobe epilepsy using a novel uncertainty analysis of MR diffusion in hippocampus, cingulum, and fornix, and hippocampal volume and FLAIR intensity. J Neurol Sci 342:152–161
Nazem-Zadeh M-R, Schwalb JM, Bagher-Ebadian H, Jafari-Khouzani K, Elisevich KV, Soltanian-Zadeh H (2014b) A Bayesian averaged response-driven multinomial model for lateralization of temporal lobe epilepsy. In: 2014 IEEE 11th international symposium on Biomedical Imaging (ISBI), pp 197–200
Nazem-Zadeh M-R, Elisevich K, Air EL, Schwalb JM, Divine G, Kaur M, Wasade VS, Mahmoudi F, Shokri S, Bagher-Ebadian H, Soltanian-Zadeh H (2015) DTI-based response-driven modeling of mTLE laterality. Neuroimage Clin
Pierpaoli C, Barnett A, Pajevic S, Chen R, Penix LR, Virta A, Basser P (2001) Water diffusion changes in Wallerian degeneration and their dependence on white matter architecture. Neuroimage 13:1174–1185
Pittau F, Grova C, Moeller F, Dubeau F, Gotman J (2012) Patterns of altered functional connectivity in mesial temporal lobe epilepsy. Epilepsia 53:1013–1023
Powell H, Parker GJ, Alexander DC, Symms MR, Boulby PA, Wheeler-Kingshott CA, Barker GJ, Koepp MJ, Duncan JS (2007) Abnormalities of language networks in temporal lobe epilepsy. Neuroimage 36:209–221
Rodrigo S, Oppenheim C, Chassoux F, Golestani N, Cointepas Y, Poupon C, Semah F, Mangin JF, Le Bihan D, Meder JF (2007) Uncinate fasciculus fiber tracking in mesial temporal lobe epilepsy Initial findings. Eur Radiol 17:1663–1668
Rugg-Gunn FJ (2007) Diffusion imaging in epilepsy. Expert Rev Neurother 7:1043–1054
Schevon CA, Cappell J, Emerson R, Isler J, Grieve P, Goodman R, McKhann JG, Weiner H, Doyle W, Kuzniecky R, Devinsky O, Gilliam F (2007) Cortical abnormalities in epilepsy revealed by local EEG synchrony. Neuroimage 35:140–148
Schoffelen JM, Gross J (2009) Source connectivity analysis with MEG and EEG. Hum Brain Mapp 30:1857–1865
Shattuck DW, Mirza M, Adisetiyo V, Hojatkashani C, Salamon G, Narr KL, Poldrack RA, Bilder RM, Toga AW (2008) Construction of a 3D probabilistic atlas of human cortical structures. Neuroimage 39:1064–1080
Skudlarski P, Jagannathan K, Calhoun VD, Hampson M, Skudlarska BA, Pearlson G (2008) Measuring brain connectivity: diffusion tensor imaging validates resting state temporal correlations. Neuroimage 43:554–561
Smith SM, Jenkinson M, Woolrich MW, Beckmann CF, Behrens TE, Johansen-Berg H, Bannister PR, De Luca M, Drobnjak I, Flitney DE (2004) Advances in functional and structural MR image analysis and implementation as FSL. Neuroimage 23:S208–S219
Song J, Tucker DM, Gilbert T, Hou J, Mattson C, Luu P, Holmes MD (2013) Methods for examining electrophysiological coherence in epileptic networks. Front Neurol 4:55
Sporns O (2011) The human connectome: a complex network. Ann N Y Acad Sci 1224:109–125
Stefan H, Nimsky C, Scheler G, Rampp S, Hopfengärtner R, Hammen T, Dörfler A, Blümcke I, Romstöck J (2007) Periventricular nodular heterotopia: a challenge for epilepsy surgery. Seizure 16:81–86
Stieltjes B, Kaufmann WE, van Zijl PC, Fredericksen K, Pearlson GD, Solaiyappan M, Mori S (2001) Diffusion tensor imaging and axonal tracking in the human brainstem. Neuroimage 14:723–735
Sutherling WW, Mamelak AN, Thyerlei D, Maleeva T, Minazad Y, Philpott L, Lopez N (2008) Influence of magnetic source imaging for planning intracranial EEG in epilepsy. Neurology 71:990–996
Thivard L, Adam C, Hasboun D, Clemenceau S, Dezamis E, Lehericy S, Dormont D, Chiras J, Baulac M, Dupont S (2006) Interictal diffusion MRI in partial epilepsies explored with intracerebral electrodes. Brain 129:375–385
Towle VL, Carder RK, Khorasani L, Lindberg D (1999) Electrocorticographic coherence patterns. J Clin Neurophysiol 16:528–547
Tufts DW, Kumaresan RIK (1982) Data adaptive signal estimation by singular value decomposition of a data matrix. Proc IEEE 70:684–685
Vaessen MJ, Jansen JF, Vlooswijk MC, Hofman PA, Majoie HM, Aldenkamp AP, Backes WH (2011) White matter network abnormalities are associated with cognitive decline in chronic epilepsy. Cereb Cortex 22:2139–2147 bhr298
Widjaja E, Simao G, Mahmoodabadi S, Ochi A, Snead O, Rutka J, Otsubo H (2010) Diffusion tensor imaging identifies changes in normal-appearing white matter within the epileptogenic zone in tuberous sclerosis complex. Epilepsy Res 89:246–253
Woods RP, Grafton ST, Holmes CJ, Cherry SR, Mazziotta JC (1998) Automated image registration: i. General methods and intrasubject, intramodality validation. J Comput Assist Tomogr 22:139–152
Xia M, Wang J, He Y (2013) BrainNet Viewer: a network visualization tool for human brain connectomics. PLoS One 8:e68910
Yogarajah M, Duncan JS (2007) Diffusion-based magnetic resonance imaging and tractography in epilepsy. Epilepsia 49:189–200
Yogarajah M, Powell HW, Parker GJ, Alexander DC, Thompson PJ, Symms MR, Boulby P, Wheeler-Kingshott CA, Barker GJ, Koepp MJ, Duncan JS (2008) Tractography of the parahippocampal gyrus and material specific memory impairment in unilateral temporal lobe epilepsy. Neuroimage 40:1755–1764
Zalesky A, Fornito A, Bullmore ET (2010) Network-based statistic: identifying differences in brain networks. Neuroimage 53:1197–1207
Zhang J, Liu Q, Mei S, Zhang X, Liu W, Chen H, Xia H, Zhou Z, Wang X, Li Y (2014) Identifying the affected hemisphere with a multimodal approach in MRI-positive or negative, unilateral or bilateral temporal lobe epilepsy. Neuropsychiatr Dis Treat 10:71
Acknowledgments
This work was supported in part by NIH grant R01-EB013227.
Author information
Authors and Affiliations
Corresponding author
Ethics declarations
Conflicts of Interest
Andrew Zillgitt disclosures: Speaker’s Bureau for UCB and Lundbeck. Travel expenses paid by NeuroPace. None of other authors has any conflict of interest to disclose.
Appendix
Appendix
The following steps are taken for gray matter modeling:
-
1.
Create the AC-PC (anterior commissure- posterior commissure) coordinate system using the graphical interface to identify structural landmarks (Fig. 14).
Fig. 14 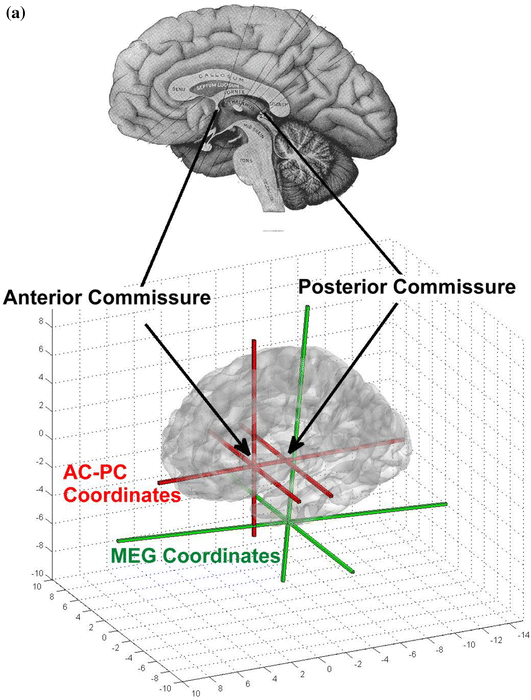
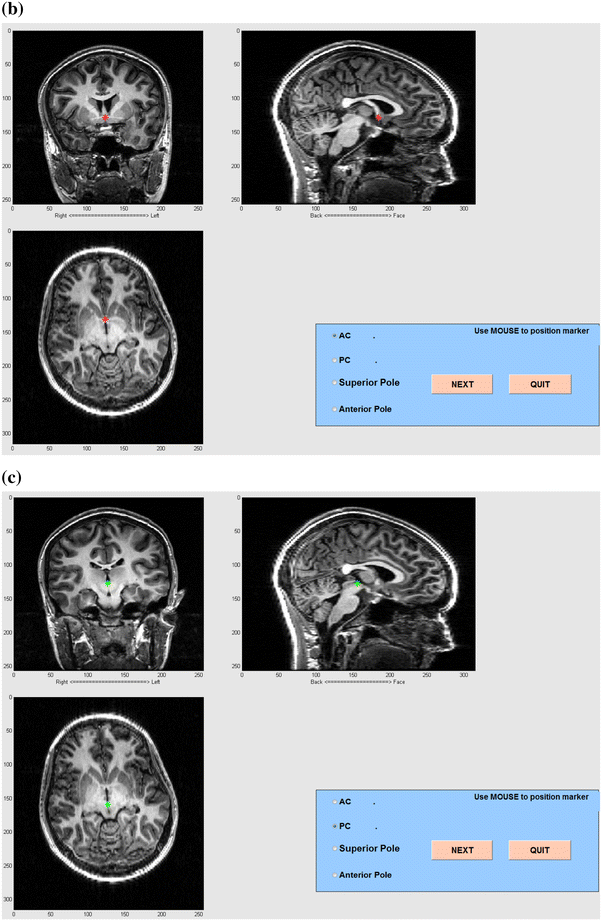
AC-PC coregistration (a) and graphical tools in MEG Tools for MEG-MRI coregistration (b) and (c). In a, the anterior commissure and, in b, the posterior commissure are identified
-
2.
Identify the outline of the cortical surface on five MRI slices allowing the user to compensate for defects (Fig. 15). The slices are interpolated to a total number of 15 cortical slice boundaries.
Fig. 15 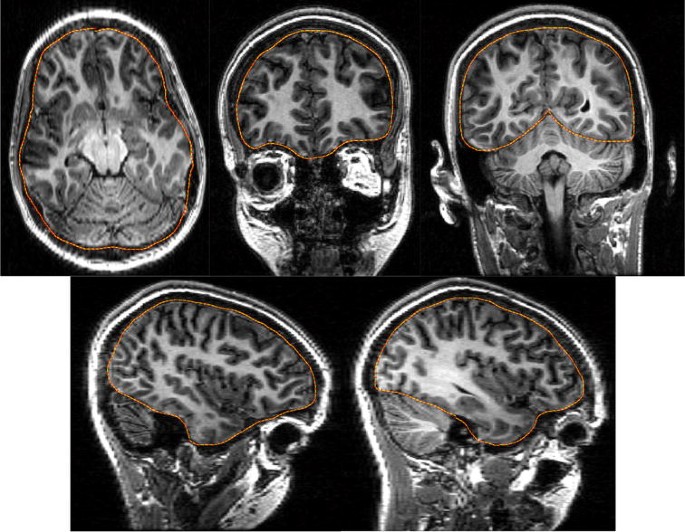
The location of the cortical boundary is manually identified in five slices
-
3.
Using linear and locally nonlinear transforms a smooth cortical surface model is fit to the 15 cortical boundaries, including five user-drawn boundaries in Fig. 15 (Fig. 16).
Fig. 16 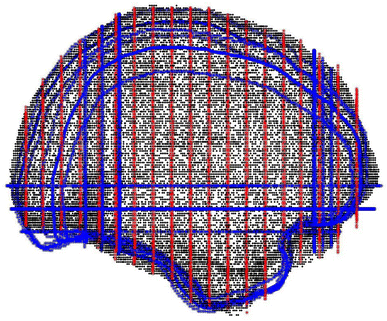
A smooth cortical surface model of the subject (in gray scale) is constructed to minimize the surface distance with 15 cortical boundaries. The cortical boundaries are depicted in blue, including five boundaries drawn by the user. The outer border of the gray matter in the cortical source model slices are depicted by red lines (Color figure online)
-
4.
The cortical gray matter is identified and a 4000 source location cortical model constructed for MEG imaging. The cortical surface model of the subject is adjusted to match the outer boundary of the cortical gray matter.
-
5.
The cortical surface is transformed to AC-PC coordinates. A combination of linear warps and shears is applied to the subject’s cortical surface to achieve the best match to a cortical surface model of the MNI305 brain. The shears align the anterior and posterior poles of the subject cortical surface with the MNI surface model. A closest neighbor algorithm is used to identify the corresponding subject and MNI surface points which are used in all transform calculations. These transforms operate on the volume within the cortical surface as well as the surface itself.
-
6.
Within a sequence of three to five overlapping Gaussian windows, second order transforms of included brain volume are calculated along the inferior-superior axis (Z) first, left–right axis (X) second and posterior-anterior (Y) axis last (Fig. 17). These locally nonlinear brain volume transforms further optimize the match of the subject cortical surface to the MNI surface model within each window (Fig. 18), using the following equation:
Fig. 17 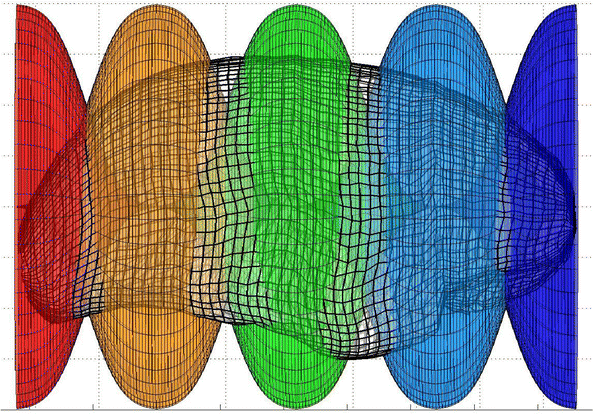
Five overlapped window functions are shown along the posterior-anterior axis of the cortical surface. The maximum amplitude of each window function is 1. Adjacent window functions overlap and the sum of their amplitudes is one. Thus, the full transform throughout the cortical volume is a continuous mixture of windowed transforms. The same windowing technique is applied along the inferior-superior axis and left–right axis. Furthermore, these one dimensional windows can be altered to be two- or three-dimensional windows to achieve more focal sensitivity to mismatch and to accommodate internal structural matching (Color figure online)
Fig. 18 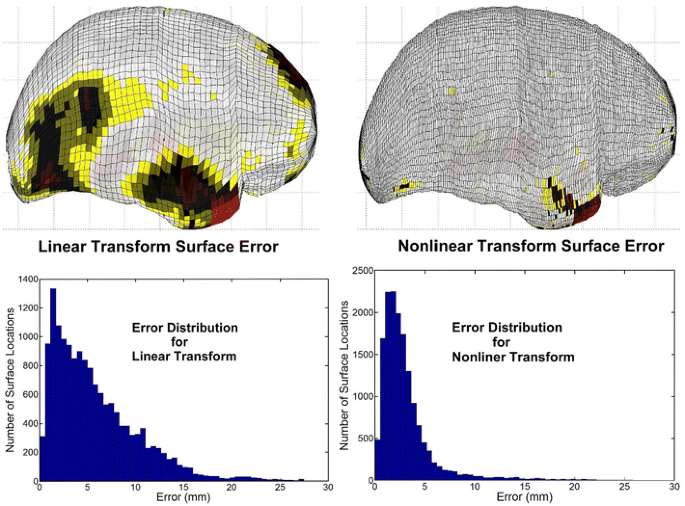
Errors in the transformed cortical surface are shown after the initial linear transformation and after the final nonlinear transformations. The magnitude of the error is displayed in color on the MNI305 cortical surface, with red corresponding to maximum error (Color figure online)


where A is transform matrix, XYZ, and \({\text{X}}_{\text{MNI}} {\text{Y}}_{\text{MNI}} {\text{Z}}_{\text{MNI}}\) are the native and MNI coordinate systems, respectively. The MNI coordinate system specifies the location of the brain structure within an AC-PC coordinate system (Fig. 14). Generalized Gaussian window functions are used to eliminate transform discontinuities. The inverse transform is generated to convert MRI to MNI305 coordinates. The algorithm generates a set of sequentially applied transforms that are applied to the original MRI pixel coordinates of the MEG imaging results.
Rights and permissions
About this article

Cite this article
Nazem-Zadeh, MR., Bowyer, S.M., Moran, J.E. et al. MEG Coherence and DTI Connectivity in mTLE. Brain Topogr 29, 598–622 (2016). https://doi.org/10.1007/s10548-016-0488-0
Received:
Accepted:
Published:
Issue Date:
DOI: https://doi.org/10.1007/s10548-016-0488-0