
Abstract
As part of the development of a European Seismic Risk Model 2020 (ESRM20), the spatial and temporal evolution of seismic design across Europe has been studied in order to better classify reinforced concrete buildings (which represent more than 30% of the approximately 145 million residential, commercial and industrial buildings in Europe) and map them to vulnerability models based on simulated seismic design. This paper summarises the model that has been developed to assign the years when different seismic design levels (low code, moderate code and high code) were introduced in a number of European countries and the associated lateral forces that were specified spatially within each country for the low and moderate codes for typical reinforced concrete mid-rise buildings. This process has led to an improved understanding of how design regulations evolved across Europe and how this has impacted the vulnerability of the European residential building stock. The model estimates that ~ 60% of the reinforced concrete buildings in Europe have been seismically designed, and of those buildings ~ 60% have been designed to low code, ~ 25% to moderate code and 15% to high code. This seismic design model aims at being a dynamic source of information that will be continuously updated with additional feedback from local experts and datasets. To this end, all of the data has been made openly available as shapefiles on a GitLab repository.
1 Introduction
The practice of seismic design and zonation in Europe and across the World has been covered in various reference papers/reports (e.g.Mayordomo et al. 2004; Doğangün and Livaoğlu 2006; Solomos et al. 2008; fib Bulletin-69 2013; Daniell 2015), handbooks (e.g. Paz 1994), international initiatives (e.g. the information network of earthquake disaster prevention technologies of the IISEE,Footnote 1 the IAEE’s ‘Regulations for Seismic Design—A World list’Footnote 2), international conferences (e.g. Sixth International Conference on Seismic ZonationFootnote 3) and European projects (e.g. RISK-UE, see Milutinovic and Trendafiloski 2003). The focus of most of these publications has been mainly to document the state of recent practice of seismic design and zonation, to enable a comparison between countries. Whilst such initiatives are important for the future development, improvement and harmonisation of seismic design codes, it should be considered that a significant proportion of the reinforced concrete building stock in Europe has been constructed before the introduction of these modern codes and thus an understanding of the evolution of seismic design is essential for the seismic risk assessment of European buildings.
Fajfar (2018) published an important summary of the changes in the analysis of structures over the past 100 years for the purposes of seismic design and assessment. As discussed in Fajfar (2018), up until 1978 the seismic design of buildings was dominated by the use of equivalent static procedures through the specification of a lateral force coefficient (or seismic coefficient), and this practice is still widely used today for simple regular structures, with updated values for the lateral force coefficients. Over the years, updates to the method of calculation of the lateral force coefficients have accounted for the dynamics of the structures, as well as material ductility, and concepts of randomness (safety factors) have been introduced in the design calculations (Fajfar 2018).
As part of the RISK-UE project, the design lateral force coefficients as a function of fundamental period were estimated for reinforced concrete frame buildings in two time periods (1966 and in 1992) for Spain, France, Italy, North Macedonia, Greece, Romania and Bulgaria. Building upon this study initiated in RISK-UE, this paper summarises the spatial and temporal model that has been developed to distinguish between reinforced concrete buildings in Europe according to the key principles of seismic design and the levels of lateral forces to which these buildings were designed. An understanding of the level of design of a given building class is fundamental for the development of vulnerability models that are capable of representing the features of each design level (see e.g. Borzi et al. 2008; Verderame et al. 2010; Romão et al. 2019). Furthermore, a comparison of design capacity maps with the latest seismic hazard maps provides a good indicator of seismic safety and has been used in prioritisation schemes for retrofitting of school buildings (see e.g. Grant et al. 2007).
The study presented herein has contributed to the development of a European exposure model (Crowley et al. 2020a), a component of the European Seismic Risk Model (ESRM20) (Crowley et al. 2019) which is being released through the risk services of EFEHR, the European Facilities for Earthquake Hazard and Risk (https://eu-risk.eucentre.it).
2 Simplified categories of European design codes
For a harmonised classification of seismic design codes across Europe, the following four simple categories of seismic design (described in more detail subsequently) have been identified:
-
CDN: no seismic design.
-
CDL: low code (i.e. the first generation of seismic design codes).
-
CDM: moderate code (i.e. the second generation of seismic design codes).
-
CDH: high code (i.e. the latest generation of seismic design codes).
Buildings of design class CDN were typically designed to older codes (from before the 1960’s) that used allowable stresses and very low material strength values and considered predominantly the gravity loads. Buildings of design class CDL were designed considering the seismic action by enforcing values of the seismic coefficient, β (referred to herein as lateral force coefficient). Structural design for these codes was typically based on material-specific standards that used allowable stress design or a stress-block approach.
Seismic design including modern concepts of ultimate capacity and partial safety factors (limit state design) and/or with better detailing to improve global ductility, was the basis of the CDM category of codes. The seismic action was also accounted for in the design by enforcing values for the lateral force coefficient, β. It is noted that the distinction between CDL and CDM codes is not always straightforward and varying interpretations from those presented later in this study could be made by different engineers. Finally, the CDH class refers to modern seismic design principles that account for capacity design and local ductility measures, similar to those available in Eurocode 8 (CEN 2004) for ductility class medium (DCM) (which is assumed to reflect the most frequently adopted ductility class).
An important issue worth mentioning here is the consideration of the quality of code enforcement and compliance. This effect within the building stock of a given construction period is assumed to be random, and it is thus not explicitly reported in the exposure model but is instead considered within the building-to-building variability of the vulnerability models (Romão et al. 2019). The vulnerability models for reinforced concrete buildings in the European Seismic Risk Model are based on simulated design, considering each of the aforementioned design classes (CDL, CDM and CDH). Numerical models of the designed buildings are developed and capacity curves are obtained through nonlinear static analysis (these capacity curves are openly available from the following online resource: Romão et al. (2020)). In order to account for code enforcement and compliance, the design values of stirrup spacing, concrete cover, concrete strength, and steel yield strength of the longitudinal and transverse reinforcement are modified for implementation in the numerical models through quality factors (which have three levels: good, moderate, bad). Currently, a Europe-wide assumption on these quality factors for each design code (CDL, CDM and CDH) has been made when developing the vulnerability models, but these quality factors could be varied in the future for each country as a function of the percentage of buildings deemed to have good, moderate and bad enforcement/compliance in each construction period.
The years when each of these design classes were introduced in European countries with a history of seismic design are summarised in Table 1, and presented in Fig. 1. This table provides the first year when a given class of design code was introduced, but also provides in some cases the years when important updates to the seismic zonation maps were made, which led to a modification to the lateral force specified in the design. The seismic zonation maps identified the areas where the code had to be applied within the country and in many cases only limited areas of the country needed to apply the first set of seismic regulations and these areas grew over time, as described in the next section.

Temporal evolution of seismic design codes across European countries. Vertical black lines show when important changes within a category of design code were made. Some important earthquakes which have influenced seismic design in Europe are also shown
The values in bold in Table 1 represent the years that have been considered in the European exposure model; not all code changes have been considered given that the focus is at the European level. In some countries (e.g. Turkey, ex-Yugoslavian countries), the year that has been considered in the exposure model corresponds to that when the design class was widely enforced/implemented rather than the first year when the seismic design class was introduced. In general it should be considered the date of publication of a standard does not necessarily correspond to the date the building code was fully enforced, and this can be of particular relevance to the high code dates reported in Table 1. Indeed, the status of adoption of Eurocode 8 (CEN 2004) in the former Yugoslavian countries is complex—for these countries only the years when EC8 was first formally enforced are shown for each country in Fig. 1 (noting that in most cases EC8 has been introduced earlier, and in parallel with the 1981 ex-Yugoslavian code).
The commonly used acronyms of the codes are provided in Table 1, whereas the full references for the codes are given in the "Appendix". This table has been compiled using the knowledge of the authors (which covers the majority of the countries in Table 1), access to the original code documentation, key references including IISEE1 and Paz (1994), as well the additional references provided in the last column of Table 1.
There are around 145 million buildings in the European exposure model (Crowley et al. 2020a), and around 30% of these are modelled as reinforced concrete. Figure 2 shows the application of the temporal evolution of seismic design presented above to the European exposure model, and shows the number of reinforced concrete buildings and their distribution between the different seismic design code levels for each country in Europe. Of the reinforced concrete buildings, around 60% have some level of seismic design, with ~ 60% of those designed to low codes, ~ 25% to moderate codes and ~ 15% to high codes.

Map showing the number of reinforced concrete buildings in each country in the European exposure model with pie-charts showing the percentage that are pre-code (CDN), low code (CDL), moderate code (CDM) and high code (CDH)
3 Calculation of lateral force coefficients
The design lateral force coefficient, β (i.e. the fraction of the weight of the building defining the lateral force) that was specified in each of the low and moderate design codes for typical mid-rise reinforced concrete frames has been calculated by retrieving the seismic zonation maps supplied with each design code and applying the specified coefficients in the following standard formula, which has been found to be generally applicable to all of the design codes (with some small variations):
where Ks is a coefficient based on seismic intensity, Ko is a coefficient based on the type/importance of the building, Kd is a coefficient that accounts for dynamic response, and Kp is a coefficient that accounts for ductility and energy dissipation (and in modern codes also accounts for overstrength). In some codes the values of this last coefficient are provided as 1/Kp but they have been converted to Kp herein for the standard implementation of Eq. (1). It is noted that in the older generation of codes, Ks is directly provided for different soil types and the dynamic coefficient is only a function of the building type, whereas in more recent codes the effect of the soil is either accounted for with an additional coefficient or is integrated into the dynamic coefficient (Kd). In some CDM codes (with limit state design), the lateral force coefficient is further multiplied by a partial safety factor for loads. This has not been included in Eq. (1) as it appears to only be different from 1 for the Portuguese code.
Tables 2 and 3 present the values of each of the coefficients of Eq. (1), that have been retrieved from the low and moderate codes in Table 1, and the calculation of the lateral force coefficient for each seismic intensity zone for a medium-rise residential building with a reinforced concrete (RC) frame structure on medium soil, with an assumed period of vibration of 0.5 s. It is noted that for Iceland the calculations have been made using RC wall buildings as there are very few RC frame buildings in the country, according to the exposure model proposed by Crowley et al. (2020a). Only a focus on the low (CDL) and moderate (CDM) codes has been made herein as they make up 85% of the seismically designed reinforced concrete buildings in Europe, and given that the building stock is being classified for loss assessment, buildings designed with no or low levels of seismic design will influence most the total losses. Interested readers are referred to other publications that have focused on comparing the seismic zonation in these modern codes (e.g. Solomos et al. 2008; Mayordomo et al. 2004). Nevertheless, future extensions of this study will include the calculation of the lateral force coefficients for the high codes given in Table 1, as the number of buildings designed to these modern codes continues to grow across Europe, and to provide input to studies considering the impact of upgrading buildings to current code standards.
It is acknowledged that the lateral force coefficient for a mid-rise reinforced concrete building is a simplistic representation of the evolution of seismic design in Europe, and differences in, for example, seismic mass modelling, section detailing, and changes with period of vibration, have not been considered herein. Nevertheless, it is believed that such an approach is appropriate for a regional exposure model covering the whole of Europe, and will allow the relative vulnerability of reinforced concrete buildings across Europe to be adequately represented within the European Seismic Risk Model (ESRM20).
As can be seen from Table 2, in many of the earliest seismic design codes introduced before the 1960’s (e.g. in Italy, Bulgaria, Portugal) the lateral force coefficient was specified as a fixed value that was applied to areas where earthquakes had been observed in the past and it was thus just a function of the seismic intensity (which was often correlated with observed macroseismic intensity from past major earthquakes). The value of the lateral force coefficient was typically taken at around 10% with lower values in areas of the country where the observed effects of earthquakes had historically been less pronounced.
From the beginning of the 1960’s, dynamic considerations were introduced in many codes by relating the lateral force coefficient to the natural period of vibration of the building (i.e. through a response spectrum) and later to the energy dissipation capacity of the structures (i.e. ductility and damping). As discussed in Chopra (2007), the idea to represent earthquake excitation by a response spectrum was first put forward in 1926 by K. Suyehiro, soon after the 1923 Tokyo earthquake. However, the widespread engineering use of response spectra did not take hold until the 1960’s with the arrival of digital computing which made their calculation more reliable and less time consuming (Chopra 2007; Trifunac 2008). The first set of standard spectral shapes for design was developed by Housner (1959) by averaging and smoothing the response spectra from eight strong-motion records obtained from four earthquakes that occurred in the United States between 1934 and 1952. Trifunac (2008) describes the use of response spectra in design from the 1950’s in the United States, whereby the dynamic response was accounted for using a coefficient (nominated Kd herein) that was inversely proportional to the period, which was also adopted in many European codes in the 1960’s, as indicated in Table 4.
As discussed in Fajfar (2018), the first code to account for the energy dissipation capacity of structures in the inelastic range was the SEAOC model code in 1959. A coefficient (named Kp coefficient in Eq. 1) was introduced to distinguish between the inherent ductility and energy dissipation capacities of different structures and varied between 1.33 for wall structures to 0.67 for moment frames. In 1963, the Romanian code introduced a coefficient (equal to 1.2) to account for the influence of friction damping in reinforced concrete moment resisting frames. The Bulgarian code of 1964 accounted for structural damping by specifying values between 0.5 and 1.5 as a function of the flexibility of the structure with 1.0 assumed herein for reinforced concrete frames with infill panels. The 1975 Turkish code specified a value of 1.5 for the ‘structural coefficient’ of nonductile moment-resisting frames with unreinforced masonry partition walls.
Over time, and following a number of large earthquakes, it became clear that the majority of well designed and constructed buildings survived strong ground motions, despite having only been designed for a fraction of the forces that would have developed had those structures behaved linearly elastically. By accounting for the energy dissipation and overstrength in the design, it became possible to reduce the seismic design forces. To account for this the ‘response modification factor’ was introduced in 1978 in the US within ATC 3–06 (Fajfar 2018). Likewise, it can be seen from Table 2 that the 1978 Hungarian code specified a ‘reduction factor’ of 0.25 for reinforced concrete multistorey buildings without frame-shear wall interaction. It was explicitly stated that this factor accounted for the fact that the seismic forces were obtained from an elastic analysis and thus considered the effect of the potential nonlinear behaviour of the structure, ductility, internal force redistribution, and energy dissipation through damping. Table 2 shows, however, that there were still a number of countries in Europe that did not account for either the Kd or Kp coefficients in the calculation of the lateral force coefficients, even up until the 1990’s (e.g. Italy, Spain, Greece).
Table 3 shows that the majority of the moderate codes were introduced in the 1980’s and 90’s and by then most codes included all of the coefficients in Eq. (1). The formula to calculate the dynamic coefficient Kd in each moderate code is presented in Table 5. These design values show there was still divergence in the engineering community regarding the modelling of dynamic amplification in the code. Nevertheless, in many countries the trend was moving towards representing the seismic intensity coefficient with the peak ground acceleration in terms of g and amplifying the spectrum up to a maximum of 2.5 with different shapes as a function of the soil category.
A comparison of the Kp coefficients in the moderate codes (Table 3) shows that all codes moved towards a ‘reduction factor’ approach with values between 0.1 and 0.5 for reinforced concrete frames, except in the former Yugoslavia where the value was fixed at 1.0. It is noted that when the importance coefficient was accounted for, it was found to be equal to 1.0 for ordinary residential buildings in all of the codes studied herein.
4 Application of lateral force coefficients to the European exposure model
Maps of all of the seismic zones presented in Tables 2 and 3 have been obtained and geocoded in order to map the variation of the lateral force coefficients across Europe over the past century. The resulting shapefiles for each country have been made available on a GitLab repository.Footnote 4 Figure 3 has been produced using these shapefiles to show the spatial and temporal evolution of lateral force coefficients (as calculated above) across Europe from 1910 to 2000. This figure highlights that the biggest change in seismic design occurred in the 1970’s when a large number of countries implemented seismic design codes, and the lateral force coefficients did not change significantly in most countries from then until the end of the last century. It should be noted, however, that this figure does not account for the change in code type from low to moderate, which will have led to improvements in the design over this period.

Spatial and temporal evolution of lateral force coefficients across Europe from 1910 to 2000. These maps can also be viewed through the following interactive viewer: https://maps.eu-risk.eucentre.it/map/european-seismic-design-levels (Crowley et al. 2020b)
These shapefiles have also been used to assign the lateral force coefficients to the reinforced concrete buildings in the European exposure model (as a function of their design code level and location). Figure 4 shows the number of buildings with code level CDL and CDM in the European exposure model and the distribution of lateral force coefficients within each country.

Map of the number of buildings with code level CDL (left) and CDM (right) in the European exposure model and the distribution of lateral force coefficients (for mid-rise RC frame buildings on medium soil) within each country. (Note that the countries in grey have not been considered in the study presented herein.)
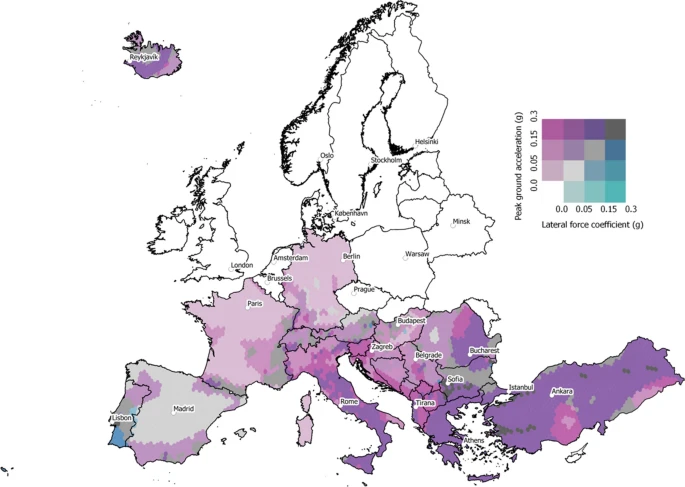
These results also allow us to understand the areas of Europe with the most vulnerable reinforced concrete buildings, when compared with current seismic actions. Figure 5 presents the spatial variation of both the lateral force coefficient used in design between 1960 and 1970 together with the variation of peak ground acceleration (PGA) on rock with a 475-year return period according to the ESHM13 model (Woessner et al. 2015). Figure 6 provides a similar map showing the lateral force coefficients used in design between 1990 and 2000. If we consider typical design using modern codes, for the considered mid-rise reinforced concrete building with 0.5 s period on moderate soil, we might expect the lateral force coefficient to be of a similar value to the peak ground acceleration on rock (following spectral amplification of around 3 for medium soil and reduction using behaviour factors also of the order of 3). Hence, we would ideally want the map to represent the grey colours shown on the diagonal of the legend of these maps. The pink areas on these maps show areas where current seismic actions (according to the ESHM13 model) are higher than the lateral force coefficients used in design, and the darker the pink the larger the discrepancy. These are thus the areas where the most vulnerable buildings in Europe are expected to be located; see for example the areas in Italy, much of the Balkans and Turkey (before the 1970’s). On the other hand, the turquoise areas show where current seismic actions (according to ESHM13) are lower than the lateral force coefficient considered in design at the time.

Bi-variate map presenting both the spatial variation of lateral force coefficient used in design between 1960 and 1970 and the peak ground acceleration on rock with a 475-year return period from the ESHM13 model (Woessner et al. 2015). (Note that the countries in white have not been considered in the study presented herein.)
Bi-variate map presenting both the spatial variation of lateral force coefficient used in design between 1990 and 2000 and the peak ground acceleration on rock with a 475-year return period from the ESHM13 model (Woessner et al. 2015). (Note that the countries in white have not been considered in the study presented herein.)
As expected, there is a reduction in the deficiency of seismic actions from the 1970’s to the 1990’s, but there are still large areas of Europe where current probabilistic seismic hazard assessment leads to a higher level of design. It should be noted that these conclusions are based on the ESHM13 hazard model, which is currently undergoing revision, and the official seismic actions used for seismic design in each country differ from those in the ESHM13. Hence these results can only give a general indication of the level of deficiency in seismic actions across Europe, and comparisons at the national level should be undertaken. Such comparisons will be facilitated with the release of the data used to produce the maps presented herein.
5 Concluding remarks
This paper has presented a model of the spatial and temporal evolution of seismic design of reinforced concrete buildings across Europe during the last century. This model has been developed using the knowledge of structural engineers from many countries in Europe and has been applied to the European exposure model (Crowley et al. 2020a) to better classify the vulnerability of reinforced concrete buildings within the European Seismic Risk Model (ESRM20), soon to be released through the risk services of the European Facilities for Earthquake Hazard and Risk (https://eu-risk.eucentre.it/seismic-risk/).
It is noted that, in some cases, simplifying assumptions have had to be made to develop the model presented herein, given that the focus is at the European level and thus it has not been possible to implement all changes made to the codes and seismic zonation maps. An attempt has been made to identify the codes which led to the most important changes in lateral force coefficients in each country. Nevertheless, if any readers have any feedback on the assumptions and values presented herein (and in the supplementary material) they are invited to share their feedback and become one of the contributors to the European Seismic Risk model.Footnote 5
It has been found that around 60% of the reinforced concrete buildings in the exposure model have been designed to some level of seismic action, with 85% having been designed to low or moderate levels of seismic design. When selecting the design codes to consider for the model, some consideration was given to the date after which widespread adoption/enforcement of codes was applied within a given country, but it should also be considered that in many countries buildings have been constructed without code compliance. This aspect is not currently considered in the exposure model and has been accounted for in the vulnerability models through the use of so-called ‘quality factors’. Evaluation of the level of code enforcement and compliance in European countries deserves further attention in future updates to the European Seismic Risk Model, to allow country-specific quality factors to be assigned during the development of the vulnerability models.
A detailed investigation into the values of lateral force coefficients applied in the selected design codes across Europe was also undertaken herein to better represent the relative vulnerability of reinforced concrete buildings in the exposure model. In future updates to the exposure model, further attention will need to be given to the CDH buildings, in particular for what concerns the year of enforcement and the ductility classes that have been most frequently adopted across Europe.
In this paper some initial insights are provided into the areas of Europe where the seismic design of reinforced concrete buildings is highly deficient when compared with the seismic actions expected by today’s standards, which for the older building stock covers much of Europe, with particularly high deficiencies in a significant proportion of Italy, much of the Balkans and Turkey. These are the regions in Europe where further attention to strengthening and retrofitting of reinforced concrete buildings should be prioritised. The ESRM20 model will be able to provide a quantitative assessment of the contribution of these buildings to the losses in these countries, and it will be possible to undertake cost–benefit studies to assess the impact of upgrading these buildings to modern design standards.
Data availability
The following GitLab repository includes the Shapefiles of the maps for each country with distribution of lateral force coefficients: https://gitlab.seismo.ethz.ch/efehr/esrm20_exposure/-/tree/master/seismic_design_shapefiles. The data of Fig. 3 is also available through the ‘Evolution of European Seismic Design Levels Viewer’ at the following URL: https://maps.eu-risk.eucentre.it/map/european-seismic-design-levels (Crowley et al. 2020b).
Notes
References
Adam C (2012) Recent actions taken in Austria towards seismic risk assessment and reduction. In: Proceedings of 15th World Conference on Earthquake Engineering, Lisbon, Portugal
Baballëku M, Myftaraga E (2020) A short history of seismic design codes in Albania. In: International conference on geosciences and earthquake engineering, challenges for Balkan Region ICGEE-2020, Tirana, Albania
Barbat A, Paz M (1994) Chapter 31 Spain. In: Paz M (ed) International handbook of earthquake engineering. Springer, Dordrecht
Bilgin H, Korini O (2013) Seismic safety assessment of an unreinforced masonry building in Albania, Vienna Congress on recent advances in earthquake engineering and structural dynamics (VEESD 2013), Vienna, Austria, paper no. 205
Boissonnade A (1994) Chapter 16 France. In: Paz M (ed) International handbook of earthquake engineering. Springer, Dordrecht
Borzi B, Pinho R, Crowley H (2008) Simplified pushover-based vulnerability analysis for large-scale assessment of RC buildings. Eng Struct 30(3):804–820
CEN (2004) Eurocode 8: design of structures for earthquake resistance. European Standard, European Committee for Standardiation, Brussels
Chopra AK (2007) Elastic response spectrum: a historical note. Earthq Eng Struct Dynam 36:3–12
Costa AC, Sousa ML, Carvalho A (2008) Seismic zonation for Portuguese national annex of Eurocode 8. In: Proceedings of the 14th World Conference on Earthquake Engineering, Beijing, China
Craifaleanu I, Georgescu ES, Borcia IS, Praun C, Lungu D, Aldea A, Vacareanu R, Arion C (2010) The evolution of seismic design codes in Romania (1941–2006) (in Romanian). Available from URL: http://inforisx.incd.ro/cod.htm
Crowley H, Rodrigues D, Silva V, Despotaki V, Martins L, Romão X, Castro JM, Pereira N, Pomonis A, Lemoine A, Roullé A, Tourlière B, Weatherill G, Pitilakis K, Danciu L, Correia AA, Akkar S, Hancilar U, Covi P (2019) The European seismic risk model 2020 (ESRM20). In: 2nd International Conference on Natural Hazards and Infrastructure, ICONHIC 2019
Crowley H, Despotaki V, Rodrigues D, Silva V, Toma-Danila D, Riga E, Karatzetsou A, Sousa L, Ozcebe S, Zugic Z, Gamba P (2020a) Exposure model for European seismic risk assessment. Earthq Spectra. https://doi.org/10.1177/8755293020919429
Crowley H, Despotaki V, Silva V, Dabbeek J, Romão X, Pereira N, Castro JM, Daniell J, Veliu E, Bilgin H, Adam C, Deyanova M, Ademović N, Atalic J, Riga E, Karatzetzou A, Bessason B, Shendova V, Tiganescu A, Toma-Danila D, Zugic Z, Akkar S, Hancilar U (2020b) Evolution of European seismic design levels data (version 1.0). https://doi.org/10.7414/EUC-EVOLUTION-EUROPEAN-SEISMIC-DESIGN-LEVELS-v1.0
Daniell JE (2015) Global view of seismic code and building practice factors. Encyclopedia of earthquake engineering. Springer, Berlin, Heidelberg, pp 1109–1119
Diez AA, Larrera CS (2012) Reconsidering urban planning in Spain after the Lorca earthquake (11th May 2011). In: Proceedings of the 15th World Conference on Earthquake Engineering, Lisbon, Portugal
di Pasquale G, Fralleone A, Pizza AG, Serra C (1999) Synthesis of the code evolution from the royal decree issued after the Messina and Reggio earthquake up to the first Ministry decree issued after the law n. 64/74. In: De Marco R, Martini MG (eds) La classificazione e la normativa sismica italiana dal 1909 al 1984. Istituto Poligrafico e Zecca dello Stato, Roma
di Pasquale G, Fralleone A, Pizza AG, Serra C (1999) Relevant changes to the Italian seismic code from 1909 to 1975—a synoptic table. In: De Marco R, Martini MG (eds) La classificazione e la normativa sismica italiana dal 1909 al 1984. Istituto Poligrafico e Zecca dello Stato, Roma
Dimova S, Fuchs M, Pinto A, Nivolova B, Sousa L, Iannaccone S (2015) State of the implementation of the Eurocodes in the European Union, EUR 27511 EN, https://doi.org/10.2788/854939
Doğangün A, Livaoğlu R (2006) A comparative study of the design spectra defined by Eurocode 8, UBC, IBC and Turkish earthquake code on R/C sample buildings. J Seismolog 10(3):335–351
Durgunoglu T (1994) Chapter 34 Turkey. In: Paz M (ed) International handbook of earthquake engineering. Springer, Dordrecht
Fajfar P (2018) Analysis in seismic provisions for buildings: past, present and future. The fifth Prof. Nicholas Ambraseys lecture. Bull Earthq Eng 16:2567–2608
Fib Bulletin-69 (2013). Critical comparison of major seismic codes for buildings, the international federation for structural concrete
Freddi F, Novelli V, Gentile R, Veliu E, Andreev S, Andonov A, Greco F, Zhuleku E (2021) Observation from the 26th November 2019 Albania Earthquake: the Earthquake Engineering Field Investigation Team (EEFIT) mission. Bull Earthquake Eng. https://doi.org/10.1007/s10518-021-01062-8
Housner GW (1959) Behaviour of structures during earthquakes. ASCE J Eng Mech Div 85(EW4):109–129
Gobesz ZF, Kegyes C (2013) Brief history and evolution of seismic design codes in Hungary and Romania. In: Proceedings of C60 international conference, Romania
Grant D, Bommer J, Pinho R, Calvi GM, Goretti A, Meroni F (2007) A prioritization scheme for seismic intervention in school buildings in Italy. Earthq Spectra 23(2):291–314
Jalil W (1992) New French seismic code orientations. In: Proceedings of 10th world conference on earthquake engineering, Rotterdam
JRC (2018) Present status of Eurocodes in Albania, presented by Rikard LUKA, Chairman of TC-250 Mirror Committee—Albania, available from URL: https://eurocodes.jrc.ec.europa.eu/doc/2018_10_WS_Balkan/presentations/1_Country_Report_Albania.pdf
Jurukovski D, Gavrilovic P (1994) Chapter 39 Former Yugoslavia. In: Paz M (ed) International handbook of earthquake engineering. Springer, Dordrecht
Kegyes C, Kegyes-Brassai O (2007) The New national annex of the Hungarian code MSZ EN 1998-1-1:2006 and the panel structures. In: Proceedings of the international symposium on seismic risk reduction, Paper ID 04
Loyides D (1993) Earthquake-resistant building in Cyprus, A Master's Thesis. Submitted in partial fulfilment of the requirements for the award of Master of Philosophy at Loughborough University. Available from URL: https://repository.lboro.ac.uk/articles/Earthquake-resistant_building_in_Cyprus/9457850
Lestuzzi P (2012) Risk-based seismic evaluation of existing buildings. Approach used in Switzerland. In: Proceedings of APSEC-ICCER 2012: sustaining the world with better structures and construction practice, Surabaya, Indonesia
Manos GC (1994) Chapter 17 Greece. In: Paz M (ed) International handbook of earthquake engineering. Springer, Dordrecht
Mayordomo JG, Faccioli E, Paolucci R (2004) Comparative study of the seismic hazard assessments in European national seismic codes. Bull Earthq Eng 2(1):51–73
Milutinovic ZV, Trendafiloski GS (2003) WP4: Vulnerability of current buildings, RISK-UE Project Deliverable, Available from URL: http://www.civil.ist.utl.pt/~mlopes/conteudos/DamageStates/Risk%20UE%20WP04_Vulnerability.pdf
MLPDA (Romanian Ministry of Public Works, Development and Administration) (2020) List of technical regulations in constructions (in Romanian). Available from URL: https://www.mlpda.ro/pages/reglementare1
Paris N (2012) Evaluation of the Enceladus plan for facing the consequences of destructive earthquakes on the island of Cyprus. In: Boustras G, Boukas N (eds) Proceedings of the 1st international conference in safety and crisis management in the construction tourism and SME sectors. Brown Walker Press
Paz M (1994) International handbook on earthquake engineering. Springer, Dordrecht
Proença JM, Gago AS (2011) Background and justification. In: Proença JM, Gago AS (eds) Seismic strengthening of school buildings. Parque Escolar, EPE
Romão X, Castro JM, Pereira N, Crowley H, Silva V, Martins L, Rodrigues D (2019) European physical vulnerability models. SERA deliverable D26.5, Available from URL: https://eu-risk.eucentre.it/wp-content/uploads/2019/08/SERA_D26.5_Physical_Vulnerability.pdf
Romão X, Pereira N, Castro JM, De Maio F, Crowley H, Silva V, Martins L (2020) European building vulnerability data repository (Version v1.1). https://doi.org/10.5281/zenodo.4087810
Solnes J, Sigbjornsson R, Bessason B, Eliasson J (2013) Seismic hazard. In: Sólnes JS, Sigmundsson F, Bessason B (eds) Natural hazard in Iceland—volcanic eruptions and earthquakes. University of Iceland Press and Iceland Catastrophe Insurance, Amsterdam, p 785
Solomos G, Pinto A, Dimova S (2008) A review of the seismic hazard zonation in national building codes in the context of Eurocode 8. European Commission Joint Research Centre, Available from URL: https://eurocodes.jrc.ec.europa.eu/doc/EUR23563EN.pdf
Soyluk A, Harmankaya ZY (2012) The history of development in Turkish seismic design codes. Int J Civ Environ Eng IJCEE-IJENS 12(01):25–29
Trifunac MD (2008) Early history of the response spectrum method. Soil Dyn Earthq Eng 28:676–685
Tryggvason E, Thoroddsen S, Thorarinsson S (1958) Report on earthquake risk in Iceland. Timarit Verkfraedingafelags Islands. 43:81–97
Verderame GM, Polese M, Mariniello C, Manfredi G (2010) A simulated design procedure for the assessment of seismic capacity of existing reinforced concrete buildings. Adv Eng Softw 41(2):323–335
Vertes G (1994) Chapter 18 Hungary. In: Paz M (ed) International handbook of earthquake engineering. Springer, Dordrecht
Wenk T (2015) Risk-based seismic assessment of existing structures. In: Proceedings of the 11th Canadian conference on earthquake engineering, Victoria, BC, Canada, July 21–24, 2015
Woessner J, Danciu L, Giardini D, Crowley H, Cotton F, Grunthal G, Valensise G, Arvidsson R, Basili R, Demircioglu M, Hiemer S, Meletti C, Musson R, Rovida A, Sesetyan K, Stucchi M (2015) The 2013 European seismic hazard model: key components and results. Bull Earthq Eng 13:3553–3596
Acknowledgements
The authors would like to thank the anonymous reviewer for their thoughtful comments, which have greatly helped improve the manuscript. A full list of contributors that have provided feedback and insight for the development of the European exposure model through various workshops and questionnaires is provided here: https://eu-risk.eucentre.it/contributors/#exposure and all those who have provided feedback on design codes in their country are gratefully acknowledged.
Funding
The work presented herein has received funding from the European Union’s Horizon 2020 research and innovation program through the research projects (1) ‘‘SERA’’ Seismology and Earthquake Engineering Research Infrastructure Alliance for Europe, under Grant agreement No.730900 and (2) “RISE” Real-time Earthquake Risk Reduction for a Resilient Europe, under grant agreement No 821115. The 5th to 7th authors would like to thank the financial support of the Base Funding - UIDB/04708/2020 of CONSTRUCT - Instituto de I&D em Estruturas e Construções, funded by national funds through FCT/MCTES (PIDDAC). The 21st author has received funding from the Ministry of Science, Education and Technological Development of the Republic of Serbia within the project for technological development No.TR35002.
Author information
Authors and Affiliations
Corresponding author
Ethics declarations
Conflict of interest
Not applicable.
Additional information
Publisher's Note
Springer Nature remains neutral with regard to jurisdictional claims in published maps and institutional affiliations.
Appendix
Appendix
This appendix provides the full details for the design codes provided in Table 1.
1.1 Albania
-
Technical provisions for seismic design of constructions, 1952, Decision of the Council of Ministers, Albania (in Albanian).
-
The approval of the regulations for aseismic buildings and for the formation of seismological service in the country, 1963, Decision of the Council of Ministers, Albania (in Albanian).
-
KTP 2-78 (1978) Technical Design Regulations for Construction Works in Seismic Regions, Technical Design Regulations, Book I, Publishing House “8 Nëntori”, Ministry of Construction, Albania, pp.12–48 (in Albanian).
-
KTP-N.2-89 (1989) Technical Aseismic Regulations, Publication of Academy of Sciences and Ministry of Constructions, Tirana (in Albanian), 1989 (in Albanian).
1.2 Austria
-
ÖNORM B 4000-3 (1955) Berechnung und Ausführung der Tragwerke—allgemeine Grundlagen—Windlasten und Erdbebenkräfte (in German) (Translation: Calculation and design of structures—General principles—Wind loads and seismic forces), Austrian Standards Institute
-
ÖNORM B 4015-1 (1979) Erdbebenkräfte an nicht schwingungsanfälligen Bauwerken (Translation: Seismic forces on structures non-vulnerable to vibrations), Austrian Standards Institute, (substational revision in 1997)
-
ÖNORM B 4015-2 (1999) Belastungsannahmen im Bauwesen, Außergewöhnliche Einwirkungen, Erdbebeneinwirkungen, Berechnungsverfahren (Translation: Load assumptions in civil engineering, special loads, earthquake loads, calculation methods), Austrian Standards Institute.
-
ÖNORM B 4015 (2002, 2006) Belastungsannahmen im Bauwesen—Außergewöhnliche Einwirkungen—Erdbebeneinwirkungen, Grundlagen und Berechnungsverfahren (Translation: Load assumptions in civil engineering, special loads, earthquake loads, fundamentals and calculation methods), Austrian Standards Institute.
1.3 Bulgaria
-
Regulations for design and construction of buildings, engineering facilities in the earthquake-prone areas of Bulgaria, Ministry of Construction and Roads, 1947 (NSDC-47)
-
Regulations for design and construction of buildings and engineering facilities in the earthquake-prone areas of the People's Republic of Bulgaria, 1957 (NSDC-57)
-
Regulations for antiseismic construction, 1961 (NSDC-61)
-
Regulations for construction in earthquake-prone areas, Bulletin of Construction and Architecture N12, Ministry of Construction, 1964 (NSDC-64)
-
Norms for design of buildings and facilities in earthquake-prone areas, Normative base of design and construction, Committee on territorial and settlement construction, Bulgarian Academy of Sciences, 1987 (NSDC-87)
1.4 Cyprus
-
CCEAA (1992) Seismic Code for Reinforced Concrete Structures in Cyprus, Editor: Cyprus Civil Engineers and Architects Association. Committee for Earthquake
1.5 France
-
PS-69 (1969) Appendix to French Seismic Code
-
AFPS-90 (1990) Recommendation for the redaction of rules relative to the structures and installations built in regions prone to earthquakes, French Association for Earthquake Engineering, 1990.
1.6 Germany
-
DIN4149 (1957, 1981, 2005) Buildings in German earthquake areas—Design loads, analysis and structural design of buildings
1.7 Greece
-
Royal Decree on the Seismic Code for Building Structures (1959) Government's Gazette, Issue A, No. 36, February 19, 1959, Greece (in Greek).
-
Decree of the Minister of the Environment on the Revision of the 1959 Seismic Code for Building Structures (1984) Government's Gazette, Issue B, No. 239, April 16, 1984, Greece (in Greek).
-
New Greek seismic code: NEAK (1995) Organization of Seismic Planning and Protection, Athens (in Greek)
1.8 Hungary
-
MI-04 133-78 (1978) Technical Guiding Principles, MI-04 133-78, Magyar Szabvanyugyi Hivatal H-1450, Budapest, Hungary.
1.9 Italy
-
D.M. 16 gennaio 1996, Norme tecniche per le costruzioni in zone sismiche, G.U. 5 febbraio 1996, n. 29, s.o.
-
D.M. Infrastrutture e Trasporti 14 gennaio 2008, Norme tecniche per le costruzioni, G.U. 4 febbraio 2008, n. 2, s.o. (NTC 2008).
1.10 Iceland
-
ÍST 13 (1976, 1989). Earthquakes, loads and design rules, Reykjavík, Iðnþróunarstofun Íslands.
-
SI (2002) National Application Documents (NAD) for Iceland, Standards Council of Iceland/Staðlaráð Íslands.
-
SI (2010). Icelandic National Annexes to Eurocodes, Standards Council of Iceland/Staðlaráð Íslands.
1.11 Portugal
-
RSCCS (1958). Regulamento de segurança das construções contra os sismos, Decreto-Lei No. 41658, Lisbon, Portugal.
-
RSEP (1961). Regulamento de solicitações em edifício e pontes, Decreto-Lei No. 44041, Lisbon, Portugal.
-
REBA (1967). Regulamento de estruturas de betão armado, Decreto-Lei No. 47723, Lisbon, Portugal.
-
RSAEEP (1983). Regulamento de segurança e acções para estruturas de edifícios e pontes, Decreto-Lei No. 235/83, Lisboa, Portugal.
-
REBAP (1983). Regulamento de estruturas de betão armado e pré-esforçado, Decreto-Lei No. 235/83, Lisboa, Portugal.
-
NP EN1998-1 (2010). Eurocódigo 8: Projecto de estruturas para resistência aos sismos Parte 1: Regras gerais, acções sísmicas e regras para edifícios. Instituto Português de Qualidade.
1.12 Romania
-
1941 Ministry of Public Works and Communications, Provisory instructions for preventing building deterioration due to earthquakes and the rehabilitation of damaged buildings (in Romanian), approved through Decision nr. 84351 from 30 December 1941.
-
1945 Ministry of Communications and Public Works, Instructions for the prevention of buildings deterioration due to earthquakes (in Romanian), approved through Decision nr. 60173 from 19 May 1945.
-
STAS 2923-58 (1958) Commission of Standardisation, General prescriptions for building design in seismic regions. Seismic forces (in Romanian), not approved.
-
P13-63 (1963) State Committee for Constructions, Architecture and Systematization, Code for the Design of Civil and Industrial Buildings in Seismic Zones (in Romanian), approved through Order nr. 306 from 18 July 1963.
-
P13-70 (1970) Ministry of Industrial Construction and State Committee for Economy and Local Administration, Code for the Design of Civil and Industrial Buildings in Seismic Zones (in Romanian), approved through Order nr. 362/N from 31 December 1970.
-
P100-78 (1978) Government and Coordination Council of investment activity, Code for the seismic design of dwellings, social-cultural, agro-zootechnical and industrial buildings (in Romanian), approved through Order nr.23/IX/ from 15 June 1978.
-
P100-81 (1981) Scientific Council of the Institute for Research, Design and Regulation in Constructions, Code for the seismic design of dwellings, social-cultural, agro-zootechnical and industrial buildings (in Romanian) approved through Decision nr. 83 from 21 July 1981 of the Executive Bureau.
-
P100-91 (1991) Ministry of Public Works and Territorial Planning, Code for the seismic design of dwellings, social-cultural, agro-zootechnical and industrial buildings (in Romanian), approved through Order nr.3/N from 1 April 1991.
-
P100-92 (1992) Ministry of Public Works and Territorial Planning, Code for the seismic design of dwellings, social-cultural, agro-zootechnical and industrial buildings (in Romanian), approved through Order nr.3/N din 14 April 1992.
-
P100-1/2006 (2006) Ministry of Transport, Construction and Tourism, Seismic design code—part I: Design prescriptions for buildings (in Romanian), approved through Order nr. 1.711 from 19 September 2006.
-
P100-1/2013 (2013) Ministry of Regional Development and Public Administration, Seismic design code—part I: Design prescriptions for buildings (in Romanian), approved through Order nr. 2.465 from 08 August 2013.
1.13 Spain
-
MV 101-1962. Housing Ministry. Official State Bulletin (BOE) 35:1963/02/09, 2207–2225.
-
NCSE-94. Civil Works, Transport and Environment Ministry. Official State Bulletin (BOE) 33:1995/02/08, 3935- 3980.
-
NCSR-02. Fomento Ministry. BOE 244:2002/10/11, 35898—35967.
-
PDS-1 (1974) Part A. Development Planning Ministry. BOE 279: 1974/11/21, 23585 − 23601.
-
PGS-1 (1968) Part A. Government Presidency. BOE 30:1969/02/04, 1658–1675.
1.14 Switzerland
-
SIA 160 (1962, 1989) Actions on structures. Standard. Swiss Society of Engineers and Architects, Zurich, Switzerland.
-
SIA 261 (2003) Actions on structures. Standard. Swiss Society of Engineers and Architects, Zurich, Switzerland.
1.15 Turkey
-
Specification for Structures to be Built in Disaster Areas, Ministry of Public Works and Settlement Government of Republic of Turkey, 1944.
-
Specification for Structures to be Built in Disaster Areas, Ministry of Public Works and Settlement Government of Republic of Turkey, 1949.
-
Specification for Structures to be Built in Disaster Areas, Ministry of Public Works and Settlement Government of Republic of Turkey, 1953.
-
Specification for Structures to be Built in Disaster Areas, Ministry of Public Works and Settlement Government of Republic of Turkey, 1968.
-
Specification for Structures to be Built in Disaster Areas, Ministry of Public Works and Settlement Government of Republic of Turkey, 1975.
-
Specification for Structures to be Built in Disaster Areas, Ministry of Public Works and Settlement Government of Republic of Turkey, 1997.
1.16 Former-Yugoslavia
-
Rulebook for Loading of Structures (1948) Part 2, No. 11730, 12 July 1948-RLS2
-
Temporary Technical Provisions for Construction in Seismic Regions (1964), Official Gazette of SFRY No. 39/64
-
Technical Regulations for Construction of Buildings in Seismic Regions (1981), Official Gazette of SFRY No. 31/81, Amendments 49/82, 29/83, 21/88 and 52/90
Rights and permissions
About this article

Cite this article
Crowley, H., Despotaki, V., Silva, V. et al. Model of seismic design lateral force levels for the existing reinforced concrete European building stock. Bull Earthquake Eng 19, 2839–2865 (2021). https://doi.org/10.1007/s10518-021-01083-3
Received:
Accepted:
Published:
Issue Date:
DOI: https://doi.org/10.1007/s10518-021-01083-3