
Abstract
The manuscript provides a novel method for language identification using the texture analysis of the script. The method consists of mapping each letter from the text with certain script type. It is made according to characteristics concerning the position of the letter in the baseline area. In order to extract features, the co-occurrence matrix is computed. Then, the texture features are calculated. Extracted measures show meaningful differences due to dissimilarities in the script and language characteristics. It represents a basis in a decision-making process of the language identification. Feature classification is performed by the extension of a state-of-the-art method called genetic algorithms image clustering for document analysis. The proposed method is tested on an example of documents given in English, French, Slovenian and Serbian languages and compared to other well-known classification methods and feature representations in the state of the art. The results of experiments show the superiority of the proposed approach.
1 Introduction
1.1 Problem statements
Language identification (LI) represents the process of determining which language is given in the text. It generally represents an important preprocessing step in many specific tasks such as [1]:
-
Identification of the language or encoding of the web pages,
-
Text mining,
-
Optical character recognition (OCR),
-
Automatic speech recognition (ASR) and
-
Information retrieval (IR) systems.
The types of text documents may be scanned or electronic documents (PDF, email messages, web pages, and other electronic archives). The volume growth of digital and digitalized documents is the main reason because this process represents an important research area.
LI is a fundamental requirement prior to any language-based processing. Typically, it is an initial step in a text processing system that may involve machine translation, semantic understanding, categorization, searching, routing or storage for IR [2]. Incorrectly identifying the language results in garbled translations, faulty or no information analysis and poor precision or recall in searching [3]. Existing methods can produce reasonable results, but they usually manage large lists and matrices. Hence, they are computationally expensive [4, 5]. Furthermore, the document type defines the suitability of the applied LI method. If the document is scanned, meaning that it is given as an image, then the script recognition techniques are usually applied. On the contrary, if an electronic document is under consideration, then the language recognition techniques are used. However, script recognition techniques are typically extended in order to be used for LI.
1.2 Related work
Many methods have been proposed in order to solve the LI problem. They can be grouped as follows:
-
Word-based approach,
-
N-gram approach,
-
Markov model approach and
-
Hybrid approach.
Word-based approach uses only words up to a specific length in order to make the language model. Sometimes, it is called short word-based approach [6]. The extension of this method is based on the most frequent word’s appearance. It establishes the language model using the most frequent words only. These words represent the set of words, which has the highest frequency of appearance in the text [7].
Another technique establishes a language n-gram model [8]. N-grams are substrings, which are generated from a larger piece of text. Such a text is divided into smaller text parts, whose maximum length is n. Then, the frequency of characters’ occurrence [8] or encoded bytes [9] is counted. Such a model is compared to the known language model. The language is identified if it is similar to the already known language model. Unfortunately, this approach requires a very large piece of text for training. Furthermore, it cannot solve the LI problem if the pieces of input text are composed of various languages, which is very common on the Web.
An interesting approach is given in [10], where a letter based scoring method is used. This method can be qualified as modified n-gram method, where n is equal to 1, i.e., unigram method. It calculates letter distributions of texts. Then, letter distributions are multiplied by average letter distributions of languages obtained from training set. Classification is made according to centroid values of the algorithm, which creates the text. It is performed to identify the language of each text document.
Techniques from the next group use Markov models in combination with Bayesian decision rules [9]. They are employed to produce models for each language in the training data. It is carried out by segmenting the strings and entering them into a transition matrix, which contains the occurrence probability of all character sequences. These language models are then used to determine the likelihood of test data generated by a particular model.
Also, an hybrid approach based on the selection of system elements by several classifiers and discriminant analysis is proposed [11]. Furthermore, it is improved by using methods for the estimation of robust regularized covariance matrix oriented to under-resourced languages and by adopting stochastic methods for speech recognition tasks. Still, the method is primarily oriented toward ASR. The latter differs from the language identification techniques because it is based on the phoneme instead of grapheme research. Similar approach is given in [12].
Among the others, the extended version of script recognition techniques connected to OCR is classified as hybrid method. An efficient technique for discrimination of Bangla and English scripts in multilingual documents is given in [13]. It is based upon the analysis of connected component profiles extracted from the scanned images.
Indian documents represent a good basis for script and language differentiation due to their mixing of script and language. For such a problem, a method which introduces two evaluation parameters, i.e., average accuracy rate and model building time is proposed [14]. Then, obtained features are used for script and language discrimination by well-known classifiers. The results are promising.
One of the most universal approaches, which can be used to differentiate Latin and non-Latin scripts as well as the languages in degraded document images is proposed in [15]. It performs document vectorization, which transforms the image into a vector. The vector characterizes the shape and frequency of the contained character and word images. Then, the scripts are identified by the density and distribution of vertical runs between character strokes and a vertical scan line. Furthermore, the Latin-based languages are discriminated using a set of word shape codes, which are constructed by horizontal word runs and character extremum points.
Still, a method that combines OCR and LI approaches is proposed in [16]. It converts a document image into the character shape codes and word shape tokens. Using a natural language processing (NLP) method such as 3-gram applied to the character shape codes, it is able to discriminate 23 languages with overall accuracy >90 %.
Comprehensive examination of different LI methods is given in [17–20]. The approach in the last reference differs from the others, because it examines different LI techniques on the example of very short texts sometimes called query style texts. The results showed that Naive-Bayes classifiers perform the best in such circumstances. However, errors tend to occur within language when some text is given from the same language families.
1.3 Our approach
In this paper, we propose a novel algorithm for the language identification, which consists of the following steps: language modeling, statistical analysis of the texture, extraction of texture features, and classification of features and language discrimination. The core of the proposed approach is the original way of generating the features, which are then used for classification and language discrimination, as well as the extension of a classification technique of the state of the art which is suitable to the proposed features.
Script recognition methods extended for LI process work on scanned documents. They typically extract the features connected to OCR process, such as connected component profiles, shape of characters, density and distribution of vertical runs between character strokes and a vertical scan line. Hence, their application to electronic documents is limited.
Furthermore, NLP-based methods need a clearly identified text from document images. It means that the OCR should be performed prior to the process of language recognition. Actually, the OCR should recognize each character properly, because it is an input to the language recognition method. Hence, any degradation in the OCR process will lead to language recognition errors.
On the contrary, our approach is a universal one. Its versatility is connected with its application to either scanned or electronic documents. If we apply our method to the scanned documents, it is more robust to errors than other methods. It is mainly because it doesn’t require each character to be properly recognized. Instead, it classifies each connected component (representing a character) according to a proposed set of four elements. In this way, it maps all connected components from a scanned document into four different elements creating a mapped image with four levels of gray. Furthermore, if it is applied to an electronic document, then each letter is mapped according to its unicode value to one of the four set elements. In this way, the initial unicode electronic document is mapped into the equivalent gray-scale image with the four levels as in the case of scanned documents. As a consequence, the number of variables is considerably reduced. It leads to a computer non-intensive algorithm. Up to now, our approach is similar to the one given in [16]. But, instead of applying typical NLP procedure to extract the features such as n-gram and then to discriminate the languages, we introduce the processing of the image by texture analysis. Hence, the mapped image is subjected to texture analysis extracting the features needed for classification. In this way, we used the co-occurrence combination of the aforementioned four elements. The main point represents the neighborhood’s order of these elements creating a variety of combinations given by co-occurrence matrix with dimension 4 × 4. Accordingly, the vector of 12 co-occurrence first- and second-order features of the texture is extracted.
Then, an extension of a state-of-the-art classification tool called genetic algorithms image clustering for document analysis (GA-ICDA) is introduced to establish solid criteria for language discrimination and later identification. Considering the multiple and well-known advantages of the evolutionary strategies on the other optimization methods [21], the proposed tool uses a population-based genetic procedure as a basis for clustering, which is more robust to errors in the input than the other point-based optimization techniques [22]. In particular, it is to prefer to artificial neural networks, for which errors in the input data produce biased network parameters in the training phase. Although a robust cost function is introduced to mitigate the problem, it has not been totally solved, because the bias does not totally disappear [23]. For this reason, the application of a genetic procedure on a robust-to-noise document representation becomes of great importance in the context of scanned documents which are usually subjected to errors due to the OCR process. The new GA-ICDA clustering approach introduces three modifications, making the algorithm particularly apt to deal with language discrimination in text documents. This context is completely different from a context of pure image analysis. We do not present a new genetic clustering procedure for texture analysis optimization. Our aim consists in presenting an extension of a genetic approach previously adopted in image analysis and shows that it is able to successfully solve a language discrimination problem, as well as the utility of the introduced modifications in solving this task. Genetic algorithms have been successfully applied in many contexts of text document clustering [24–26]. Furthermore, the advantages of the genetic approach with respect to other evolutionary approaches are demonstrated from the introduction of genetic operators in particle swarm optimization (PSO) strategy for improving the clustering results of PSO [27]. On the other hand, genetic procedure has been also used to improve the global search ability of the differential evolution (DE) algorithm by introducing the crossover in DE to explore more solutions in the search space and to avoid local minima [28].
The method is tested on a training and test databases of documents written in English, French, and closely related Slovenian and Serbian languages. From all aforementioned, the proposed approach is universal, and also can be used to distinguish among a wider set of languages or very similar languages.
The remainder of the paper is organized as follows. Sections 2, 3 and 4 provide detailed information on how the language discrimination problem is solved by using texture analysis and clustering. Specifically, Sect. 2 proposes the language model established according to the text line definition. Section 3 gives the elements of the co-occurrence analysis. Section 4 explains the classification algorithm. Section 5 defines the experiment. Section 6 shows the results of the experiment and discusses them. Furthermore, the criteria for language discrimination are proposed. Section 7 makes conclusions and points out further research work direction.
2 Language model
Cryptography is a mathematically oriented part of science, which uses cryptographic algorithms to convert ordinary data into unreadable ones [29]. There exist three different types of cryptographic algorithms [30]: (1) Secret key cryptography (SKC), (2) Public key cryptography (PKC) and (3) hash functions (HF).
In the proposed approach, HF is used. It encrypts data irreversibly, which means that original data cannot be retrieved from encrypted data [31]. In our case, the decryption of the cipher text is not significant. Also, HF creates shorter output than input, which is very suitable for deeper analysis due to lower computer time consuming.
In this paper, the cryptography is used solely as a basis for modeling and analyzing documents written in English, French, Slovenian and Serbian languages. Accordingly, HF is used for converting English, French, Slovenian and Serbian documents into a cipher. Then, the cipher is subjected to the co-occurrence analysis. It shows a noticeable feature distinction between cipher obtained from English, French, Slovenian and Serbian texts. At the end, the classification tool is used for language differentiation. Figure 1 shows the flow of the algorithm.

Flow of the algorithm
The text line in the printed documents is determined by four virtual reference lines establishing three vertical zones as in Fig. 2 [32].
All letters, diacritics, ligatures or signs can be classified on behalf of aforementioned zones. Hence, Fig. 2 illustrates script characteristics according to its position in the text line.

Definition of the script characteristics: a four virtual reference lines, b three vertical zones
Accordingly, all letters are divided into four different script types: (1) short letter, (2) ascender letter, (3) descendent letter, and (4) full letter.
Taking into account the above classification, all letters from the alphabet can be replaced with the cipher. It is built in the manner like the HF, which can be given as:
Thereby, X consists of the following elements:
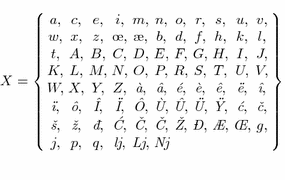
while Y is given as:
Each alphabet contains small and capital letters. English has 52 different letters, French exhibits 52 different letters with additional 28 diacritics and 4 ligatures, Slovenian contains 50 different letters and Serbian includes 60 different letters. All these elements are the members of X. Each letter occupies a certain zone(s) in text line area. Accordingly, each of them is replaced with the cipher, which is taken from the set of four counterparts given by Y [33]. The mapping is made according to Table 1. This way, original documents in English, French, Slovenian and Serbian are mapped into cipher text. Furthermore, each element in cipher, i.e., 0, 1, 2 and 3 is taken as the corresponding gray-scale level in the image. Hence, starting from the cipher text, a 1-D gray-scale image is created. This approach is very convenient because texture analysis can be applied to such an image in order to extract features. Also, the maximum number of different elements in the cipher is up to 4 [see Eq. (3)] leading to computer non-intensive texture analysis. Figure 3 illustrates the result of such mapping from cipher to an image on the example of English, French, Slovenian and Serbian documents.

Mapping and translating into 1-D image: a–d English document, e–h French document, i–l Slovenian document and m–p Serbian document
3 Texture analysis
The co-occurrence probabilities provide a second-order method for generating texture features [34]. These texture features are extracted from an image in two steps. First, the pairwise spatial co-occurrences of pixels separated by a particular angle \(\theta \) and distance d are tabulated using a gray-level co-occurrence matrix (GLCM). Second, the GLCM is used to calculate a set of scalar quantities that characterize different aspects of the underlying texture. The GLCM is a tabulation of how often different combinations of gray levels co-occur in an image or image section [34]. In this stage, it is necessary to point that in our problem, 1-D image is only considered [see Fig. 3]. It means that instead of 2-D image, we have one very long 1-D image. This 1-D image includes the information where is the end of some text row \(r_l\) and the beginning of the next text row \(r_{l+1}\). Hence, it does not represent the text row information without any connection, i.e., completely separated text lines. Accordingly, our 1-D image mimics the elements of initial 2-D image.
Gray-scale image which will be under consideration is given as I. It features M rows and N columns with a total number of grays T. The spatial relationship of gray levels in the image I is given by co-occurrence matrix (GLCM) C. GLCM C is a \(T \times T\) square matrix. To compute GLCM C, a central pixel I(x, y) with a neighborhood defined by the Window of interest (WOI) has been taken. WOI is defined by inter-pixel distance d and orientation \(\theta \). If d is equal to 1, then it means 1 pixel distance, i.e., first neighbor pixel. Furthermore, if 8-connected neighborhood is considered, then the angles \(\theta = {0^{\circ }, 45^{\circ }, 90^{\circ }, 135^{\circ }}\) are possible. For the given image I, GLCM C is defined as [35]:
where i and j are the intensity values of the image I, x and y are the spatial positions in the image I, the offset \((\Delta x, \Delta y)\) is the distance between the pixel-of-interest and its neighbor. It should be noted that offset depends on the direction \(\theta \) that is used and the distance d at which the matrix is computed. Taking into account the nature of text, the neighborhood is given as 2-connected. Accordingly, \(\theta \) is given as \({0^{\circ }}\), while d is typically used as first neighborhood, i.e., \(d = 1\). Also, T represents the number of gray levels which is given as 4. This leads to quite small dimension of GLCM, i.e. \(4\times 4\). Hence, the calculation of GLCM is not computer time intensive.
Normalized matrix P obtained from the GLCM C is calculated as [36]:
Furthermore, using Eq. (5) mean values \(\mu _x\) and \(\mu _y\) and standard deviations \(\sigma _x\) and \(\sigma _y\) (of P) are calculated as [34, 37]:
These texture semi-features will be used in forthcoming statistical analysis as well. While GLCM provides a quantitative description of a spatial pattern, it is too unwieldy for practical image analysis. A set of scalar quantities for summarizing the information contained in a GLCM is proposed in [34]. Although, a total of 14 quantities, i.e., features were originally proposed, only subsets of them are used [38]. They are the following eight GLCM-derived features of interest: (1) correlation, (2) energy, (3) entropy, (4) maximum, (5) dissimilarity, (6) contrast, (7) inverse difference moment and (8) homogeneity.
Correlation measures the linear dependency of gray levels on those of neighboring pixels. It is calculated as:
Energy measures the textural uniformity of the pixel pair repetitions. Hence, it detects disorders in textures. Energy can reach the maximum value equal to one. High energy values occur when the gray-level distribution has a constant or periodic form. Energy is defined as:
Entropy measures the disorder or complexity of an image. It reaches large values when the image is not texturally uniform or when many GLCM elements have very small values. Complex textures tend to have high entropy. Entropy is strongly, but inversely correlated to energy. Entropy is given as:
Maximum (probability) extracts the most probable difference between gray-scale values in pixels. It is calculated as:
Dissimilarity measures the variation in gray-level pairs of the image. It depends on distance from the diagonal weighted by its probability. Dissimilarity is given as:
Contrast measures the spatial frequency of an image. It is the difference between the highest and the lowest values of a contiguous set of pixels. Hence, it measures the amount of local variations present in the image. A low-contrast image presents GLCM concentration term around the principal diagonal and features low spatial frequencies. Contrast is defined as:
Inverse difference moment (Invdmoment) measures a sort of image homogeneity. Due to the weighting factor \(1/(1+(i-j)^2)\) it gets only small contributions from the areas in the image that are inhomogeneous \((i-j)\). It has a low value for inhomogeneous images, while a relatively higher value for homogeneous images. It is given as:
Homogeneity measures the image homogeneity as it assumes larger values for small gray tone differences in pair elements. It is more sensitive to the presence of near diagonal elements in the GLCM. It has maximum value when all elements in the image are the same. Its definition is given as:
GLCM contrast and homogeneity are strong, but inversely, correlated in terms of equivalent distribution in the pixel pair’s population. It means homogeneity decreases if contrast increases while energy is held constant. At the final stage, the energy and contrast are the most significant parameters in terms of visual assessment and computational load to discriminate between different textural patterns.
4 Classification
The GLCM features are used as a basis for the automatic language discrimination of documents using a classifier method. Here, we propose a new approach for the document classification in different languages which is called genetic algorithms image clustering for document analysis (GA-ICDA). This algorithm is an extension of the genetic algorithms image clustering (GA-IC) method [39] for the clustering of image databases. GA-ICDA is used for clustering the documents in different classes, each representing the language (i.e., English, French, Slovenian, Serbian) of the text inside the document. Starting from the traditional GA-IC technique, three main modifications are introduced in terms of feature representation, graph construction and cluster detection.
Differently from [39] where images are processed, here we have documents. Each document is represented as a feature vector codifying only texture content. In fact, each vector is composed of the GLCM-derived features of interest, obtained from the previously considered statistical analysis.
Similarly to [39], the document database is modeled as a weighted graph \(G = (V,E,W)\), where V are the n nodes of the graph, E are the m edges among the nodes and W are the weights associated to the edges. A single document is a graph node. In GA-IC algorithm, an edge between two nodes p and q is present only if the two corresponding images are “quite” similar to each other. Here, we extend this concept by introducing an ordering between the nodes. Consequently, an edge between two nodes p and q is allowed not only if the two corresponding documents are similar, but also if p and q are not far to each other with respect to the given ordering. The weight on the edge \(\langle p,q \rangle \) realizes the strength of the similarity between p and q.
The document graph is built in different steps. First of all, the \(L_1\) distance is computed for each pair of document feature vectors. This phase is useful to realize the distance matrix of the documents. After that, from the obtained distance values, the similarity scores are computed, like in [39]. In particular, given two documents \(\alpha \) and \(\beta \), the similarity between them is:
where \(d(\alpha ,\beta )\) is the \(L_1\) distance between \(\alpha \) and \(\beta \) and a is a local scale parameter, computed as the average \(L_1\) distance of each document to its first nearest neighbor document. For each document \(\alpha \), the similarity is evaluated only between \(\alpha \) and its k h-nearest neighbors \(nn_\alpha ^h = \{nn_\alpha ^h(1)\), \(nn_\alpha ^h(2), \ldots , nn_\alpha ^h (k)\}\), otherwise it is zero. The h-nearest neighbors of \(\alpha \) represent those documents exhibiting the h-lowest distance values from \(\alpha \) inside the distance matrix, where h is a parameter. Recall from [39] that the number k of h-nearest neighbors can be greater than h. At the end of this step, the similarity matrix for the documents is obtained. This sparse matrix represents the adjacency matrix of the document database graph. In fact, each similarity score \(w(\alpha ,\beta )\) computed between the document \(\alpha \) and its h-nearest neighbor \(\beta \) traces a weighted link between \(\alpha \) and \(\beta \).
In GA-IC, this kind of graph exhibits stronger components with dense intra-connections, representing groups of very similar images. These components are linked to each other by a small number of inter-connections. However, when the documents are the nodes of the graph, fixing a high h-neighborhood of the nodes causes the introduction of noisy edges, due to the complexity of the document representation. They are edges connecting nodes not strongly similar to each other. On the other hand, choosing an extremely low number of h-neighbors for the nodes determines the loss of the document graph components. In order to overcome this limitation, we add another criterion of neighborhood selection, derived from the concept of Matrix Bandwidth [40], to break edges linking nodes too far to each other with respect to an established node ordering.
Consider the vertex ordering induced by the graph adjacency matrix. It is a one-to-one function mapping the nodes of the graph to integers \(f:V\rightarrow \{1,2, \ldots , n\}\). Let f(v) be the label of the node \(v \in V\), where each node has been assigned to a different label. For each node \(v \in V\), we calculate the difference between f(v) and the labels \(F = \{f(nn^h_v (1))\), \(f(nn^h_v (2)), \ldots , f(nn^h_v (k))\}\) of its adjacent nodes corresponding to the k h-nearest neighbors. This difference is expressed as:
Then, for each node v, we choose to eliminate those edges between v and its adjacent nodes whose corresponding label difference is greater than or equal to a threshold value \(\varGamma \). Consequently, given two documents \(\alpha \) and \(\beta \), the element \(w_{\alpha ,\beta }\) inside the graph adjacency matrix becomes:
Thus, if the documents \(\alpha \) and \(\beta \) have a high distance \(d(\alpha ,\beta )\) to each other, the similarity score \(w_{\alpha ,\beta }\) between them will be quite low. On the contrary, if the two documents have a small distance \(d(\alpha ,\beta )\) between them, provided that they are near to each other with respect to the given node ordering (\(|f(\alpha ) - f(\beta )| < \varGamma \)), their similarity score \(w_{\alpha ,\beta }\) will be high.
Clustering of the documents is performed by finding the dense node components inside the graph with intra-edges exhibiting high similarity weight. In order to find the graph components, we adopt the genetic algorithm used in [39]. Each individual I represents a possible solution to clustering problem, which is a partition of nodes in clusters, and consists of n genes, \(\{g_1, g_2, \ldots ,g_n\}\). A gene \(g_i\) represents a node, while its value is one of the node neighbors. Initialization randomly associates to each gene \(g_i\) in I a value corresponding to one of its neighbors. Uniform crossover and mutation are used as variation operators. Let \(I_1\) and \(I_2\) be two parent individuals. Uniform crossover determines a child individual \(I_3\) by adopting a binary mask. Each gene \(g_i\) in \(I_3\) will contain the value of the corresponding gene \(g_i\) in \(I_1\) or \(I_2\), based on the binary mask value at gene position i. Given an individual I, mutation randomly selects a gene \(g_i\) from I and modifies its value with a randomly selected neighbor. The employed fitness function is the weighted modularity, based on the edge weights in G. Genetic algorithm initializes the individuals, uses the variation operators and computes the fitness function on individuals. Procedure is repeated for a fixed number of generations. At the end, the individual \(I_\mathrm{{max}}\) with the best weighted modularity, corresponding to the best partitioning of nodes in clusters, is chosen.
However, due to the complexity of the language discrimination, in order to mitigate the problem of local optima, we extend the clustering by a refinement step at the end of the genetic procedure. The clusters produced from the genetic algorithm are considered as initial clusters. Starting from these clusters, we apply a merging of cluster pairs until a fixed cluster number is reached. For each cluster \(s_i\), the distance values between \(s_i\) and the other clusters \(\{s_j\}, j=1, \ldots , d, j \ne i\) are computed, where d is the number of clusters detected from the genetic algorithm. Then, the two clusters \(s_i\) and \(s_h\) with the minimum mutual distance are merged in a single cluster. Given two clusters \(s_i =\{s_i^1, \ldots ,s_i^a\}\) and \(s_h =\{s_h^1, \ldots ,s_h^b\}\), composed of a and b number of document feature vectors, the distance \(D(s_i, s_h)\) between them is evaluated as the \(L_1\) distance between those two document feature vectors, one for each cluster, which are farthest away from each other:
where \(d(s^x_i,s^y_h)\) is the \(L_1\) norm between the two document feature vectors \(s_i^x\) and \(s_h^y\).
We run an experiment for finding the best \(\varGamma \), h and genetic parameters on the training database in the given languages English, French, Serbian and Slovenian. Because the maximum neighborhood size and label difference are limited from the size of the database, it is not possible to learn absolute values of the h and \(\varGamma \) parameters. Nonetheless, we evaluated the classification accuracy of the method at different combinations of the parameters. Results of this experiment confirm that, at a fixed value of the genetic parameters, the classification accuracy reaches the best value when \(\varGamma \) and h are in a range between \(0.15\times n\) and \(0.65\times n\), where n is the number of graph nodes, representing also the number of the documents in the database. Hence, we selected the genetic parameter values determining the best accuracy in that range. Also, we fixed h and \(\varGamma \) in that range.
4.1 Example
Figure 4 shows an example of graph construction in GA-ICDA. It is performed on a toy database composed of 8 documents: 2 out of 8 are given in Slovenian (1 and 2), 2 out of 8 in French (3 and 4), 2 out of 8 in Serbian (5 and 6) and 2 out of 8 in English languages (7 and 8). According to the aforementioned parameter tuning, the h and \(\varGamma \) parameters have been fixed to 5. Starting from the distance matrix (Fig. 4a) where the \(L_1\) distance is computed for each pair of documents, the h-nearest neighbors are computed for each document. For example, in correspondence with document 1, \(nn_1^5=\{2,3,4,5,6\}\), because they are the documents whose distance is included in the 5 lowest distance values from document 1. From the 5-nearest neighbors of each document, only the spatially closest ones with respect to \(\varGamma \) threshold are selected (Fig. 4b). For each document i, they are the only documents whose label difference with i is <5. For example, considering document 7 with 5-nearest neighbors \(nn_7^5=\{1,2,3,4,8\}\), we have that first and second neighbors are eliminated from the matrix (documents 1 and 2), because the label difference between 7 and 1 is 6 and between 7 and 2 is 5, which are greater than or equal to \(\varGamma =5\). Similarity values are computed from the distance values corresponding to remaining neighbors (Fig. 4c), determining the adjacency matrix of a document database graph G (Fig. 4d). The true division of the documents in languages is colored and clearly visible inside the adjacency matrix and in G. Also, looking at the similarity values of the adjacency matrix, it is clear that the highest values are exhibited between the documents of the same language (1 and 2, 3 and 4, 5 and 6, 7 and 8), but that also high values are present between documents in Slovenian and Serbian languages (between 5 and 1, and 5 and 2, with values of 0.27 and 0.19). It demonstrates that discrimination of these languages is in general problematic. However, the value is higher between documents 1 and 2, which are both in Slovenian language, demonstrating the efficacy of the feature representation.

Example of graph construction for a toy database of eight documents in Slovenian, French, Serbian and English languages: a h-nearest neighbors selection, b \(\varGamma \) closest neighbors selection, c adjacency matrix construction, and d corresponding weighted graph definition
Considering the graph G in Fig. 4d, one of the solutions determined from the genetic algorithm is composed of 5 document clusters, \(s_1=\{1\}\), \(s_2=\{2\}\), \(s_3=\{3,4\}\), \(s_4=\{5,6\}\), \(s_5=\{7,8\}\) (Fig. 4d). It is clear that it is not the correct solution, because Slovenian documents are split into two different clusters \(s_1\) and \(s_2\). Consequently, the merging procedure is applied on the found solution to determine the final solution of the correct 4 clusters. Table 2 reports the distance values \(D(s_i, s_h)\) \(i,h=1, \ldots , 5\), computed for each cluster pair. For example, considering clusters \(s_3\) and \(s_4\), the distance \(D(s_3,s_4)\) is computed by considering all the distance values between 3 and 5,6 and between 4 and 5,6 inside the original distance matrix (Fig. 4a). The final value is 3.21, because it corresponds to the distance between the two documents 3 and 6 which are the farthest away to each other. In Table 2, we observe that the minimum distance value is 0.13 (highlighted in bold) in correspondence of \(s_1\) and \(s_2\). Consequently, they are merged in a single cluster including documents 1 and 2. Because the number of new obtained clusters is 4, the algorithm is terminated. The final clustering solution corresponds to the correct division of the documents in languages.
Figure 5 shows the graph construction when not all the documents are located consecutively in the distance matrix. It is performed on the same toy database composed of 2 Slovenian documents (1 and 4), 2 French documents (2 and 5), 2 Serbian documents (3 and 6) and 2 English documents (7 and 8). Figure 5a shows the obtained adjacency matrix derived from thresholding of the distance matrix by h-nearest neighborhood with h = 5 and by fixing the \(\varGamma \) parameter equal to 5, and by detecting the similarity values from the corresponding distance values. The true division of the documents in language classes is colored and visible inside the matrix. It is worth to observe that also in this case, the documents given in the same languages exhibit the highest similarity and that discrimination between Serbian and Slovenian languages is critical one. Hence, the adjacency matrix maintains the same properties as in the case of consecutive documents. Figure 5b illustrates the corresponding graph. In this case, the genetic algorithm determines the correct 4 clusters of documents, \(s_1=\{1,4\}\), \(s_2=\{2,5\}\), \(s_3=\{3,6\}\), \(s_4=\{7,8\}\). Consequently, the merging procedure will return this same solution of the 4 clusters.

Example of graph construction for a toy database of 8 documents in Slovenian, French, Serbian and English languages, when documents are not located consecutively in the distance matrix: a adjacency matrix construction and b corresponding weighted graph definition
5 Experiments
To test the proposed approach, the experiment is conducted on two custom-oriented databases of documents given in French, English, Slovenian and Serbian languages, extracted mainly from the web. Only few of them are printed and then scanned. French documents are extracted from Le Point Paris Match [41]. Furthermore, a part of English, Slovenian and Serbian documents are obtained from the web as well. However, for a few documents in different languages we give the equivalent translated ones. In this way, the database consists of original documents in different languages as well as the equivalent documents obtained from computer translator and also few scanned documents.
The first database consists of 85 documents, where 18 out of 85 are English documents, 10 are French documents, 32 and 25 are Serbian and Slovenian documents, respectively. English documents count from 600 to 3200 characters, while French documents consist from 800 to 4000 characters. Slovenian documents include from 600 to 3600 characters, while Serbian documents have from 600 to 3800 characters. It should be noted that Slovenian and Serbian languages are so-called closely related ones, which means that their discrimination is problematic. Furthermore, the co-occurrence analysis is sensitive to the low number of samples, which in our case represent characters. Hence, the documents of more than 500 characters can be used as an adequate means for valid statistical analysis, which is a premise of the factor analysis [42–44].
Then, the effectiveness of the proposed language identification tool is evaluated on the test database. It consists of 9 English documents, 3 French documents, and respectively, 6 and 5 Serbian and Slovenian documents, for a total of 23 documents. The documents count from 500 to 1000 characters.
6 Results evaluation
6.1 Analysis of the feature values and their discriminant capability
The results of the experiment that includes the four GLCM semi-features obtained from the database are given in Table 3.
Figure 6 illustrates the values of four GLCM semi-features: \(\mu _x\), \(\mu _y\), \(\sigma _x\), and \(\sigma _y\), according to their maximum, minimum and mean values.

Four GLCM semi-features for English, French, Serbian and Slovenian documents obtained from the database: a \(\mu _x\), b \(\mu _y\), c \(\sigma _x\), and d \(\sigma _y\)
Interpreting the results of four GLCM semi-features \(\mu _x\), \(\mu _y\), \(\sigma _x\), and \(\sigma _y\), it is easy to distinguish Slavic (Slovenian and Serbian) from non-Slavic languages (English and French). Furthermore, English and French show diversity in these features as well, which simplify their separation. However, closely related languages such as Serbian and Slovenian are characterized with overlapped GLCM semi-features. This leads to more complex process of differentiation.
Table 4 gives the results for eight GLCM full-features obtained from the database.
Figures 7 and 8 present eight GLCM full-features: energy, entropy, maximum (maxi), dissimilarity, contrast, inverse difference moment (invdmoment), homogeneity and correlation, according to their maximum, minimum and mean values.

Four out of eight GLCM features for English, French, Serbian and Slovenian documents obtained from the database: a energy, b entropy, c maximum, and d dissimilarity

Four out of eight GLCM features for English, French, Serbian and Slovenian documents obtained from the database: a contrast, b inverse difference moment, c homogeneity, and d correlation
The values of eight full GLCM features obtained from the database are commonly overlapped between languages. However, there exists some exception. In this way, the acquired results from French documents can be distinguished by diverse energy, entropy and maxi values. Furthermore, the Slovenian and Serbian languages can be easily separated from other languages by dissimilarity, inverse difference moment, contrast and correlation. However, closely related languages such as Serbian and Slovenian are very difficult to distinguish without the strong classification algorithm.
Table 5 shows the maximum dispersion of four GLCM semi-features obtained from the database. The French is characterized by the smallest average dispersion of four GLCM semi-features.
Table 6 shows the maximum dispersion of eight GLCM full-features obtained from the database. Again, French language is characterized by the smallest average dispersion of eight GLCM full-features.
The results of the experiment showing the values of four GLCM semi-features obtained from the test database are given in Table 7.
Similarly as in the database, it is easy to disseminate Slavic (Slovenian and Serbian) from non-Slavic languages (English and French) using the four GLCM semi-features \(\mu _x\), \(\mu _y\), \(\sigma _x\), and \(\sigma _y\). Furthermore, English and French can be easily distinguished by these measures. In contrast, closely related languages such as Serbian and Slovenian are characterized with slight overlapping GLCM semi-features. These results are similar to those previously obtained by the database.
Table 8 gives the results for eight GLCM full-features obtained from the test database.
The values of eight full GLCM features obtained from the test database show that tested languages cannot be easily discriminated. However, there exist measures that easily distinguish one language from others. Accordingly, all languages can be discriminated by energy values. Furthermore, Slavic languages can be separated from others by energy, entropy, maximum, dissimilarity, contrast and inverse difference moment values. French language can be distinguished from English one by energy, entropy and maximum values. Documents written in Slovenian are characterized by slightly lower values of energy than Serbian text. Nonetheless, closely related languages such as Serbian and Slovenian have values that are mainly overlapping. Hence, they are difficult to be distinguished without the strong classification algorithm.
Table 9 shows the maximum dispersion of four GLCM semi-features obtained from the test database.
Again, French is characterized by the smallest average dispersion of GLCM semi-features.
Table 10 shows the maximum dispersion of eight GLCM full-features obtained from the test database. Currently, Serbian language is characterized by the smallest average dispersion of eight GLCM full-features followed by the French language.
Taking into account all aforementioned, it is clear that the language differentiation is a challenging task. Hence, it is very difficult to establish a linear discrimination to separate each of them like in the script recognition [45]. It is even more complex if closely related languages are considered. Consequently, another experiment has been performed on the database by using the strong classification algorithm GA-ICDA.
6.2 Language identification results
In order to evaluate the classification performances, we use the traditional precision/recall and the normalized mutual information (NMI) measures. Precision, recall and f-measure are obtained from the confusion matrix CM representing the documents correctly or incorrectly classified in the different languages. In our case, the rows of the confusion matrix are the ground-truth languages, while the columns are the clusters found from the classification procedure. Each element CM(i, j) inside the confusion matrix represents the number of documents of predicted class j appearing in the true language class i. Precision for a given ground language class i is the fraction of documents correctly classified as i (of language i) to the total number of retrieved documents in the predicted class j corresponding to i. Recall for a given ground language class i is the fraction of documents correctly classified as i (of language i) to the total number of relevant documents of class i. F-measure is the harmonic mean of precision and recall.
In the case of clustering algorithms, the correspondence between the found clusters and the true language classes is not known a priori. In order to identify which language corresponds to each cluster, we consider the confusion matrix CM. In the multi-class CM, each predicted class (cluster) j corresponds to the language class i sharing the maximum possible number of documents with it. Accordingly, the assignment of clusters to language classes is based on the Hungarian algorithm, which is a technique to be adoptable for optimal assignment of the clusters to the ground-truth classes in the CM [46].
The normalized mutual information (NMI) is an information-theoretic measure adopted for the clustering evaluation [47]. Specifically, let \(O = \{o_1\), \(o_2, \ldots , o_k\}\) and \(D = \{d_1\), \(d_2, \ldots ,d_j\}\) be, respectively, the k clusters found from the algorithm and the j ground-truth language classes of documents. The NMI is defined as:
where I is the mutual information and H is the entropy.
The mutual information I(O; D) is expressed as:
where \(|o_k\cap d_j|\) is the number of documents of language class \(d_j\) appearing in the cluster \(o_k\), N is the total number of documents, \(|o_k|\) and \(|d_j|\) are, respectively, the number of documents inside the cluster \(o_k\) and inside the true language class \(d_j\).
Entropy is computed as:
H(D) is computed analogously for D.
The mutual information I expresses the amount of information given from the found clusters useful to derive the membership of the documents in the true language classes. The minimum value of the mutual information I is obtained when the computed document clustering \(\underline{O}\) is random compared with the true partitioning D of documents in languages. The maximum value of I is realized when the computed document clustering \(\underline{\underline{O}}\) is able to exactly reproduce the true language classes D. The normalized mutual information is a normalized version of I. and it is always bounded between 0 (minimum similarity between O and D) and 1 (maximum similarity between O and D).
In order to evaluate the superiority of the proposed framework for language classification, its results are compared with the results of other six unsupervised classifiers, well known in literature, adopted in some contexts for document classification and retrieval [48–52]. They are: k-means, complete linkage hierarchical clustering, DBSCAN [53], self-organizing map (SOM), Gaussian mixture models using expectation maximization (GMMs) and the clustering algorithm based on local search introduced in [54]. To demonstrate the significance and the utility of the modifications introduced in GA-ICDA, a comparison is also made with the GA-IC base approach. In terms of feature representation, a comparison is made between the proposed features and language n-gram model. In particular, the bi-gram frequency vectors are adopted as feature representation of the documents [55]. Hence, all the clustering algorithms are executed on the database of documents represented by the proposed feature vectors (see Table 11) and by the bi-gram frequency vectors (see Table 13). Then, we evaluate and analyze the best combination of feature representation and clustering approach.
For the competitor algorithms, a trial and error approach has been employed on the database for parameter tuning. The values of the parameters giving the best possible accuracy results on the database have been applied for clustering. This means that we perform a number of trials by considering different combinations of the parameter values and choose that combination determining the best possible solution [56]. Consequently, in k-means algorithm, the cluster number is fixed to 4, which is exactly the language number. In SOM algorithm, the dimension of a neuron layer is \(1 \times 4\), the number of training steps for initial covering of the input space is 100 and the initial size of the neighborhood is 3. The distance between two neurons is calculated as the number of steps from each other. Hierarchical clustering employs a bottom-up agglomerative strategy using \(L_1\) norm for distance computation. Complete linkage is used for cluster distance evaluation, in order to be compliant with the bottom-up strategy of GA-ICDA. The obtained dendrogram is “horizontally” cut to give a cluster number which is equal to 4. In GMMs, the cluster number is also fixed to 4. In DBSCAN, the \(\epsilon \) distance value is fixed to 20 and the minimum number of points for the \(\epsilon \)-neighborhood is fixed to 1.5. In local search algorithm, the parameters are automatically tuned from the algorithm, based on data [54]. According to the parameter setting described in Sect. 4, the h value of the neighborhood and the \(\varGamma \) threshold value of GA-ICDA have been learned from the database to be equal to 15. Also, the same h parameter value has been fixed for GA-IC. Again, we fix population size equal to 700, number of generations equal to 200, probability of mutation equal to 0.7 and probability of crossover equal to 1. Furthermore, we choose elite reproduction equal to 10 % of the population size and roulette selection function. The learned parameter values have been adopted for the test database.
Because some of the proposed clustering algorithms can obtain different solutions for different runs on the same database, they have been run 50 times on the database and on the test database and the average values of precision, recall, f-measure and NMI have been computed for each language class. Average NMI is an overall measure of similarity; consequently, it is reported separately from the single language classes. Standard deviation is reported in parenthesis.
Table 11 shows the results of the experiment when the documents of the database are represented by the proposed GLCM texture features. They are two (instead of four) semi-features (\(\mu _x\), \(\sigma _x\)) and eight full texture features (correlation, energy, entropy, maximum, dissimilarity, contrast, inverse difference moment and homogeneity). The semi-features \(\mu _y\) and \(\sigma _y\) are not considered for classification in this case. In fact, from the previous feature analysis, it is visible that they are correlated to \(\mu _x\) and \(\sigma _x\). It is worth to note that GA-ICDA is able to obtain the perfect identification of the languages in the database, while the other methods perform poorly. This means that the algorithm is able to partition the documents, perfectly recognizing the language of the document text. The obtained standard deviation is 0: It demonstrates the stability of our result. In fact, each time the algorithm is run, the genetic procedure obtains a solution which is corrected by the bottom-up final procedure. In this way, standard deviation is 0 because, in all the 50 runs, the genetic procedure finds a sub-optimal solution but the bottom-up strategy performs successfully. Also, GA-IC base approach is not able to well discriminate among documents written in different languages, obtaining very poor results with respect to the modified GA-ICDA approach.
Table 12 shows the results of the experiment when the documents of the database are represented by the bi-gram frequency vectors. Although the local search, GA-IC and hierarchical clustering perfectly identify the English and French languages, they are not able to correctly differentiate the Serbian and Slovenian languages. Also, GA-ICDA is able to correctly identify the Slovenian language, while it obtains f-measure values of around 0.60–0.70 for the other languages. It is mainly because GA-ICDA method is customized for the proposed feature representation. Finally, the other clustering algorithms perform poorly. It is worth to observe that the best combination is the proposed feature representation together with the GA-ICDA clustering method. It is followed by the bi-gram frequency vectors representation together with the local search algorithm. However, the proposed framework is the only combination which is able to perfectly discriminate the 4 languages.
The adopted dataset is quite complex in terms of document typology. Consequently, we expect to perform successfully also in other contexts of classification for these languages. Accordingly, we run the proposed language identification tool on the test database given in the same languages English, French, Serbian and Slovenian. Results of the experiment are reported in Table 13. Also in this case, we obtain the perfect discrimination of the languages, which is a very promising result. Finally, the goodness of the classification process confirms the validity of the document feature representation, which is totally new in the literature.
At the end, a brief comparison between proposed and other LI techniques will be made. First, we shall compare our method with the so-called hybrid method connected to OCR process. One type of these techniques deals with discrimination between Indian and English script, i.e., languages. It is based on different typographical features of aforementioned scripts. The best result of 0.989 for recall, precision and f-measure is obtained in [14]. Similarly, the connected component profiles as a basic feature to discriminate Bangla and English scripts are extracted in [13]. This method correctly recognized around 95 % of script documents. Furthermore, an approach that discriminates between Latin and non-Latin documents is proposed in [15]. Its complex procedure receives an average accuracy of 95 %. However, it is suitable for scanned documents only. In contrast, a new technique introduces character code shapes which can be used not only to scan documents as previous methods, but also with some modification to electronic documents [16]. The method experiments on 23 Latin-based languages. It receives an overall accuracy between 80 and 93 %. Its weakness represents the NLP approach to classification based on 3-gram method. Secondly, comparison will be made to so-called NLP-based methods incorporating word based, n-gram approach and Markov model approach. A technique that uses 1-gram approach has been proved to be efficient [10]. It receives an accuracy between 93 and 100 %. Still, it is usable only if the language is known and used in training procedure. The exploration of LI on the example of small texts is given in [20]. It receives up to 99.44 % success in headlines and 81.61 % in dictionaries using 5-gram method and Naive-Bayes classifier. Furthermore, a comparative study of different techniques for the LI is given in [17]. The success rate is between 79.2 and 99.2 % on a sample of 135 documents. Still, the combination of the methods could slightly improve the correctness of the results. Our method with a success rate of 100 % on 2 samples of, respectively, 85 (training set) and 23 (test set) documents has proven its advantage. Furthermore, it is computer time non-intensive and robust to errors in writing and typos as well. The efficiency of the language discrimination depends also from the execution time of the adopted GA-ICDA method. It takes 40 seconds on the database of 85 documents, on a desktop computer quad core at 2.6 GHz, 8 GB RAM and Windows 7 operating system. In the cases of mistyping text, the other techniques are error prone. The proposed algorithm does not need even the correct OCR preprocessing and recognition, which is mandatory to any other LI technique. But, the most important advantage of our method represents its versatility, i.e., suitability to be used for scanned and electronic documents. Also, it can be extended for wider language corpora. From all aforementioned, our approach is promising especially in the cases of closely related languages or variations of the same language.
7 Conclusions
The manuscript proposed a novel approach for identification of languages in document samples according to texture analysis of the coded document established according to the text line structure definition. The analysis of four and eight full texture features shows a diversity in documents written in different languages. However, a strong classification tool such as GA-ICDA is mandatory for successful identification of a certain language. The proposed algorithm is tested on two custom-oriented databases, which include documents given in French, English, Slovenian and Serbian languages. The obtained results show full distinction between documents written in different languages. These results are very promising. Hence, the proposed algorithm is suitable for the language recognition on the Web or incorporation in OCR system and can be extended for wider language corpora.
Further research direction will be toward the application of the proposed algorithm to much wider document database incorporating closely related languages. Also, the combination of different texture techniques such as co-occurrence and run-length texture analysis will be included in the process of the language evaluation.
Again, comparison of our language discrimination tool with the competitor algorithms will be further enriched by automatizing the parameter selection process. In the case of k-means, an intelligent variant called ik-means [57] will automatically find the suitable number of clusters by detecting anomalous patterns. In the hierarchical clustering, the L method [58] will determine the optimal number of clusters by finding the “knee” point in a graph depicting the clustering evaluation function in dependence of the clusters number. In the case of DBSCAN, binary differential evolution [59] will automatically find the suitable Eps and MinPts parameter values. Again, the parameterless PLSOM [60] will be employed instead of the traditional SOM, where the selection of the learning and annealing rates and of the neighborhood size are completely eliminated. In the GMMs, employing the self-adaptive differential evolution together with the EM algorithm [61] will eliminate the problem of choosing initial mixture parameters.
Finally, an optimized version of the framework source code in C programming language will be officially provided for encouraging the community to evaluate the performances of our technique and to favor comparisons with other existing methods.
Abbreviations
- ASR:
-
Automatic speech recognition
- CM:
-
Confusion matrix
- DE:
-
Differential evolution
- GA-IC:
-
Genetic algorithms image clustering
- GA-ICDA:
-
Genetic algorithms image clustering for document analysis
- GLCM:
-
Gray-level co-occurrence matrix
- GMM:
-
Gaussian mixture model
- HF:
-
Hash function
- IR:
-
Information retrieval
- LI:
-
Language identification
- NLP:
-
Natural language processing
- NMI:
-
Normalized mutual information
- OCR:
-
Optical character recognition
- PDF:
-
Portable document format
- PKC:
-
Public key cryptography
- PSO:
-
Particle swarm optimization
- SKC:
-
Secret key cryptography
- SOM:
-
Self-organizing map
- WOI:
-
Window of interest
References
Kranig S (2006) Evaluation of language identification methods. In: Proceedings of ACM SAC
Chowdhury GG (2003) Natural language processing. Annu Rev Inf Sci Technol 37(1):51–89
Lewandowski D (2008) Problems with the use of web search engines to find results in foreign languages. Online Inf Rev 32(5):668–672
Jin H, Wong KF (2002) A Chinese dictionary construction algorithm for information retrieval. ACM Trans Asian Lang Inf Process 1(4):281–296
Botha G, Zimu V, Barnard E (2006) Text-based language identification for the South African languages. In; Proceedings of the 17th annual symposium of the pattern recognition association of South Africa. Parys, South Africa, pp 7–13
Grothe L, De Luca EW, Nürnberger A (2008) A comparative study on language identification Methods. In: Proceedings of the sixth international conference on language resources and evaluation (LREC), 28–30 May. Marrakech, Morocco, pp 980–985
Jurafsky D, Martin JH (2009) Speech and language processing, 2nd edn. Pearson-Prentice Hall, Upper Saddle River
Roark B, Saraclar M, Collins M (2007) Discriminative n-gram language modeling. Comput Speech Lang 21(2):373–392
Goodman J (2006) A bit of progress in language modeling: extended version. Technical report MSR-TR-2001-72, Machine Learning and Applied Statistics Group, Microsoft Research, Redmond, WA
Takci H, Sogukpimar I (2005) Letter based text scoring method for language identification. In: Yakhno T (ed) Advances in information systems, lecture notes in computer science 3261. Springer, New York, pp 283–290
Barroso N, Lopez de Ipina K, Grana M, Ezeiza A (2011) Language identification for under-resourced languages in the basque context. In: Corchado E et al (eds) Advances in intelligent and soft computing, vol 87. Springer, New York, pp 475–483
http://www.doc.ic.ac.uk/~nd/surprise_96/journal/vol4/gac1/report.html
Zhou L, Lu Y, Tan CL (2006) Bangla/English script identification based on analysis of connected component profiles. In: Bunke H, Spitz AL (eds) Document analysis systems VII, lecture notes in computer science 3872. Springer, New York, pp 243–254
SkMd Obaidullah, Mondal A, Das N, Roy K (2014) Script identification from printed indian document images and performance evaluation using different classifiers. Appl Comput Intell Soft Comput 896128:1–12
Lu S, Tan CL, Huang W (2006) Bangla/English script identification based on analysis of connected component profiles. In: Bunke H, Spitz AL (eds) Document analysis systems VII, lecture notes in computer science 3872. Springer, New York, pp 232–242
Sibun P, Spitz AL (1994) Language determination: natural language processing from scanned document images. In: 4th applied natural language processing conference (ANLP). pp 15–21
Grothe L, De Luca EW, Nürnberger A (2008) A comparative study on language identification methods. In: Proceedings of the sixth international language resources and evaluation (LREC). Marrakech, Marocco, pp 980–985
Kranig S (2011) Evaluation of language identification methods. B.S. Thesis, University of Tubingen International Studies in Computational Linguistics, Tubingen
Do HV (2010) Natural language identification for OCR applications. B.S. Thesis, Freie Universität Berlin, Department of Mathematics and Computer Science, Berlin
Gottron T, Lipka N (2010) A comparison of language identification approaches on short, query-style texts. In: Gurrin C et al (eds) Advances in information retrieval, lecture notes in computer science 5993. Springer, New York, pp 611–614
Fogel DB (1997) The advantages of evolutionary computation. In: Proceedings of biocomputing and emergent computation BCEC97. World Scientific Press, pp 1–11
Arnold DV, Beyer HG (2002) Local performance of the (1 + 1)-ES in a noisy environment. IEEE Trans Evolut Comput 6(1):30–41
Van Gorp J, Schoukens J, Pintelon R (2000) Learning neural networks with noisy inputs using the errors-in-variables approach. IEEE Trans Neural Netw. 11(2):14–402
Liu C, Lu C, Lee W (2000) Document categorisation by genetic algorithms. In: Proceedings IEEE international conference on systems, man, and cybernetics, 08–11 October. IEEE CS Press, Nashville, TN, 5:3868-3872
Jian-Xiang W, Huai L, Yue-hong S, Xin-Ning S (2009) Application of genetic algorithm in document clustering. In: Proceedings IEEE international conference on information technology and computer science ITCS, 25–26 July. IEEE CS Press, Kiev, pp 145–148
Akter R, Chung Y (2013) An evolutionary approach for document clustering. IERI Proc 4:370–375
Abdel-Kader RF (2010) Genetically improved PSO algorithm for efficient data clustering. In: Proceedings second international conference on machine learning and computing (ICMLC), 9–11 February. IEEE CS Press, Bangalore, pp 71–75
Ali AF (2014) A novel hybrid genetic differential evolution algorithm for constrained optimization problems. (IJACSA) Int J Adv Comput Sci Appl 3(6):7–12
Hoffstein J, Pipher J, Silverman JH (2008) An introduction to mathematical cryptography. Springer, New York
Paar C, Pelzl J (2009) Hash functions, chapter 11 of understanding cryptography. A textbook for students and practitioners, Springer, New York
Yaksic VOC (2003) A study on hash functions for cryptography, global information assurrance certification paper, SANS Institute
Zramdini AW, Ingold R (1998) Optical font recognition using typographical features. IEEE Trans Pattern Anal 20(8):877–882
Brodić D, Milivojević ZN, Maluckov ČA (2013) Recognition of the script in Serbian documents using frequency occurrence and co-occurrence analysis. Sci World J 896328:1–14
Haralick RM, Shanmugan K, Dinstein I (1973) Textural features for image classification. IEEE Trans Syst Man Cybern 3(6):610–621
Eleyan A, Demirel H (2011) Co-occurrence matrix and its statistical features as a new approach for face recognition. Turk J Electr Eng Comput sci 19(1):97–107
Clausi DA (2002) An analysis of co-occurrence texture statistics as a function of grey level quantization. Can J Remote Sens 28(1):45–62
Conners RW, Trivedi MM, Harlow CA (1984) Segmentation of a high-resolution urban scene using texture operators. Comput Vis Gr Image Process 25:273–310
Newsam SD, Kamath C (2004) Retrieval using texture features in high resolution multi-spectral satellite imagery. In: SPIE conference on data mining and knowledge discovery: theory, tools, and technology VI
Amelio A, Pizzuti C (2014) A New evolutionary-based clustering framework for image databases. In: Elmoataz A et al (eds) Image and signal processing, lecture notes in computer science 8509. Springer, New York, pp 322–331
Marti R, Campos V, Laguna M, Glover F (2001) Reducing the bandwidth of a sparse matrix with tabu search. Eur J Oper Res 135(2):450–459
Comrey AL, Lee HB (1992) A first course in factor analysis. Psychology Press, Hillsdale
Cattell RB (1978) The scientific use of factor analysis in behavioral and life sciences. Plenum, New York
MacCallum RC, Widaman KF, Zhang S, Hong S (1999) Sample size in factor analysis. Psychol Methods 4(1):84–99
Brodić D, Milivojević ZN, Maluckov ČA (2015) An approach to the script discrimination in the Slavic documents. Soft Comput 19(9):2655–2665
Shrestha P, Jacquin C, Daille B (2012) Clustering short text and its evaluation. In: Proceedings of the 13th international conference, CICLing, March 11–17. Springer, New Delhi, India, LNCS 7182, pp 169–180
Manning CD, Raghavan P, Schütze H (2009) Introduction to information retrieval, Online edn. Cambridge University Press, Cambridge
Diem M, Kleber F, Fiel S, Sablatnig R (2013) Semi-automated document image clustering and retrieval. In: Proceedings SPIE, 9021, 0210M-90210M-10
Yuyu Y, Xu W, Yueming L (2013) A Hierarchical Method for Clustering Binary Text Image. In: Yuyu Y et al (eds) Trustworthy computing and services, CCIS 320. Springer, New York, pp 388–396
Weizhong Z, Qing H, Huifang M, Zhongzhi S (2012) Effective semi-supervised document clustering via active learning with instance-level constraints. Knowl Inf Syst 30(3):569–587
Marinai S, Marino E, Soda G (2008) Self-organizing maps for clustering in document image analysis. In: Simone M, Hiromichi F (eds) Machine learning in document analysis and recognition, studies in computational intelligence 90. Springer, New York, pp 193–219
Huaigu C (2008) Indexing and retrieval of low quality handwritten documents. Ph.D. Dissertation. State University of New York at Buffalo, Buffalo
Ester M, Kriegel H, Sander J, Xu X (1996) A density-based algorithm for discovering clusters in large spatial databases with noise. In: Proceedings of the second international conference on knowledge discovery and data mining (KDD-96). AAAI Press, pp 226–231
Zelnik-Manor L, Perona P (2004) Self-tuning spectral clustering. Adv Neur Inf 17:1601–1608
Turney PD, Pantel P (2010) From frequency to meaning: vector space models of semantics. J Artif Intell Res 37(1):141–188
Fodor JD, Sakas WG (2004) Evaluating models of parameter setting. in: Proceedings of the 28th annual Boston University conference on language development, October 31–November 2, Boston, MA
Chiang MM, Mirkin B (2010) Intelligent choice of the number of clusters in k-means clustering: an experimental study with different cluster spreads. J Classif 27(1):3–40
Salvador S, Chan P (2004) Determining the number of clusters/segments in hierarchical clustering/segmentation algorithms. In: Proceedings of the 16th IEEE international conference on tools with artificial intelligence, ICTAI. pp 576–584
Karami A, Johansson R (2014) Choosing DBSCAN parameters automatically using differential evolution. Int J Comput Appl 91(7):1–11
Berglund E, Sitte J (2006) The parameterless self-organizing map algorithm. IEEE Trans Neural Netw 17(2):305–316
Kwedlo W (2014) Estimation of parameters of Gaussian mixture models by a hybrid method combining a self-adaptive differential evolution with the EM algorithm. Adv Comput Sci Res 11:109–123
Acknowledgments
This study was partially funded by the Grant of the Ministry of Education, Science and Technological Development of the Republic of Serbia, as a part of the Project TR33037 within the framework of Technological development program. The receiver of the funding is Dr. Darko Brodić.
Author information
Authors and Affiliations
Corresponding author
Ethics declarations
Conflict of interest
The authors declare that they have no conflict of interest.
Ethical approval
This article does not contain any studies with human participants or animals performed by any of the authors.
Rights and permissions
About this article

Cite this article
Brodić, D., Amelio, A. & Milivojević, Z.N. Language discrimination by texture analysis of the image corresponding to the text. Neural Comput & Applic 29, 151–172 (2018). https://doi.org/10.1007/s00521-016-2527-x
Received:
Accepted:
Published:
Issue Date:
DOI: https://doi.org/10.1007/s00521-016-2527-x