
Abstract
This study is an attempt to find out the factors responsible for sudden dengue outbreak in different cities of Pakistan during 2011. For this purpose, spatio-temporal distribution of dengue in Islamabad, Rawalpindi, Lahore, and Karachi has been taken into account. According to the available data, the factors responsible for this spread includes climate covariates like rainfall, temperature, and wind speed; social covariates like population, and area of locality, and environmental risk factors like drainage pattern and geo-hydrological conditions. Reported dengue cases from localities and Shuttle Radar Topography Mission (SRTM) 90 m digital elevation model (DEM) of study areas have been processed for hotspots, regression model and stream density in the localities of high dengue incidence. The relationship of daily dengue incidence with climate covariates during the months of July–October of the study year is analyzed. Results show that each dry spell of 2–4 days provides suitable conditions for the development and survival of dengue vectors during the wet months of July and August in the areas of high stream density and population. Very few cases have been reported in July while higher number of cases reported in the months of August, September, until late October. Hotspot analysis highlights the areas of high dengue incidence while regression analysis shows the relationship between the population and the areas of localities with the dengue incidence.
Introduction
According to the available information, the variability of weather phenomena is considered as a major indicator of the increased occurrence of dengue cases. The association of dengue incidence with monthly temperature deviations is observed prominently affecting at a time lag of around 2 months (Wu et al. 2007). Thickly populated and unplanned urban development provide suitable areas called hotspots for the dengue vector growth because Aedes aegypti is well adapted to these environments and is highly anthropophilic (WHO 2009; Cox et al. 2007). Favorable environmental conditions for the development of dengue mosquitos play an important role in transmitting this disease (Favier et al. 2005). Different elements of dengue transmission dynamics are dependent on climatological factors that include the development and survival of the vectors (Jetten and Focks 1997). The survival period of these vectors is shorter in warmer and colder temperatures, though both the parasites and mosquitoes can only survive within a suitable range of ambient temperatures (Smith et al. 2013; Yang et al. 2009). Yang et al. (2009) has indicated the temperature range of 15–30 °C for the mosquito survival and there is no oviposition, gonadotrophic cycle, or development of immature forms to adults beyond this range. Variations in rainfall and temperature have been correlated with the dengue infections and there found a higher number of cases associated with temperature and rainfall possibly due to the resulting increase in breeding sites, vector biting activity, the probability of vector to human transmission per bite, virus incubation period, and life expectancy of mosquitoes (Chowell and Sanchez 2006; Favier et al. 2005; Liu-Helmersson et al. 2014). The tolerances and requirements of the breeding habitats are significant while considering the role of hydrological processes on their distribution and density (Chowell and Sanchez 2006).
After the first reported case of dengue in 1994 from Karachi (Chan et al. 1994), this disease has been the part of different studies in various perspectives but the impact of spatio-temporal factors of dengue dynamics is still lacking in Pakistan. For this purpose, the present study is conducted in four different cities (Islamabad, Rawalpindi, Lahore, and Karachi) to address the dengue spread based on environmental factors including climate and social covariates. The environmental and social risk factors that play their role in the dengue transmission are temperature, precipitation, geography, human population, drainage density, and urban residential areas (Wu et al. 2007; Guerra et al. 2006; Gubler 2002; Cox et al. 2007). This study is an attempt to correlate the social and climatic factors considering them environmental risk factors to monitor the impacts on dengue spread and sudden outbreak of this disease during the study period (i.e., 2011).
Based on the available information of dengue for the years 2007–2012, Pakistan remained vulnerable to dengue fever spread during the last decade (Halstead 2008; Fatima et al. 2011; World Health Organization 2012). Dengue continued to occur in different cities of Pakistan in successive years but the year 2011 remained highly vulnerable, as highest number of dengue cases were reported from all over the country causing several mortalities and morbidities (Khalid and Ghaffar 2015). The micro level analysis of dengue occurrence is particularly important to know the behavior of environmental covariates at local level because they contribute enormously in the disease spread. Thus, spatial and temporal distribution, behavior of climate and social covariates toward the spread of this disease at the micro level is urgently required to indicate the high disease prone areas in these cities. Although dengue is a significant vector-borne disease in Pakistan, the published data is inadequate to address the local situation at micro level regarding the outbreak patterns to create awareness and to address its control strategies (Humayoun et al. 2010). Moreover, it is more important to study the societal and environmental phenomena in order to design a rational strategy to mitigate the negative impacts of this deadly disease (Wolff 2002; Knap et al. 2002).
A positive correlation has been found between the dengue transmission and high human population density in Pakistan (Khalid and Ghaffar 2015). The geographic variations in the intensity of transmission have been observed all over the globe at all scales (Guerra et al. 2006). In the early twentieth century, malaria control in northeast Brazil and Zambia (Utzinger et al. 2001) was attempted successfully by targeting the drainage which were the habitat of Anopheles (Keiser et al. 2005). The effect of geomorphological and hydrological processes on the variability of dengue spread is by passed in many studies investigating the environmental controls of dengue transmission. Generally, it is accepted that while targeting the transmission hotpots, the vector ecology details are important components for vector eradication and elimination strategies (Smith et al. 2013). These include diverse processes that behave very predictably with the catchment locations in reaction to the environmental processes and respond positively to the meteorological inputs (e.g., response to the rainfall and temperature). Dengue transmission is normally related to the topographic patterns and the regions proximal to channel passages (Gemperli et al. 2006). Regardless of the presence of alternative multiple surface water sources, the risk of malaria was more within the area up to 750 m from the river/stream (Van der Hoek et al. 2003). Distance from the streams have also been associated with the abundance of mosquitos in Belize, Kenya, Mauritius, Tanzania, Brazil, and to canals in Peru (Hakre et al. 2004; Edillo et al. 2004; Oesterholt et al. 2006; Olson et al. 2009; Guthmann et al. 2001). The objective of this study is to analyze the stream conditions, daily dengue incidence during the months of July, August, September, and October, disease hotspots, and ordinary least square analysis of dengue spread in relation to the human population and area of localities during 2011.
Material and methods
The study area for this research comprises Islamabad, Rawalpindi, Lahore, and Karachi. This research involves a micro level study of these cities. A sector-wise study of Islamabad, Union Council (UC) (the fifth administrative tier of government in Pakistan)-wise study of Rawalpindi and Lahore, and town-wise study of Karachi has been conducted. Islamabad city is divided into several sectors and these sectors are identified by the combination of alphanumeric values by the Capital Development Authority, Islamabad, Pakistan. The names of the sectors are in alphabetical order like B, C, D, E, F, G, H, and I. Each sector is uniformly distributed into four sub-sectors e.g. I-9/1–I-9/4; containing three residential and one commercial sub-sector. There are around 90 sectors however only developed sectors have been processed for results in this study. Dengue cases reported from 68 developed sectors of Islamabad, 153 UCs of Rawalpindi, 151 UCs of Lahore, and 25 towns of Karachi for the year 2011 have been acquired systematically from the database of the Government of the Punjab and Sind and National Institute of Health (NIH). All records have been standardized on a monthly basis (August, September, and October) and annually (i.e., repeated cases on the same locality during 2011 summed up as one occurrence). To study the potential socioeconomic factors; the population, area of sectors/UCs/towns, length of streams, and total number of stream tributaries have been considered as the social risk factors, whereas the daily minimum temperature in degrees Celsius, daily wind speed in meter/second (m/s), and daily rainfall in millimeters (mm) of August, September, and October have been chosen as affecting environmental covariates. The sector/UCs/town boundary data was digitized and geo-referenced in ArcGIS 10. Estimated population data of 2011 for all areas was acquired from National Institute of Population Studies (NIPS). The meteorological datasets of study areas have been acquired from Pakistan Meteorological Department (PMD) and compared with the daily dengue incidence during July, August, September, and October and has been presented in graphical form. SRTM 90 m digital elevation model (DEM) of the study area was processed by using the Spatial Analyst Tool of ArcGIS 10 to calculate the length and total number of streams. Area of localities was calculated after digitizing the boundary data. The population of localities with high dengue incidence, and area of localities with dengue incidence have been especially taken into account for the stream analysis. The Spatial Statistics Tool was used to compute the patient’s directional distribution, hotspot analysis, spatial outlier analysis, ordinary least squares for dengue cases during 2011.
Hotspot analyses identify statistically the clusters of points having higher magnitude using the quantity of Relative Risk Ratio. It further defines the intervals showing: highly disease prone areas in dark red color, medium level disease prone areas in light red color, highly vulnerable areas in gray color, and medium level vulnerable areas in blue color. The Anselin Local Moran’s I statistic is the indicator of spatial association. It is used in cluster and outlier analysis that evaluates the high prone areas in clusters of localities at 95 % level of significance. High positive z score for a locality indicates that the surrounding localities have similar values (either high values or low values). The localities that show statistically significant (0.05 level) cluster of high values are indicated by (HH) and the localities that show statistically significant (0.05 level) cluster of low values are indicated by (LL). A low negative z score (for example, <−1.96) for a locality indicates a statistically significant (0.05 level) spatial outlier, hence such localities are indicated if the locality has a high value and is surrounded by locality with low values (HL) or if the locality has a low value and is surrounded by localities with high values (LH). The directional distribution generates the standard deviational ellipses to summarize the spatial attributes like dispersion, directional trends, and central tendency of geographic features. Ordinary least squares method is used for regression analysis which minimizes the errors in calculations therefore it is used here to model the dependent variable, i.e., dengue cases in terms of its relationship with the explanatory variables, i.e., population and area of localities.
Results
-
1.
Densely populated sectors of Islamabad, UCs of Rawalpindi and Lahore and towns of Karachi are reporting higher number of dengue cases and are considered the highly disease prone areas.
-
2.
Localities with high magnitude of drainage density and population density with smaller area (km2) are suitable for dengue transmission as compared to the localities with low population and low magnitude of drainage density.
-
3.
Role of rainfall patterns and temperature regimes based on the geomorphological conditions of different cities; monsoon conditions behave differently in dengue spread, i.e., dengue outbreak occurred in study areas with different time lag as shown in (Figs. 1, 2, 3, 4, 5, 6, 7, 8, 9, 10, 11, 12, 13, 14, 15, and 16).
Fig. 1 
Daily dengue incidence during July 2011 in Islamabad
Fig. 2 
Daily dengue incidence during July 2011 in Rawalpindi
Fig. 3 
Daily dengue incidence during July 2011 in Lahore
Fig. 4 
Daily dengue incidence during July 2011 in Karachi
Fig. 5 
Daily dengue incidence during August 2011 in Islamabad
Fig. 6 
Daily dengue incidence during August 2011 in Rawalpindi
Fig. 7 
Daily dengue incidence during August 2011 in Lahore
Fig. 8 
Daily dengue incidence during August 2011 in Karachi
Fig. 9 
Daily dengue incidence during September 2011 in Islamabad
Fig. 10 
Daily dengue incidence during September 2011 in Rawalpindi
Fig. 11 
Daily dengue incidence during September 2011 in Lahore
Fig. 12 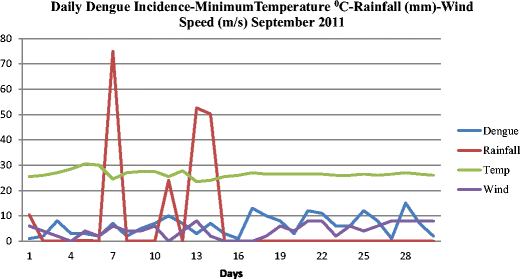
Daily dengue incidence during September 2011 in Karachi
Fig. 13 
Daily dengue incidence during October 2011 in Islamabad
Fig. 14 
Daily dengue incidence during October 2011 in Rawalpindi
Fig. 15 
Daily dengue incidence during October 2011 in Lahore
Fig. 16 
Daily dengue incidence during October 2011 in Karachi
-
4.
Above normal temperatures in the study areas during the year 2011 and the heavy rains and successive flooding during 2010–2011 also created the synergetic effects for dengue spread in 2011.
-
5.
Migration patterns from (Karachi) and toward (Islamabad, Rawalpindi, and Lahore) also play an important role in the dengue spread in these cities.
-
6.
The above-mentioned results are consistent with the analyses of hotspot, spatial outlier, ordinary least squares, and daily dengue incidence data sets of study areas.


Discussion
As mentioned earlier (“Material and methods”), the Islamabad Capital Territory (ICT) is divided into different sectors and each sector comprises an area of 3.0 Km2. The streams in Islamabad are extending north south directions. The sectors of F-6, F-7, G-6, and G-7 have high drainage density as compared to adjacent sectors as shown in the Table 1. The stream analysis of Rawalpindi (Table 2) shows that there is dense pattern of drainage in the UCs of Chahan, Sihal, and Chauntra. All the tributaries are connecting with each other in these UCs. There is also very dense drainage in the UCs of Chakri, and Gagan which is also shared with Chauntra. Analysis of Kotli Sattiyan has shown that the streams in Sartha Sarola and Dheer Kot Sattiyan extend toward Potha Sharif, Phagwari, Sher Bagla, and Gehl UCs of Murree. Rawalpindi has extensively dense drainage pattern with high magnitude. There are many small and large tributaries connecting with each other and with large streams. The large streams are extending in north–south direction whereas small and large tributaries are extending in east–west direction, i.e., the streams are extending from north to south starting from Margalla hills whereas the tributaries are extending in east–west direction in Islamabad. These streams of Islamabad cause the flow of water toward the urban areas of Islamabad and Rawalpindi. This stream pattern becomes dense and concentrated at the point where Islamabad joins Rawalpindi. This area comprises the sectors of I-8 to I-11 and Rawal Town. Results show that these sectors and Rawal town have high magnitude of drainage density, less area of the locality, dense population, and report the highest number of dengue cases.
The stream analysis of Lahore is shown in Table 3. In the Niaz Beg UC of Allama Iqbal Town of Lahore, streams are spreading in different directions covering major part of the Allama Iqbal Town. Hence, this area has high drainage density as compared to the neighboring UCs like Shahpur and Hanjarwal. Highest number of dengue cases have been reported from a UC of Allama Iqbal, i.e., Johar Town (i.e., 1534). The major and connected streams in Lahore city are covering many densely populated small UCs of Data Ganj Bakhsh Town like Mozang, Anarkali, Shadman, Qila Gujjar Singh, Bilal Ganj, Ganj Kalan, Ameen Pura, and Gawalmandi. The higher number of cases have been reported from high drainage density areas of Lahore Cantonment UC. Samanabad Town has very high drainage density, streams in this town covers many small UCs. Gajju Matta has also very high drainage density. In Jia Bagga, tributaries are in the form of bunches. The streams of Attari Saroba and Sittara Colony are connected with each other and there are many other streams that connect the different streams with each other. Mughalpura, Ghaziabad, Mustafa Abad, and Harbanspura are UCs of Aziz Bhatti Town. These UCs have small area and are densely populated. Nine smaller area and densely populated UCs of Ravi town have been reported significant number of dengue cases during the study years. These include Shahdara, Jia Musa, Kot Begum, Fruit Mandi, Qila Lachchman Singh, Androon Texali Gate, Androon Dehli Gate, Androon Bhati Gate, and Rang Mahal. The population of Lahore city is concentrated toward the north side because this area contains the old city population and there are more employment and education opportunities. This situation has created a sudden rigorous expansion in human settlements in this area. Along with the dense population, the drainage pattern, climatic conditions, and areas of the UCs have played vital role in dengue transmission. Furthermore, the huge inflow of population toward these areas from other places has caused the disturbance in natural stream flow patterns.
The stream analysis of Karachi is shown in Table 4. The North Nazimabad Town of Karachi is densely populated and the study shows that it has high magnitude of drainage density. Very high drainage density has also recorded in the areas of Karachi Cantt, Saddar, Clifton, and Jamshed Town. The streams in New Karachi Town are extending in different directions, i.e., south and south west. It is densely populated and analysis shows that there is very high magnitude of drainage density in this town. In Karachi, the natural flow of streams is toward Arabian Sea and at some places of high ridges the drainage pattern is similar to hilly areas. But at other places, the low flow accumulation conditions cause the water to stay in high drainage density areas and hence promote the vectors development. Few dengue cases have been reported from well-planned urban areas whereas the areas of having high population with less area of locality and high magnitude of drainage density has caused the dengue transmission at much higher rate. Such local behavior of social covariates along with the suitable climatic conditions became the responsible factor for the sudden outbreak in particular areas of this city.
Very few dengue cases were reported in the month of July in all study areas (Figs. 1, 2, 3, and 4). Heavy rains in July with higher temperatures (i.e., mean monthly temperature of Islamabad, Rawalpindi, and Lahore in July is approx. 30 °C and the range of the temperature during this humid month is very narrow) supports the suitable range of dengue vector survival that created the favorable conditions for the vector development. Hence, the few cases started to register in the last week of July and continued to increase from the first week of August in Islamabad, Rawalpindi, and Lahore. Karachi does not receive heavy rains during July and requires more rainfall for the suitable environment of the vector development (Figs. 5, 6, 7, and 8). According to Khalid and Ghaffar (2015), due to flooding and higher than the normal temperatures, high rate of dengue cases were reported in 2010 and highest number of dengue cases in 2011. The highest number of dengue cases in 2011 was also due to the synergetic effect of continuous flooding in 2010–2011. Hence, the general wet conditions prevailed in September and October due to heavy rains in the months of July and August in Islamabad, Rawalpindi, and Lahore, whereas Karachi started to receive the heavy rains in September, however, it also sustained the moist conditions due to flooding in July and August. The increased cases of dengue were reported during September and continued until the end of October in all study areas (Figs. 9, 10, 11, 12, 13, 14, 15, and 16). The saturated soil moisture and natural lush green vegetation in Islamabad, Rawalpindi, and Lahore maintained the wet conditions during September even receiving the less rainfall comparative to the previous months (i.e., July and August). According to the Climate of Pakistan (2011), July, August, September, and October are the wet months in Pakistan. Table 5 shows the comparison of the normal and general condition of annual rainfall (mm) during 2010 and 2011. After reporting 688 cases during 2009 in Karachi and due to lack of awareness and mitigation strategies, the abnormal climatic conditions in the region caused the spread of dengue at much higher rate and a total number of 4625 cases were reported after the onset of summer monsoon during 2010. The monthly minimum temperature of Karachi during July, August, and September in 2010 was higher than the normal (Khalid and Ghaffar, 2015). Similarly, the total monthly rainfall of Karachi during July, August, and September in 2010 was also higher than the normal. The regimes of 2010 put synergetic effect on the occurrence of dengue in 2011 in the study areas. This might be the one reason that more cases of dengue were reported in 2010 as compared to 2011 in Karachi. There are other factors which contribute indirectly toward the spread of this disease including traveling patterns within the big cities. The increased rate of migration/traveling from Karachi and other surrounding cities toward Lahore and Rawalpindi/Islamabad during 2010 and onward, has also been observed due to the economic instability in Sindh province, particularly in Karachi. This may be another reason of less dengue cases reported from Karachi during 2011 and onwards. As Lahore and Rawalpindi lies in the Punjab province that is more developed as compared to other provinces and offer more employment and education opportunities, so people from all over Pakistan travel to these cities round the year. Islamabad is the capital of Pakistan and is regarded as the most developed city (Khalid and Ghaffar 2015), hence it offers greater opportunities of better livelihood. On the basis of the above-mentioned factors, more dengue cases have been reported as a result of migrations toward these cities (Islamabad, Rawalpindi, and Lahore) as compared to Karachi during the study period (Fig. 17).

Dengue cases reported from study areas
The local situation of population and geographic location of union councils in study areas is shown in Figs. (18, 19, 20, and 21). The general distribution of dengue cases in the study areas is represented by green points while standard deviational ellipse is highlighting the patient’s distribution by summarizing the spatial attributes like dispersion, directional trends, and central tendency. The directional distribution of dengue may be affected by the drainage pattern, density of the drainage, density of human population settlements affecting the natural drainage patterns and drainage density, flow accumulation conditions, geomorphological, and meteorological conditions of the study areas (Khalid and Ghaffar 2015). Moreover, Figs. 22, 23, 24, and 25 are showing the mean centers of these cases in studied areas. Hotspot analysis indicates the high disease-prone localities as well as the vulnerable places. Sectors of Islamabad shown in dark red color are highly disease prone areas; these include F-6, F-7, and G-6 sectors. Medium level disease prone sectors are highlighted in light red color; these include F-8, F-9, G-8, and I-10 sectors. The medium level vulnerable to disease sectors are highlighted in gray color; these include the sectors of E-12, E-14, E-15 I-8, I-11, and I-12 (Fig. 26).

Population distribution of Islamabad District

Population distribution of Rawalpindi District

Population distribution of Lahore District

Population distribution of Karachi District

Dengue cases directional distribution for Islamabad 2011

Dengue cases directional distribution for Rawalpindi 2011

Dengue cases directional distribution for Lahore 2011

Dengue cases directional distribution for Karachi 2011

Hotspot analysis of dengue fever cases in Islamabad during 2011
The highly disease prone UCs of Rawalpindi shown in dark red color; these include Ranial, Garja, Chak Jalal Din, Chaklala, Dhamial, Morgah, Kotha Kalan, Rehman Abad, Dhok Munshi Khan, Lakhan, Dhamian Syedan, Adiala, and Tarahia. Medium level disease prone UCs include Takht Puri, Mughal Pura, Dakhali, Ghazan Abad, Sihal, Chauntra, Gagan, and Chakbeli Khan and are shown in light red color. The medium level vulnerable UCs are shown in gray color; these include Potha Sharif, Sher Bagla, Gehl, Charhan, Phagwari, Ban, and Lehtrar Bala (Fig. 27).

Hotspot analysis of dengue fever cases in Rawalpindi during 2011
The highly disease-prone UCs of Lahore include Johar Town, Sikandar Block, Liaqatabad, Ismail Nagar, Kot Lakhpat, Makkah Colony, Farid Colony, Sitara Colony, and Attari Saroba. Medium level disease prone UCs include Faisal Town, Muslim Town, Garden Town, Awan Town, Township, Green Town, Gulberg, Naseerabad, Maryum Colony and Chandrai, Niaz Beg, Ali Raza Abad and Model Town whereas medium level vulnerable to disease areas are highlighted in gray color including Muslimabad, Lakhodher, Fateh Garh, Salamat Pura, Harbanspura, Taj Bagh, and Guldasht Colony. The UCs less vulnerable to disease comparatively are highlighted in blue color; these include Baghbanpura, Gujjarpura, Bhaghatpura, Shad Bagh, Begum Pura, Chah Miran, Makhan Pura, Kot Khawaja Saeed, and Faiz Bagh (Fig. 28).

Hotspot analysis of dengue fever cases in Lahore during 2011
The highly disease prone towns of Karachi include Karachi Cantt and Jamshed Town. Medium-level disease-prone areas include Orangi, New Karachi, North Nazimabad, Saddar, and Clifton, and Gulshan-e-Iqbal town whereas medium level vulnerable to disease areas are highlighted in gray color including Malir, Faisal Cant, Shah Faisal, Korangi, Landhi, DHA, Baldia Town, and Layari while the less vulnerable town to this disease is Keamari and is indicated in blue color (Fig. 29).

Hotspot analysis of dengue fever cases in Karachi during 2011
Outlier analyses are highlighting the highly hit (HH) localities in study areas in black color, localities at medium risk (HL) in orange color, and localities not significant to the disease in gray color (Figs. 30, 31, 32 and 33). Correlation maps of dengue fever cases with respect to population and area of localities is highlighting the sectors E-13, E-14, F-6, F-7, F-8, F-9, G-6, G-8, and I-10 of Islamabad, the UCs Ranial, Garja, Chak Jalal Din, Chaklala, Dhamial, Morgah, Kotha Kalan, Rehman Abad, Dhok Munshi Khan, Lakhan, Dhamian Syedan, Adiala, Tarahia, Takht Puri, Mowara, Choa Khalsa, Khalol, Kanoha, Mughal Pura, Dakhali, Ghazan Abad, Sihal, Chauntra, Gagan, Narali, Devi, Jatli and Chakbeli Khan, Potha Sharif, Sher Bagla, Gehl, and Charhan, of Rawalpindi, the UCs Niaz Beg, Chung, Johar Town, Sabzazar, Mozang, Babu Sabu, Sittara Colony, Attari Saroba, Samanabad, Sanda Kalan, Ameenpura, Gujjar Singh of Lahore, and Orangi, New Karachi, North Nazimabad, Saddar, Karachi Cantt, Clifton, and Gulshan-e-Iqbal of Karachi as disease-prone areas in light red and dark red colors. It shows that highly populated localities with small areas are majorly hit by dengue in all study areas (Figs. 34, 35, 36, and 37). The highly disease-prone areas are majorly appeared to be densely populated and high magnitude in drainage density. Areas with less population and drainage density appeared to be reporting less number of dengue cases.

Spatial outlier analysis of dengue fever cases in Islamabad during 2011

Spatial outlier analysis of dengue fever cases in Rawalpindi during 2011

Spatial outlier analysis of dengue fever cases in Lahore during 2011

Spatial outlier analysis of dengue fever cases in Karachi during 2011

Ordinary least squares of dengue fever cases with respect to the population and area of localities in Islamabad during 2011

Ordinary least squares of dengue fever cases with respect to the population and area of localities in Rawalpindi during 2011

Ordinary least squares of dengue fever cases with respect to the population and area of localities in Lahore during 2011

Ordinary least squares of dengue fever cases with respect to the population and area of localities in Karachi during 2011
Generally, summer monsoon season in Pakistan starts from the first week of July and extends till the end of September. The total number of dengue cases reported in the month of July through October 2011 from study areas is shown in Fig. 17. Analyses show that each dry spell of 2–4 days provided the suitable conditions for the development and survival of dengue vectors during summer monsoon months of July, August, September, and October in study areas (Khalid and Ghaffar 2015). The dry spell can easily be noted between the wet spells in Figs. 1, 2, 3, 4, 5, 6, 7, 8, 9, 10, 11, 12, 13, 14, 15 and 16, e.g., the dry spell between 4th and 7th day and 18th and 23rd day in Islamabad (Fig. 1), dry spell between 4th and 7th day and 18th and 22nd day in Rawalpindi (Fig. 2), and so on. Figures also show a higher number of reported cases during the dry spells of August and September and even in the post monsoon month of October. It is evident from different studies that the vector-borne diseases are associated with above normal rainfall (Githeko et al. 2000; Climate of Pakistan 2011). As the dengue vector developed, the incidence rate continued to increase. Minimum temperatures of July and August 2011 were higher than the normal and supported the dengue vector development (Khalid and Ghaffar 2015). There are many factors affecting the spatio-temporal distribution of dengue in four big cities of Pakistan. Stream pattern, drainage density, population density, area of locality, geomorphology, and climatic conditions are interconnected that play vital role in the transmission of this disease in urban and peri-urban areas. There are other factors which contribute indirectly toward the dengue spread including traveling patterns between big cities that also played a role in this disease spread. The increased rate of migration/traveling toward these study areas is mainly due to education and employment purposes. All cities under study provide great opportunities of higher education and employment. People from all over Pakistan travel to these cities round the year. The migration and traveling resulting in the rapid increase in population density and unplanned urbanization might be another factor to report dengue cases in these areas.
Conclusion
This study shows the spatio-temporal distribution of dengue during 2011, based on social covariates including population, area of locality, and stream density, and climate covariates including minimum temperature and rainfall in different cities of Pakistan. This study also presents a clear relationship between climate covariates and daily dengue incidence. The burden of dengue is challenging for policy makers and public health officials. Recognizing the high risk areas of dengue threat will strengthen the controlling strategies and support in reducing the impacts for future. The present study of recent dengue risk burden and distribution in four major cities of Pakistan will become the basis for future endeavors and help to achieve the goal in mitigation of this deadly disease.
References
Climate of Pakistan (2011) Report by National Drought Monitoring Center. Pakistan Meteorological Department
Cox J, Grillet ME, Ramos OM, Amador M, Barrera R (2007) Habitat segregation of dengue vectors along an urban environmental gradient. Am J Trop Med Hyg 76:820–826
Chowell G, Sanchez F (2006) Climate-based descriptive models of dengue fever. J Environ Health 68:60–63
Chan YC, Salahuddin NI, Khan J, Tan HC, Seah CL, Li J (1994) Dengue hemorrhagic fever outbreak in Karachi, Pakistan. Trans R Soc Trop Med Hyg 89:619–620
Edillo FE, Touré YT, Lanzaro GC, Dolo G, Taylor CE (2004) Survivorship and distribution of immature Anopheles gambiae. (Diptera: Culicidae) in Banambani Village, Mali. J Med Entomol 41:333–339
Fatima Z, Idrees M, Bajwa MA, Tahir Z, Ullah O, Zia MQ, Hussain A, Akram M, Khubaib B, Afzal S, Munir S, Saleem S, Rauff B, Badar S, Naudhani M, Butt S, Aftab M, Ali L, Ali M (2011) Serotype and genotype analysis of dengue virus by sequencing followed by phylogenetic analysis using samples from three mini outbreaks-2007–2009 in Pakistan. BMC Microbiol 10:200–203
Favier C, Degallier N, Dubois MA (2005) Dengue epidemic modelling: stakes and pitfalls. Asia Pac Biotechnol News 9:1191–1194
Gemperli A, Sogoba N, Fondjo E, Mabaso M, Bagayoko M, Briët OJT, Anderegg D, Liebe J, Smith T, Vounatsou P (2006) Mapping malaria transmission in West and Central Africa. Trop Med Int Health 11:1032–1046
Guerra CA, Snow RW, Hay SI (2006) Mapping the global extent of malaria in 2005. Trends Parasitol 22:353–358
Gubler DJ (2002) Epidemic dengue/dengue hemorrhagic fever as a public health, social and economic problem in the 21st century. Trends Microbiol 10(2):100–103
Guthmann JP, Hall AJ, Jaffar S, Palacios A, Lines J, Llanos- Cuentas A (2001) Environmental risk factors for clinical malaria: a case–control study in the Grau Region of Peru. Trans R Soc Trop Med Hyg 95:1–7
Githeko AK, Lindsay SW, Confalonieri UE, Patz JA (2000) Climate change and vector-borne diseases: a regional analysis. Bull World Health Organ 78:1136–1147
Humayoun MA, Waseem T, Jawa AA, Hashmi MS, Akram J (2010) Multiple dengue serotypes and high frequency of dengue hemorrhagic fever at two tertiary care hospitals in Lahore during the 2008 dengue virus outbreak in Punjab, Pakistan. Int J Infect Dis 14:54–59
Halstead SB (2008) Dengue virus-mosquito interactions. Rev Entomol 53:273–291
Hakre S, Masuoka P, Vanzie E, Roberts RD (2004) Spatial correlations of mapped malaria rates with environmental factors in Belize, Central America. Int J Health Geogr 3:6–17
Jetten TH, Focks DA (1997) Potential changes in the distribution of dengue transmission under climate warming. Am J Trop Med Hyg 57:285–297
Khalid B, Ghaffar A (2015) Dengue transmission based on urban environmental gradients in different cities of Pakistan. Int J Biometeorol 59:267–283
Keiser J, Singer BH, Utzinger J (2005) Reducing the burden of malaria in different eco-epidemiological settings with environmental management: a systematic review. Lancet Infect Dis 5:695–708
Knap A, Dewailly E, Furgal C, Galvin J, Baden D, Bowen RE, Depledge M, Duguay L, Fleming LE, Ford T, Moser F, Owen R, Suk WA, Unluata U (2002) Indicators of ocean health and human health: developing a research and monitoring framework. Environ Health Perspect 110:839–845
Liu-Helmersson J, Stenlund H, Wilder-Smith A, Rocklov J (2014) Vectorial capacity of Aedes aegypti: effects of temperature and implications for global dengue epidemic potential. PLoS ONE 9(3):e89783. doi:10.1371/journal.pone.0089783
Olson SH, Gangnon R, Elguero E, Durieux L, Guégan JF, Foley JA, Patz JA (2009) Links between climate, malaria and wetlands in the Amazon Basin. Emerg Infect Dis 15:659–662
Oesterholt MJAM, Bousema JT, Mwerinde OK, Harris C, Lushino P, Masokoto A, Mwerinde H, Mosha FW, Drakeley CJ (2006) Spatial and temporal variation in malaria transmission in a low endemicity area in northern Tanzania. Malar J 5:98
Smith MW, Macklin MG, Thomas CJ (2013) Hydrological and geomorphological controls of malaria transmission. Earth Sci Rev 116:109–127
Utzinger J, Tozan Y, Singer BH (2001) Efficacy and cost effectiveness of environmental management for malaria control. Trop Med Int Health 6:677–687
Van der Hoek W, Konradsen F, Amerasinghe PH, Perera D, Piyaratne MK, Amerasinghe FP (2003) Towards a risk map of malaria for Sri Lanka: the importance of house location relative to vector breeding sites. Int J Epidemiol 32:280–285
World Health Organization (2012) International travel and health: situation as on 1 January 2012. World Health Organization
World Health Organization (2009) Epidemiology, burden of disease and transmission. In Dengue: Guidelines for diagnosis, treatment, prevention and control. World Health Organization, Geneva, 1–21
Wu P, Guo H, Lung S, Lin C, Su H (2007) Weather as an effective predictor for occurrence of dengue fever in Taiwan. Acta Trop 103:50–57
Wolff M (2002) Concepts and approaches for marine ecosystem research with reference to the tropics. Rev Biol Trop 50:395–414
Yang HM, Macoris ML, Galvani KC, Andrighetti MT, Wanderley DM (2009) Assessing the effects of temperature on the population of Aedes aegypti, the vector of dengue. Epidemiol Infect 137:1188–1202
Acknowledgements
The authors wish to thank the National Institute of Health (NIH) Islamabad, Government of the Punjab (GoP), National Institute of Populational Studies (NIPS), and Pakistan Meteorological Department (PMD) for providing the important data necessary for this manuscript.
Author information
Authors and Affiliations
Corresponding author
Rights and permissions
About this article

Cite this article
Khalid, B., Ghaffar, A. Environmental risk factors and hotspot analysis of dengue distribution in Pakistan. Int J Biometeorol 59, 1721–1746 (2015). https://doi.org/10.1007/s00484-015-0982-1
Received:
Revised:
Accepted:
Published:
Issue Date:
DOI: https://doi.org/10.1007/s00484-015-0982-1