
Abstract
Ca2+-buffer proteins (CaBPs) modulate the temporal and spatial characteristics of transient intracellular Ca2+-concentration changes in neurons in order to fine-tune the strength and duration of the output signal. CaBPs have been used as neurochemical markers to identify and trace neurons of several brain loci including the mammalian retina. The CaBP content of retinal neurons, however, varies between species and, thus, the results inferred from animal models cannot be utilised directly by clinical ophthalmologists. Moreover, the shortage of well-preserved human samples greatly impedes human retina studies at the cellular and network level. Our purpose has therefore been to examine the distribution of major CaBPs, including calretinin, calbindin-D28, parvalbumin and the recently discovered secretagogin in exceptionally well-preserved human retinal samples. Based on a combination of immunohistochemistry, Neurolucida tracing and Lucifer yellow injections, we have established a database in which the CaBP marker composition can be defined for morphologically identified cell types of the human retina. Hence, we describe the full CaBP make-up for a number of human retinal neurons, including HII horizontal cells, AII amacrine cells, type-1 tyrosine-hydroxylase-expressing amacrine cells and other lesser known neurons. We have also found a number of unidentified cells whose morphology remains to be characterised. We present several examples of the colocalisation of two or three CaBPs with slightly different subcellular distributions in the same cell strongly suggesting a compartment-specific division of labour of Ca2+-buffering by CaBPs. Our work thus provides a neurochemical framework for future ophthalmological studies and renders new information concerning the cellular and subcellular distribution of CaBPs for experimental neuroscience.
Introduction
Neuronally acting major Ca2+-buffer proteins (CaBP), including calretinin (CaR), calbindin (CaB), parvalbumin (PV) and secretagogin (SCGN), are key players in determining the length, amplitude and repeatability of intracellular (IC) Ca2+-transient events throughout the nervous system (for a review, see Schwaller 2015). Because of their relatively high dissociation constant, CaBPs partake in Ca2+-buffering when neurons are excited and the IC Ca2+-concentration rises high enough for the CaBPs to bind Ca2+. Therefore, Ca2+-buffering profoundly acts on neuronal signalling, while only affecting other Ca2+-dependent IC mechanisms to a considerably lesser extent. The various CaBPs differ considerably in the dynamics, the affinity and the capacity of their Ca2+-binding profile, thus explaining their mutual non-exchangeability (Schwaller 2009). Therefore, a description of the cellular and subcellular localisation of CaBPs might yield considerable information regarding the functions of the examined neurons. In addition to being studied for their IC physiological role, CaBPs have also been widely utilised as major neurochemical markers to identify and trace neurons of the nervous system. Abundant information has been obtained over the past few decades with regard to the CaBP make-up of neurons of the mammalian retina and CaBPs have become major markers of retinal neurons for both clinical and experimental ophthalmology. PV, for example, has been used selectively to stain AII amacrine cells (ACs), the bottle-neck of the primary rod pathway in several mammalian models (Wässle et al. 1993; Casini et al. 1998; Lee et al. 2003), CaR is a general marker of starburst ACs in the murine retina (Gábriel and Witkovsky 1998; Haverkamp and Wässle 2000) and CaB has been used to stain horizontal cells (HC) in most mammals (Massey and Mills 1996; Haverkamp and Wässle 2000). However, the CaBP-staining profiles show variability between species. One such well-known example is CaR, which is expressed by AII cells in most mammals, whereas murine AII cells appear CaR-negative and, instead, starburst and W-S2/3 wide-field ACs express CaR in both mouse and rat (Gábriel and Witkovsky 1998; Haverkamp and Wässle 2000; Knop et al. 2014). Moreover, primates and rodents have different marker systems that identify their bipolar cells (BC), and CaBPs label different BC subtypes (Haverkamp and Wässle 2000; Haverkamp et al. 2003; Ghosh et al. 2004). Moreover, the availability of well-preserved human tissue for the collection of a comprehensive data set of the neurochemical marker system of the human retina is limited. Our aim in this project has been to accumulate data on the CaBP expression of human retinal neurons.
We examined the distribution of CaR, CaB, PV and the recently discovered SCGN in human retinal samples at the cellular and subcellular level. In addition, we carefully characterised the colocalisation of these proteins in the examined neuron subtypes. The presented data set was then combined with results of previous studies of the human retina in order to establish a database in which the CaBP composition is determined for morphologically identified human retinal cell types.
Moreover, we have characterised the full CaBP make-up for a number of human retinal neurons, including HII HCs, AII ACs, type-1 tyrosine hydroxylase (TH)-expressing ACs and other less known neurons. In addition, we describe a number of unidentified cells whose morphology is yet to be characterised. Finally, we present several examples of the colocalisation of two or three CaBPs with slightly different subcellular distributions in the same cell. This phenomenon suggests a certain division of labour in Ca2+-buffering by CaBPs with possible differential effects on the amplitude, the exponential rise and decay phases and the repeatability of Ca2+ transients of each cellular compartment. Our goal is to provide both a neurochemical framework for future ophthalmological studies and new information concerning the cellular and subcellular distribution of CaBPs for experimental neuroscience.
Materials and methods
Human patients
Human donor tissue was collected either from organ donors with no reported history of eye disease, immerdiately after the removal of the cornea for transplantation, or from cadavers from the 1st Department of Pathology and Experimental Cancer Research, Semmelweis University. All samples were obtained in accordance with the tenets of the Declaration of Helsinki. All personal identifiers were removed and samples were coded before histological processing. Retinas from five patients were investigated in the present study (3 females, 2 males, aged 37–75 years; postmortem time: 2–5 h). All experimental protocols were approved by the local ethics committees (TUKEB 58/2006, TUKEB 58/2014).
Histological preparation
After the removal of the cornea, the iris, lens and vitreous body were carefully extracted and eyecups were cut radially into six slices. Slices were fixed in 4 % buffered paraformaldehyde (PFA) for 2 h at +4 °C and then rinsed several times in 0.1 M phosphate-buffered saline (PBS, pH 7.4). For whole-mounts, the retina was gently removed from the eyecup. The tissue was cut into small pieces, soaked overnight in 30 % sucrose in PBS at +4 °C and stored in cryoprotectant solution for further use at −20 °C. For sections, inferonasal retinal pieces were placed in 30 % sucrose in PBS at +4 °C and then embedded in Shandon Cryomatrix (Life Technologies, Budapest, Hungary). Blocks were stored at −80 °C until sectioning. Sections (10–20 μm thick) were cut in the radial plane by means of a cryostat (Leica CM 1950, Leica Microsystems, Wetzlar, Germany), mounted on gelatin-coated slides and stored at −20 °C until processed.
Fluorescent immunohistochemistry
Fluorescent immunohistochemical reactions on sections and on whole-mount retinas were carried out according to standard protocols (Kántor et al. 2015a, 2015b). To increase penetration in whole-mounts, tissue was freeze-thawed three times, pepsin digestion was carried out (1 % for 15 min at 37 °C) and increased rinsing and incubation times were applied. Briefly, sections or whole-mount tissues were washed several times with PBS (25 mM with 0.2 % Triton-X [PBS-TX]). Nonspecific staining was blocked with 10 % donkey serum diluted in PBS-TX. Afterwards, specimens were incubated with the primary antibodies diluted in PBS-TX at +4 °C (60 h for sections and 72 h for whole-mounts). The primary antibodies used in the present work are listed in Table 1. After being extensively rinsed, specimens were incubated with the appropriate mixture of the following secondary antibodies: donkey anti-mouse IgG conjugated with Alexa 488 or DyLight 649, donkey anti-rabbit IgG conjugated with Alexa 555, donkey anti-guinea pig conjugated with Cy3, donkey anti-goat IgG conjugated with Alexa 555 or DyLight 405, donkey anti-rat IgG conjugated with DyLight 649 (all Alexa-conjugated antibodies were purchased from Life Technologies, Budapest, Hungary; all DyLight-conjugated antibodies were from Jackson ImmunoResearch Europe, Suffolk, UK) diluted in PBS-TX and 3 % normal donkey serum. Sections were incubated for 3 h at room temperature, and whole-mounts were incubated overnight at +4 °C. After several rinsing steps, whole-mounts were mounted on gelatine-coated slides and all specimens were coverslipped by using AquaPolymount (Polysciences Europe, Eppelheim, Germany) as mounting medium. Slides were kept at +4 °C until imaging.
Negative control reactions were carried out by omitting the primary or secondary antibodies (see Supplementary Fig. 1). Anti-CR, anti-PV and anti-SCGN primary antibodies produced in various species were also applied to retina or brain sections of adult male Wistar rats in which the distribution of the CaBPs is well known from the literature (see Supplementary Figs. 2 and 3; Gábriel et al. 2004; Pasteels et al. 1990; Puthussery et al. 2010; Sanna et al. 1990; Endo et al. 1986; Jacobowitz and Winsky 1991; Garcia-Segura et al. 1984).
Intracellular lucifer yellow injections
Borosilicate glass pipettes were filled with 4 % Lucifer yellow (LY, Sigma-Aldrich, Budapest, Hungary; resistance: 150–500 MΩ). Retinal ganglion cells (GC) from midperipheral (3–6 mm centrality)-peripheral (6–9 mm centrality) locations were injected with LY under a Zeiss Axioscope microscope (40× water immersion lens, Zeiss micromanipulator; Carl Zeiss, Jena, Germany) and Digitimer iontophoretic dye marker (Digitimer, Welwyn Garden City, UK; current: −4.5 nA, duration: 10–15 min). Afterwards, retinal pieces were postfixed in 4 % PFA with 0.5 % glutaraldehyde (Sigma-Aldrich, Budapest, Hungary). Multiple fluorescence immunohistochemistry was carried out as described above, but with the omission of the pepsin digestion step.
Imaging and image processing
Images were captured on a confocal microscope (Zeiss LSM 510 Meta or 780 with upright microscope Axio Imager Z1; Carl Zeiss) by using ZEN 2012 software (Carl Zeiss) and 40× or 63× Plan-Apochromat oil-immersion lens (NA: 1.4). In the case of LY-filled cells, spectral recording by using the lambda mode of ZEN software with subsequent linear unmixing of the images was applied. Final images were constructed by using Adobe Photoshop 7.0 (San Diego, Calif., USA) and Fiji (Schindelin et al. 2012). Only minor adjustments of brightness and contrast were applied to avoid altering the original appearance of the images.
Neurolucida reconstruction
In whole-mounts, PV-immunoreactive BCs, CR-immunoreactive BCs, interplexiform ACs and SCGN-, CR-, CB-, and PV-stained cell bodies in the deep inner nuclear layer (INL) or ganglion cell layer (GCL) were traced by using Neurolucida (version 11; MBF Bioscience Europe, Magdeburg, Germany) from image stacks. For estimations of the total number of cells in the deep INL or GCL, 4,6-diamidino-2-phenolindole (DAPI)-stained nuclei were also counted. Size measurements were carried out at the level of the greatest somal cross-sectional area on Z-stacks.
Results
In this study, multiple-label immunohistochemistry, Neurolucida reconstructions and intracellular LY tracer injections were carried out to characterise human retinal neurons that synthesise one or more of the CaBPs, including CaR, CaB, PV and the recently characterised protein, SCGN.
CaR-immunopositive human retinal neurons
CaR-immunopositive (CaR+) human retinal neurons were characterised very recently by Lee and colleagues (2016). CaR immunopositivity was shown by AII AC, semilunar type 1 and stellate varicose type (Kolb et al. 1992) wide-field ACs, semilunar type 1, 2 and 3 displaced ACs, and stellate varicose and thorny type displaced ACs. In addition, a cohort of GCs including G17 cells (Kolb et al. 1992), small bistratified cells (Dacey 1993) and large-field bistratified ganglion cells (Peterson and Dacey 2000) also displayed CaR immunopositivity. In this study, the anti-CaR serum mainly stained ACs with cell bodies in the INL and GCs and displaced ACs in the GCL, in the human retina (Fig. 1a-c). Contrary to the dense CaR+ plexus in the inner plexiform layer (IPL), two distinct subpopulations of the CaR+ ACs were clearly distinguished. Cells of the more frequent subpopulation showed a medium-sized soma (8–10 μm in diameter; n = 8 AII cells reconstructed in Neurolucida-displayed cell bodies of 9.4 μm ± 1.34 SD in diameter; see also Supplemental Table 1 for further morphometric data), a primary dendritic stalk, and two sets of dendritic processes. The proximally located, short dendrites showed lobular endings in the OFF sublamina (Fig. 1b, d, j), whereas those that branched distally ran diagonally and terminated deep in the ON sublamina (Fig. 1b, d, k). This bistratified morphology was consistent with descriptions of AII ACs in other mammalian species (Völgyi et al. 1997; Mills and Massey 1998). Neurolucida reconstructions also confirmed that these CaR+ ACs were AII cells. In addition to AII cells, another less frequent AC population also showed CaR immunopositivity (Fig. 1b–d). This type of AC displayed a large cell body (12–15 μm in diameter) and 2–4 visible primary dendrites that ran either laterally or diagonally. The diagonal dendrites often crossed the entire IPL and targeted middle or innermost IPL areas. The identity of this AC type is unclear; however, these cells resembled tristratified primate A19 cells (Kolb et al. 1992) and stellate cells (Lee et al. 2016). Other CaR+ cells clearly displayed somewhat elliptic soma and two thick primary dendrites that emerged at the opposite sides of the soma, a characteristic of human semilunar cells (Lee et al. 2016). Some of the detected wide-field cells maintained their dendrites close to the INL/IPL border, thus posing the possibility that they might be stellate type 1 cells (Fig. 1i; Kolb et al. 1992; Lee et al. 2016). Varicose or tortuous dendrites were not detected; therefore, we were uncertain as to whether our sample contained the previously described, CaR+ thorny cells (Kolb et al. 1992; Lee et al. 2016). Apart from the frequently observed CaR+ cell types, we also encountered rare CaR+ BCs and interplexiform cells (Fig. 1e-g) with medium-sized somata (8.9 μm ± 0.76 SD in diameter; n = 4) . When whole-mount samples were examined, fine CaR+ axon-like processes were evident in the outer plexiform layer (OPL) and ran long distances laterally (several hundreds of micrometers). These axons bore many small beadings and sometimes crossed each other forming a loose mesh in the OPL (Fig. 1h). We also observed a few thicker processes that were more confined spatially (total axonal length: 139.2 μm ± 23.1 SD; n = 4; see also Supplemental Table 1 for further morphometric data). These latter processes possessed beadings and, at first, they appeared to be BC dendrites. However, when Neurolucida reconstructions were performed, the processes were traced back to the somata of interplexiform cells (Fig. 1g). Unfortunately, we were unable to trace the thin axon-like processes and, thus, their identity remains unclear. The somata of the interplexiform cells were located in the proximal INL from which many primary dendrites emerged and entered the IPL. The dense CaR+ meshwork in the IPL prevented us fully tracing the dendrites of the interplexiform cells and, hence, only their proximal dendritic branches are shown in Fig. 1g (some morphometric data on incomplete dendritic processes are shown in Supplemental Table 1). The primary dendrites possessed swellings and branched occasionally. The CaR+ interplexiform cells in this study appeared to send processes to various IPL strata (Fig. 1f, g), similar to the tristratified interplexiform cells described previously in the human retina (Kolb et al. 1992). The observed CaR+ BCs displayed a rare occurence, namely a sparse dendritic tree and frequent dendritic blobs (Mariani 1984; Kolb et al. 1992). CaR+ BCs appeared to receive inputs from neighbouring cones and to form invaginations with presynaptic cone pedicles (see below). The precise identity of this particular BC is uncertain, as no similar human BC descriptions were found in previous studies (Mariani 1984; Kolb et al. 1992; Haverkamp et al. 2003).

a–c Overview of calretinin (CaR) immunoreactivity in the human retina. CaR immunoreactivity delineated amacrine cell somata in the inner nuclear layer (INL) and ganglion cell layer (GCL); processes in the inner plexiform layer (IPL) were arranged in three strongly stained strata, with ganglion cell (GC) bodies and axons in the GCL and the neurofibre layer (NFL), respectively. Most ACs belonged to the AII population, with a medium-sized soma (arrow in b), stout dendritic stalk, lobular appendages and processes that could be traced to the deepest part of the IPL. Larger CaR-immunopositive (CaR+) somata (open arrows in b, c) were also detected and, when discernible, displayed wide-field morphology. d Neurolucida reconstruction of CaR+ ACs clearly showed either the classical AII AC morphology (left) with lobular (solid arrow) and transverse (dashed arrow) processes or wide-field (WF) AC morphology (right) with both ON (solid arrow) and OFF (dashed arrow) stratifying processes. Note that only proximal processes of wide-field cells could be traced, whereas distal portions (grey arrowheads) were intermingled with other CaR+ processes in the IPL and could not be traced. e Occasionally, cells showing BC morphology were also encountered (ONL outer nuclear layer, OPL outer plexiform layer). These CaR+ BCs possessed elongated somata in the middle of the INL and dendrites that bore blob-like endings (open arrow). f, g In addition to ACs and BCs, some cell bodies displayed two sets of processes: one that entered the IPL and arbourised in various IPL strata and another that emerged from the distal portion of the soma, crossed the INL and stratified in the OPL (open arrows). OPL fibres of these cells often displayed swellings. These characteristics resembled those of interplexiform cells. Two examples of these interplexiform cells are shown as Neurolucida reconstructions (g). Note that the drawings were confined to only proximal IPL processes. These dendrites clearly continued but could not be followed further for reconstruction (grey arrowheads). h. Image from a whole-mount retina displaying thin axon-like fibres (arrows) and thicker and shorter processes (open arrows) in the OPL. Thicker processes had many swellings on their surface and could be traced back to interplexiform somata. In contrast, the thin fibres could not be traced and, thus, their identity is uncertain. i–k Somata of medium-sized AII (arrows) and large wide-field cells (open arrow) could be readily distinguished in the whole-mount specimen (i). Both lobular appendages (j) and transverse processes (k) of AII cells could be found in the OFF and ON sublaminae of the IPL, respectively. l, m In the GCL, anti-CaR serum stained both small (open arrows) and large (arrows) cell bodies. Some of the larger cells displayed thick primary dendrites (l) and axons that entered the NFL and, thus, they were likely to be GCs, whereas the smaller somata belonged to displaced ACs. Bars 10 μm (a-g, i-m), 20 μm (h)
Other than ACs, we also visualised CaR-expressing GCs whose dendritic arbour could be revealed partially. The CaR+ ganglion cell in Fig. 1 had four stout primary dendrites that displayed only a few branch-points. The dendrites were straight, ran radially and stayed in the ON sublamina of the IPL. Among the previously described CaR-expressing human GCs, they most closely resembled the bistratified GCs (Kolb et al. 1992; Lee et al. 2016). In contrast to these well-visualised GCs, dendritic branches of many CaR+ GCL cells could not be followed and, thus, we are uncertain whether all CaR-expressing cells shared the small bistratified morphology or represented other CaR+ GC types altogether. Indeed, some CaR+ cell bodies in the GCL were rather small (8–12 μm in diameter; Fig. 1m) and the population probably comprised a mixture of GCs and the previously described semilunar type 1, 2 and 3, stellate varicose and thorny type displaced ACs (Kolb et al. 1992; Lee et al. 2016).
CaB+ human retinal neurons
In the primate and human retina, CaB is expressed in cones, HCs, a subset of ACs, DB3 flat diffuse OFF cone BCs and DB5 BCs and in non-primate ON invaginating diffuse BCs (Massey and Mills 1996; Grünert et al. 1994; Haverkamp et al. 2003). In the human specimens, our anti-CaB sera revealed labelling similar to those that we have recently described in a previous study (see Kántor et al. 2015a for photoreceptor and BC descriptions). Furthermore, we found CaB-expressing HCs in both retinal sections and whole-mount specimens (Fig. 2a-c). Interestingly, round HC somata, proximal dendritic segments and thin delicate axon-like HC processes were readily observed but the anti-CaB serum rarely stained thicker dendritic processes (Fig. 2a-c; see also below). Similar to CaR, CaB was expressed in the inner retina by a cohort of ACs. The majority of these CaB+ ACs displayed AII morphology, including a round soma, a bistratified dendritic arbour with OFF lobular and ON transversal processes (Fig. 2d-f). Apart from small-field AII cells, larger AC bodies (12–15 μm in diameter) were also detected in the CaB-immunolabelled specimen (Fig. 2a, b, d, g, h). On multiple occasions, only the proximal dendrites were discernible but sometimes the thick, laterally running processes could be followed for dozens of micrometers (Fig. 2g, h). Clearly, these cells displayed characteristics of wide-field ACs and, in many ways, resembled stellate and semilunar cells of the human retina (Lee et al. 2016). These similarities included a large soma, two to four smooth primary dendrites, sparse branching and a large dendritic tree. The GCL displayed many CaB-immunoreactive cell bodies with a variety of sizes, indicating that both GCs and displaced ACs expressed CaB. We found that CaB+ somata were either extremely small (7–9 μm in diameter) or huge (15–22 μm in diameter; Fig. 2i). This observation suggested that the small cell bodies were displaced ACs. This was supported by the lack of obvious axonal processes emitted from the small CaB+ somata. The large CaB+ cell bodies, on the other hand, were amongst the largest in the GLC and displayed emerging axons (Fig. 2i). CaB-labelled GC axons entered the neurofibre layer (NFL) and bundled together, attesting that at least some of the CaB+ cells in the GCL were GCs.

a Micrograph of a human retinal section showing calbindin (CaB)-immunoreactive neuronal elements, including cones, horizontal cells (HCs), ACs and somata in the GCL. Inset Whole-mount retina with the focus on the cell bodies of cone photoreceptors (green). The differential interference contrast (DIC) image of the same retinal region is overlaid on the fluorescent photomicrograph to show that surrounding rods are negative for CaB. b In the INL, CaB was expressed by BCs and by ACs with either medium-sized (arrow) and large (open arrow) somata. c Photomicrograph showing a whole-mount specimen with the focus on the OPL/INL border in which HC somata, slender axon-like processes (arrow in inset) and a few thicker proximal dendrites (open arrow in inset) are apparent. d–h Images of the whole-mount retina with the focus on the proximal INL (e), the OFF sublamina (f) and the ON sublamina (g) of the IPL. In the INL, medium-sized somata (arrow) appear to emit single dendritic stalks that display lobular dendritic branches in the distal IPL (f) and transverse processes in the OFF sublamina (g). In addition to AII cells, larger AC somata are also discernible in the INL (open arrow in g), whose thick, laterally running proximal dendrites were also stained (b, g, h). g, h Photomicrographs displaying examples of wide-field CaB+ ACs that resemble stellate (g) and semilunar (h) ACs of the human retina. i In the GCL, CaB immunoreactivity was observed in both small (arrow) and large somata (open arrows). Larger CaB+ cells often displayed axons that entered the NFL and, thus, were clearly GCs. By contrast, we could not find clear evidence regarding axonal processes of small CaB+ neurons. Bars 10 μm (5 μm in inset)
PV distribution in human retina
We observed PV-immunolabelled neurons in both the outer and inner retina, including HCs, BCs, ACs and cells in the GCL (Fig. 3a, b). HCs appeared completely labelled by the PV antiserum in both whole-mounts and sections, with somata, thick dendritic and thin axonal processes and distally protruding lollipop endings being readily observed (Fig. 3a-c; see also below). PV+ BCs formed a relatively sparse population (Fig. 3j, k). The PV+ BC somata (8.7 μm ± 0.9 SD in diameter; n = 12) showed a characteristic elongated conical shape and were localised in the distalmost INL. Because of the distal cell body location, the PV+ BCs did not show extended primary dendrites reaching out towards the OPL. Instead, these dendrites entered the OPL immediately after their origin and intermingled with the PV+ HC processes. The axons of the PV+ BCs entered the IPL, arbourised first in the OFF sublamina of the IPL (Fig. 3a, b, j-l), and then extended horizontally several tens of micrometers (total axonal length: 203.7 μm ± 81 SD; n = 12). In addition to axons in the OFF sublamina, many PV+ BCs displayed axonal branches that reached the middle and even deep ON sublaminar IPL areas. This dendro-somatic architecture is also apparent in the Neurolucida reconstructions (Fig. 3l). Based on these features, the PV+ BCs could not be identified among the BCs described by Haverkamp and collagues (2003) but showed similarity to the giant diffuse or giant bistratified BCs described earlier by Kolb and colleagues (1992). Similarities included the long-spanning axonal processes, the largely bistratified axonal morphology (strata 1 and ~3/4) and the somewhat asymmetric layout of axonal terminals in the IPL (Fig. 3h-l). Lower power micrographs showed that axon terminals of these BCs tiled the retina economically without much overlap, indicating that they were representatives of a single cell type.

a, b PV-immunoreactivity in the human outer retina was found in HCs, BCs (open arrows), ACs and GCs. PV+ BCs showed a cell body in the outermost INL, in the vicinity of the OPL. Dendrites could not be discerned but their long axons entered the IPL and branched out in various IPL strata. c Enlarged image showing HC somata and processes in the OPL. HC dendrites displayed lollipop-like dendritic endings. d–i Consecutive focal plane images of the same frame in a Z-stack (arrows in d–f soma of a PV-expressing BC, arrows in g–i axon-axon terminal region of a PV-expressing BC). j, k Overview (j) and a magnified frame (k) showing the coverage of BC axonal trees. BC axons often showed a single thicker (open arrows) and several thinner branches. l Neurolucida reconstruction of PV BCs displaying the soma, axon and axonal arbour of these BCs; the dendrites could not be traced because of the PV-labelling density in the OPL. Bars 10 μm (20 μm in j)
In addition to HCs and BCs, PV was expressed by both ACs and GCs in the inner retina (Fig. 4). Interestingly, ACs with somata in the INL were labelled strongly and appeared to be more numerous in some of the specimens (Fig. 4c) but were relatively weakly labelled and scarcer in others (Fig. 4a, b). This discrepancy in inner retinal staining clearly depended on the primary anti-PV serum that we used. The goat anti-PV serum from Sigma resulted in weaker and more selective staining, whereas the goat anti-PV serum from SWANT and the mouse anti-PV serum from Sigma labelled the same population of cells and many more ACs in the inner retina. We decided to present results from all four antibodies, because the second and third sera probably stained all PV-expressing retinal cells, whereas the first serum provided more information on the dendritic morphology of the few selectively stained neurons. A characteristic type of AC, whose soma might be located in either conventional or in displaced locations, showed a medium- to large-sized (11–14 μm in diameter) round soma and dendrites that radiated from the soma in a star-like fashion that bi- or tristratified in the IPL in strata 1, 3 and 5 (Fig. 4a-d). This AC was labelled with all PV sera and showed the strongest PV-positivity in the inner retina in all labelled specimens. In the GCL, a mixed neuron population appeared to be PV+. In addition to PV+ GCs, we also observed putative displaced ACs with smaller somata in the GCL (8–12 μm in diameter; Fig. 4e, f). The high number of PV+ cells in the GCL suggested that, similar to the monkey retina (Kolb et al. 2002), the majority of GCL cells expressed PV. Other than immunolabelling, we also performed LY intracellular injections into GC somata in PFA-fixed retinal tissue (see Materials and Methods) and carried out subsequent immunolabelling for one or more CaBPs. Injected GCs frequently displayed positivity for PV and we could identify the soma-dendritic morphology of the labelled cell. Following this procedure, we identified a PV+ OFF GC with a round soma and 3–5 stout primary dendrites that branched relatively far from the soma. Branching was occasional and branch-overlaps were rare. Higher order branches were beaded and terminal dendrites reached deep into the OFF strata (Fig. 4g-j). These features clearly identified this type of GC as an OFF parasol cell in the human and the primate retina (Kolb et al. 1992; Dacey et al. 2003). In the same specimen, a number of uninjected surrounding PV+ GCs shared similar soma-dendritic morphology with the injected OFF parasol cell (Fig. 4h, i). Dendritic arbours of both the injected and other PV+ parasol cells tiled the retinal surface economically with marginal overlap suggesting further that they represented neurons of the same cell type. OFF parasol cells displayed an interesting feature in our specimens, as their beaded higher order dendrites often displayed intimate proximity with CaB+ AII lobular appendages in LY/PV/CaB-labelled specimens (Fig. 4j). This suggested that OFF parasol cells received direct glycinergic AII AC input, similar to mouse OFF alpha GCs (Liu et al. 2010).

a, b Retinal cross sections displaying PV-immunoreactive neurons, including characteristic ACs, whose somata could be located either in the INL (b) or displaced to the GCL (a), thereby forming a mirror-symmetric pair. Dendrites of both the AC and the displaced ACs displayed medium-field or wide-field morphology. They were found throughout the IPL but the most pronounced processes were detected in the distal-most and the proximal-most IPL strata. c, d Images focused on the INL (c), with many PV+ AC somata (open arrow in c soma appears to be of the medium-field AC type shown in b). The dendrites of this same AC radiate from the soma and give off a few branches (open arrow in d). e, f In the GCL, many somata were found to express PV. Based on the variety of the soma sizes, some of them appeared as displaced ACs, whereas others were large and emitted axons, making them more likely to be GCs. g, h Photomicrographs displaying a specimen in which Lucifer Yellow (LY) injection (green) and CaB (red) and PV (blue) immunostaining were combined. The LY-injected GC displayed a large ovoid soma (g, see also insets, asterisk in h), four stout and smooth primary dendrites, and a large dendritic tree that stratified in the OFF sublamina. The main dendrites branched out relatively far from the soma. The higher order dendrites were beaded and protruded deep into the OFF layer. This GC was identified as an OFF parasol GC. Unfilled PV-labelled GCs with similar somatic (white asterisk in i) and dendritic (arrows in i) morphology were also visible. Furthermore, axonal bundles and other (not injected) small and large cell bodies were labelled for PV, whereas smaller cells often also contained CaB-immunoreactivity. j CaB-labelled processes were often found to be in intimate contact with filled dendritic branches (arrows in j), suggesting the presence of putative synaptic contacts between CaB+ AII lobular appendages and LY-labelled GC dendrites. Bars 10 μm
SCGN distribution in human retina
SCGN is a recently discovered EF-hand Ca2+-buffer protein that has been shown to be expressed by neurons of several brain loci (Gartner et al. 2001). In the monkey retina, SCGN has been found in a subpopulation of ACs that possess tortuous dendrites and middle-field dendritic arbour morphology (Weltzien et al. 2014, 2015).
We mostly observed ACs with large cell bodies (12–15 μm in diameter) located either in the INL or displaced to the GCL and showing no apparent sign of axons running in the NFL towards the optic disk (Fig. 5a, e–g). SCGN-labelled dendritic processes arbourised mostly in the middle of the IPL (strata 2, 3 and 4); however, sparse processes could also be seen in strata 1 to 5, with some fibres transiently entering the GCL or forming OPL-targeting interplexiform fibres (Fig. 5g-j). When whole-mount specimens were examined, SCGN+ ACs displayed smooth thick dendrites and thin beaded axon-like SCGN processes (Fig. 5k, l). These processes were clearly different from the varicose and spiny dendrites described in the case of SCGN+ ACs of the monkey retina (Weltzien et al. 2015). The axon-like processes instead resembled polyaxonal cell neurites described in various other mammals (Stafford and Dacey 1997; Famiglietti 1992a, 1992b; Völgyi et al. 2001) and were observed in the middle of the IPL or were seen meandering either in proximal or in distal IPL strata (Fig. 5g-j). In addition to the AC labels, SCGN was also expressed in rod photoreceptors, where the strongest SCGN-labelling was observed in the outer segments. This observation was reinforced by our rod-opsin (rOp) counterlabellings, where we only found rOP/SCGN dual-labelled photoreceptors (Fig. 5a-d).

a–d Micrographs showing secretagogin (SCGN)-immunoreactivity in the human retina. SCGN-immunoreactivity was found in ACs (open arrow) and rod photoreceptors (arrow). This latter observation was confirmed by the co-expression of rhodopsin (rOp) and SCGN. The high magnification image in d shows that virtually all outer segments of rod photoreceptors display SCGN-immunopositivity. e, f In addition to rods, SCGN was expressed by ACs (arrow) and also by displaced ACs whose processes formed a dense meshwork throughout the IPL, with clear dominance in the middle of the IPL. g–j Some of the ACs emitted thin axon-like fibres that ran towards the OPL (h, j), indicating that at least a portion of the SCGN AC population was a group of interplexiform cells. In addition to the interplexiform processes, a few thin axon-like fibres (arrows) that were located more proximally were seen entering the GCL and even the NFL, overall following a tortuous course before turning back to the IPL, but not once bundled with ganglion cell axons. k, l In whole-mount material, the SCGN ACs displayed one or two thick dendrites that possessed only a few branch-points and ran laterally in the IPL. Thin SCGN+ axon-like processes were also observed in the same focal plane. Bars 10 μm
Colocalisation of multiple Ca-buffering proteins
In order to further characterise CaBP-expressing neurons, we performed double-, triple- and quadruple-labelling experiments for the tested proteins. Although, none of the examined retinal neuron populations expressed all four CaBPs at once (Fig. 6), we encountered a few populations that expressed three out of the four markers. We counted the number of multiple-labelled cell bodies in two nuclear layers (INL, GCL) in low power micrographs and found that less than half of the neurons expressed only one marker, whereas most inner retinal neurons were positive for more than one CaBP. Single labelled neurons of the INL were CaR+ (24 %), CaB+ (18 %), PV+ (1.6 %) and SCGN+ (1.6 %). In the GCL, we found considerably fewer single-labelled cells; CaR+ (9.2 %), CaB+ (0.85 %) and PV+ (0.17 %). We encountered somewhat fewer dually immunostained cells in the INL, including CaR+/CaB+ (8.4 %), CaR+/PV+ (6.6 %), CaB+/PV+ (4.2 %) and SCGN+/CaR+ (0.65 %). In contrast, the dually immunostained population was largest in the GCL, including the populous CaR+/PV+ (66 %) and CaB+/PV+ (11 %) groups and the more sparse CaR+/CaB+ (4.3 %) and SCGN+/CaR+ (1.4 %) subpopulations. Finally, triple-labelled cells formed a relatively large population, including CaR+/CaB+/PV+ (34 % in INL, 7 % in GCL) and SCGN+/CaR+/PV+ (0.16 % in INL, 9.2 % in GCL) cells. Next, we performed a thorough examination to identify cell types within the above populations.

a–e Image sets displaying quadruple immunoreaction in the human retina: CaR (green), CaB (red), PV (magenta) and SCGN (blue). In each case, the focus was set on the level of the INL (a-a’’’’), IPL (b-b’’’’), parafoveal GCL (c-c’’’’) and midperipheral GCL (d-d’’’’). The same quadruple-labelling was carried out on retinal cross-sections (e-e’’’’). No cells contained all four CaBPs. Several cells displayed CaR-, CB- and PV-immunoreactivity (arrows) in the INL. Various dual co-localisations and single CaBP expression were also detected in somata in the INL (a) and in their dendrites (b) in the IPL. In the GCL (c, d), the majority of cells contained both CaR and PV, and a few large cells expressed either CaB or CaR. f–h Neurolucida mapping of soma outlines at their largest diameter in the INL (f) and parafoveal (g) and midperipheral (h) GCL. Bars 10 μm. i Colour codes are indicated by the pie chart, which displays the relative frequency of the observed neuron populations in the INL (top left) and in the GCL (bottom right). j Average somatic cross-sectional area sizes of the neurochemically characterised neuron populations in the INL (top) and GCL (bottom)
-
1.
CaR/CaB/PV colocalisation. We found that the most numerous cells belonged to the CaR/CaB/PV-stained population in the INL (Fig. 6a, f). Cells in this group displayed small- or medium-sized somata (40.2 μm2 ± 7.9 SD; n = 211). The medium-sized soma and the frequency of this population suggested that it included AII ACs. Indeed, we found that not only AII somata, but also many lobular appendages showed triple-labelling (Fig. 6b, Fig.7a-h). Interestingly, when lobular appendages were examined closely, we found that they varied in their labelling patterns, with the largest (1–1.5 μm in diameter) being strongly labelled for CaB but weakly stained or unstained for CaR and PV, whereas medium- and small-sized lobular endings (<1 μm in diameter) were triple-, double- or single-labelled with the three proteins (Fig. 7e-h). A similar, but less prominent, phenomenon was also observed for CaR and CaB labelling in AII transverse dendrites (Fig. 7d). The frequency of somata and the relatively low SD values indicated that the CaR+/CaB+/PV+ population in the INL was formed solely by AII cells. In contrast, CaR+/CaB+/PV+ cells in the GCL displayed medium-sized or small somata (70 μm2 ± 46 SD; n = 41). The high SD value suggested that this population contained more than one cell type. This was supported by the finding that cell bodies in this population tended to occur in pairs or in smaller groups in the GCL. The size of CaR+/CaB+/PV+ cells in the GCL was small; therefore, these cells were most likely displaced ACs. However, they could not be further identified.
Fig. 7 
a–d CaR (red) and CaB (blue) co-expression in AII ACs can be detected at the level of the somata in the INL (a, b), in the OFF sublamina of the IPL (c) containing the lobular appendages, and in the ON sublamina (d) containing AII transverse processes. However, labelling of the two proteins did not overlap entirely, suggesting a compartmentalised distribution. e–h Images showing the same frame and focusing on the OFF sublamina of the IPL in which AII cell lobular appendages can be observed. Interestingly, CaR (green), CaB (red) and PV (blue) are expressed by AII cells but they display a slightly different distributional pattern in AII lobular appendages. Whereas some lobular endings contain all three proteins (arrows), others are labelled only for two CaBPs (open arrows) or only for one of them. i–k The previously characterised medium-field PV-expressing (blue) AC is also labelled with the anti-CaB antiserum (red). Interestingly, only the soma appears to be dually stained, whereas dendrites of this AC are purely PV+. l–o An example of a PV- (not stained blue) but CaB+ (green) GC in CaB/PV dually stained material. This cell displays a medium-sized and round soma and smooth primary dendrites that branch out sparsely (l-n single optical sections). A collapsed image of a Z-stack (o) shows that dendrites of this CaB+ GC reach distal IPL areas (OFF sublamina) in which the AC somata are visible. Clearly, this CaB+ GC displays an OFF stratification pattern. p Micrograph combined from a DIC image and a CaB/PV dually stained image of the same frame, focusing on the GCL. Co-localisation was found in somata of displaced AC bodies (arrow), whereas most visible GCs were PV+ (open arrow). Bars 10 μm
-
2.
SCGN/CaR/PV colocalisation. The only triple-labelled cell apart from the above population was a single cell (n = 1; 0.16 %) that lay in the INL and that expressed SCGN, CaR and PV. However, its morphology could not be determined.
-
3.
CaB/PV colocalisation. The most apparent dually stained cells were the CaB/PV-expressing HCs in the outer retina (Fig. 8a-g). However, a clear distinction could be made between the two labels, as CaB was primarily found in the soma and fine axonal processes, whereas PV mainly stained the peripheral somatic cytoplasm and dendritic regions (Fig. 8d-g). Lollipop-like endings were also purely PV+ and lacked any CaB staining (Fig. 8a-c). In addition to dually labelled HCs, single-labelled PV+ HCs were also found whose morpholgy seemed similar to their double-labelled counterparts. Other than HCs, we found a few dually labelled cell populations in the inner retina. CaB+/PV+ cells possessed small somata both in the INL (30.7 μm2 ± 9.8 SD; n = 26) and in the GCL (42 μm2 ± 33.7 SD; n = 65). One prominent CaB+/PV+ AC was a tristratified medium-field PV+ AC (see above). This AC contributed to both the INL and the GCL subpopulation of CaB+/PV+ cells. Its labelling displayed compartment specificity, as PV labelling was strong in both the soma and the dendrites but CaB staining was retained in the cell body (Fig. 7i-m). The low SD value (SD = ± 9.81, n = 26) suggested that CaB/PV+ cells formed a homogeneous population in the INL, whereas the CaB/PV+ group was probably heterogeneous in the GCL (SD = ± 33.79, n = 65; see also both small and large somata in Fig. 6h).
Fig. 8 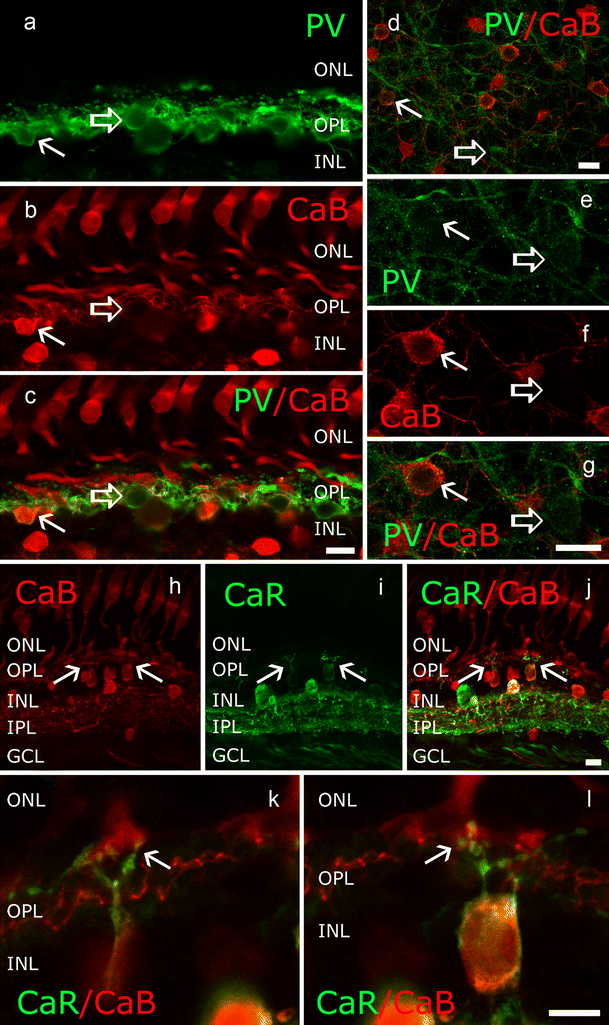
a–c CaB (red) and PV (green) co-expression in HC somata (arrow) and processes; a few HCs appear to express only PV (open arrow). d–g In a whole-mount specimen, both double-labelled HC somata (arrow) and solely PV-expressing somata (open arrow) are visible. Interestingly, thinner axons are CaB-positive, whereas PV is expressed in HC dendrites. Moreover, lollipop dendritic endings were only labelled with the anti-PV antiserum and show close apposition to CaB+ cone pedicles (c). h–l Cross sections showing that CaR and CaB are co-expressed in the BC population. The blob-like dendritic endings of these BCs clearly form invaginating contacts with CaB+ cone pedicles (arrows) and, thus, they correspond to a population of ON cone BCs. Bars 10 μm (a-j), 5 μm (k, l)
-
4.
SCGN/CaR colocalisation. Another dually labelled cell population contained cells with large (95.9 μm2 ± 73.8 SD; n = 4) somata in the INL and in the GCL (102.8 μm2 ± 55.3 SD; n = 8). The SCGN+/CaR+ AC cell bodies were partially embedded in the distal IPL (Figs. 5, 6, see also below) and seemed to form mirror-symmetric counterparts with displaced SCGN+/CaR+ cells (Fig. 6e). When we examined these cells, they displayed a wide-field morphology with stout and smooth primary dendrites. The high area SD values reflected a great variety in soma size, indicating that both the INL and GCL subpopulations of SCGN+/CaR+ cells were heterogeneous. One cell type in the SCGN+/CaR+ population was further characterised and identified (see below).
-
5.
CaR/CaB colocalisation. A number of small- or medium-sized neuron somata co-expressed CaR and CaB in the human inner retina in both the INL (30.9 μm2 ± 7.3 SD; n = 52) and the GCL (55.8 μm2 ± 43.9 SD; n = 25). Among the CaR/CaB dually stained cells, we identified a BC population whose morphology was described above (see also Fig. 1). In the CaR/CaB-stained material, these BCs clearly showed blob-like dendritic endings that opposed to CaB+ cone pedicles (Fig. 7h-l). Although the stratification of the axonal terminal of this BC in the IPL could not be detected, the putative postsynaptic dendritic endings seemed to partake in invaginating synapses suggesting that they were ON BCs. These CaR+/CaB+ BCs seemed to collect inputs from multiple nearby cones. In addition to this otherwise infrequent BC, other ACs, displaced ACs, and perhaps small GCs also co-expressed CaR and CaB, but their identity remained unclear.
-
6.
CaR/PV colocalisation. In addition to the above listed cells, we found CaR/PV dually stained neurons that comprised some of the largest cell bodies in both the INL (66.9 μm2 ± 22.5 SD; n = 41) and GCL (123.8 μm2 ± 47.0 SD; n = 389). Although the number of CaR+/PV+ cells in the INL was relatively low, CaR+/PV+ cells formed the largest neuron population in the GCL, two thirds of the cells in this layer showing CaR and PV immunopositivity. The low occurence and low SD value of the CaR/PV cells in the INL suggests that this population is homogeneous, whereas the CaR+/PV+ GCL cells certainly form a highly diverse group that contains many different GCs and perhaps even displaced ACs. The identity of the cells in both subpopulations remains unclear (Fig. 6, see also below).
-
7.
CaR-labelled neurons. CaR+ neurons formed a sizeable population in both cellular layers. Whereas CaR+ neurons in the GCL had relatively large cell bodies (80.7 μm2 ± 33 SD; n = 54), their INL counterparts had rather small somata (29.7 μm2 ± 8.3 SD; n = 149). The morphology of these neurons could not be examined and, thus, the identity of the CaR-expressing cells in both the INL and GCL is yet to be determined.
-
8.
CaB-labelled neurons. CaB+ single-labelled AC bodies were small (31.1 μm2 ± 13.4 SD; n = 113) and formed a sizeable (as previous) population in the INL. In the GCL, however, single CaB-expressing cells displayed large somata and were rare (115.2 μm2 ± 102.8 SD; n = 5). Some of the CaB-labelled somata in the INL were in fact CaB+ BC bodies, whereas the rare CaB-expressing large somata in the GCL were certainly GCs. One such CaB+ GC with a large soma and a sparse dendritic arbour with OFF sublamina stratification is shown in Fig. 7. Further work is necessary to describe the somatic and dendritic morphology of both CaB+ cell populations. Finally, we encountered a few CaB+ ACs that displayed morphological features similar to those of stellate and semilunar cells of the human retina (Fig. 2g, h; Lee et al. 2016). These morphological features included a large soma (12–15 μm in diameter), two to four smooth primary dendrites, and a large, sparsely branching dendritic arbour (Fig. 2).
-
9.
PV-labelled neurons. Only a small fraction of cells displayed PV immunopositivity alone in the INL (43.2 μm2 ± 16.4 SD; n = 10) and we found only one example in the GCL (65.7 μm2, n = 1). The identity of the PV+ ACs in the INL is uncertain. We injected LY into a PV-expressing GC (see above) whose somato-dendritic morphology was identical to that of parasol GCs (Kolb et al. 1992; Fig. 4g-j). However, the occurrence of parasol cells is expected to be considerably higher than that of the sole PV-labelled GC found here. Thus, we suspect that parasol GCs comprise one of the other PV+ populations. As we found no evidence of CaB positivity in parasol cells (Fig. 4g-j), we hypothesise that they are among the cells of the more numerous CaR+/PV+ population.


SCGN is present in TH-positive ACs
SCGN-expressing ACs showed morphological features that somewhat resembled those of TH-expressing ACs in the mammalian retina. These morphological features included the large soma (12–15 μm in diameter) positioned in the very proximal INL, horizontally running processes in stratum 1 and a dense dendritic/axonal meshwork of processes throughout the IPL. To examine whether SCGN ACs were TH+, we performed SCGN/TH dual-staining experiments. As expected, we observed dually stained somata in the INL and double-labelled fibres in the IPL (Fig. 9). The co-localisation of TH and SCGN, however, was partial, as in addition to the TH/SCGN+ cells, we found TH+ but SCGN- plus TH- and SCGN+ ACs. Another characteristic feature of the TH/SCGN labeling was that only the soma and the primary dendrite of TH+ cells displayed SCGN-positivity, whereas fine TH+ axonal endings appeared to be SCGN-negative (Figs. 9, 10). Perisomatic TH+ rings that formed presynaptic surfaces around AII and other non-AII amacrine cells were also negative for SCGN (Voigt and Wässle 1987; Witkovsky 2004; Völgyi et al. 2014; Debertin et al. 2015). Finally, SCGN+/TH+ ACs were found also to contain CaR but remained negative for CaB (Fig. 10). This identified this cell type as the SCGN+/CaR+ AC, with a cell body located within the INL, as described above.

a–c SCGN/TH double-labelling in the human whole-mount retina, with the focus on the INL/IPL border. The lower magnification image (a) shows that TH+ (red) and SCGN+ (green) wide-field ACs formed partially overlapping populations. Some ACs with large soma and 2–3 thick, horizontally running primary dendrites expressed both SCGN and TH (asterisks in b–d), whereas single SCGN-labelled (open arrows) and TH-labelled (arrows) cells were also detected. Interestingly, dual staining was confined to some somata and thicker dendritic processes, whereas thinner TH+ axonal fibres appeared negative for SCGN-staining. Bars 50 μm (a), 20 μm (b-d)

a–c TH (green), CaB (red), CaR (magenta) and SCGN (blue) quadruple-labelling in the whole-mount (a-a’’’’, b-b’’’’) retina and cross-sections (c-c’’’’). SCGN+ cells often showed positivity for TH and CaR (arrows) in the INL (a, a’’- a’’’’; b, b’’–b’’’’). Interestingly, rarely observed displaced TH+ cells also showed positivity for SCGN and CaR (c, c’’–c’’’’; arrows). d–h TH (green), CaB (red), CaR (magenta) and SCGN (blue) labelling. In some TH cells (arrows), SCGN- and CaR-immunoreactivity was present in the soma and proximal dendrites (arrows in h) but not in fine axonal processes (open arrows in h). Bars 10 μm
Discussion
Identification of CaBP-labelled human retinal neurons
A combination of multiple-label immunohistochemistry, Neurolucida reconstruction and LY intracellular injection experiments revealed cells that synthesise one or more CaBPs known to act intracellularly. Whereas previous studies have reported CaR, CaB or PV positivity in human retinal neurons (Haverkamp et al. 2003; Lee et al. 2016), to our knowledge, this is the first description of SCGN expression in the human retina. Moreover, this study gives the most detailed comprehensive description of CaBP colocalisation in human retinal neurons (Table 2).
Some of the observed neurons were clearly identified based on their somatic-dendritic morphologies. The CaBP-profile of the human outer retina was relatively simple, as all rod photoreceptors expressed SCGN, and cone photoreceptors expressed CaB. No sign of CaR or PV label was found in photoreceptors. According to our previous descriptions, the CaB-expressing cones were a mixture of L/M- and S-cones in the human retina (Haley et al. 1995; Kántor et al. 2015a). Human HCs appeared either to be PV+ or co-expressed CaB and PV with a spatially distinct distribution of the two labels. CaB was primarily found in the soma and fine axonal processes, whereas PV mainly stained the peripheral somatic cytosol, dendrites in their entire lengths from primary branches to their endings and lollipop-like terminals. In addition to dual-labelled HCs, single-labelled PV+ HCs were also found whose overall morphology seemed similar to their double-labelled counterparts. Based on Golgi-staining, three subtypes of HCs have been described in the human retina (Kolb et al. 1992); the CaB/PV dual-labelled cells might belong to the slender HII cells, whereas the PV-stained HCs might be equivalent to HI HCs that possess thicker dendrites and larger lollipop profiles.
We have encountered at least three BC populations that express CaBPs. Two populations are the CaB-expressing OFF and ON BCs. DB3 OFF cone BCs have been described as CaB+ cells in the human retina (Haverkamp et al. 2003; Kántor et al. 2015a). Our results indicated that the morphological features of CaB+ BCs in our specimens were identical to those of DB3 BCs. This included the large dendritic tree, round soma and axons arbourising in stratum 2 of the IPL. The DB3 cells appeared to express only CaB. Another BC type exhibited both CaR- and CaB-positivity. We could not examine the stratification level of its axon in the IPL, but the dendrites displayed swellings and appeared to partake in cone-to-BC invaginating synapses. This indicated that the CaR+/CaB+ BCs were ON cells. They appeared to maintain contacts with more than one nearby cone ruling out the possibility that they were blue cone BCs. Out of the identified ON BCs (Haverkamp et al. 2003), the CaR+/CaB+ cells most closely resemble IMB or DB4 cells. Unfortunately, neither of these two cell types have been characterised as CaB-synthesising BCs (Haverkamp et al. 2003) and, therefore, the identity of our CaR+/CaB+ cell type is unclear. The third BC population expressed PV only and displayed a unique bi- or tristratified axonal morphology with a large axonal field. These PV+ cells did not resemble any listed BC in the characterisation scheme introduced by Haverkamp and colleagues (2003). However, it shared many morphological features with Golgi-stained giant diffuse or giant bistratified BCs (Kolb et al. 1992).
In the inner retina, a number of ACs expressed one or more CaBPs. We clearly identified AII ACs that were recently reported as being CaR+ cells in the human retina (Lee et al. 2016). In addition to CaR, we found that AII ACs co-expressed CaR, CaB and PV. The finding that the same cell synthesised three different CaBPs was a unique feature in our specimens. CaR has recently been reported also to be expressed by other human ACs, including the semilunar type (type 1, 2 and 3), stellate varicose type and thorny ACs (Lee et al. 2016). Some of the ACs detected in our specimens resembled semilunar cells. In multiple-labelled materials, these cells appeared negative for all other CaBPs and, thus, they were solely CaR+. Interestingly, we also found stellate and semilunar-like ACs in our CaB single-labelled specimens. Therefore, we suspect that some of the several identified CaR-expressing stellate and semilunar AC subtypes in the human retina (Lee et al. 2016) exhibit only CaR-positivity, whereas others co-express CaR and CaB. Indeed, Kolb and colleagues (2002) have reported that semilunar type 2 (also called A19) ACs of the monkey retina co-express CaR and CaB. Thus, the same cells might also be CaR/CaB-labelled in the human retina. A third AC type with somata located either in the INL or in the GCL, with a medium-field tristratified dendritic arbour, was found dually labelled for CaB and PV, with PV being more dominantly expressed. Although tristratified ACs have been found in the human retina (Kolb et al. 1992), the star-shaped dendritic morphology of our PV+ cell does not resemble those descriptions. A fourth AC population was the type 1 TH+ cell that appeared to express both SCGN and CaR. Interestingly, we found single-labelled ACs with either TH- or SCGN-positivity. The single-labelled TH+ cells appeared similar to their dual-labelled SCGN+/TH+ or triple-labelled SCGN+/CaR+/TH+ counterparts, suggesting that they represent the same neuron population. This further suggests that as yet unidentified intracellular mechanisms suppress SCGN expression in some, but not all, type 1 TH+ cells. Sole SCGN expression has been demonstrated in a medium-field GABA-ergic AC that occurs in the marmoset retina (Weltzien et al. 2014) and that consists of both conventional and displaced subpopulations with dendrites that mainly arbourise in the mid-IPL. We speculate that our single-labelled SCGN cells are the human equivalent of the marmoset SCGN ACs. In addition to these above-mentioned AC types, we have encountered a number of other as yet unidentified ACs, including single-labelled CaB+ ACs with either medium-sized or large cell bodies, and single-labelled PV+ ACs.
Various GC populations expressed one or more CaBPs including CaR, CaB and PV but not SCGN. Interestingly, we observed a higher number of human CaR+ GCs than described previously (Lee et al. 2016), which might have been attributable to the excellent quality of our short postmortem-time tissues. CaB was only co-expressed with CaR in a few displaced ACs, but not in GCs. In contrast, CaB and PV were often co-expressed in GCs. By utilising LY tracer injections, we established that human OFF parasol cells were PV+ but CaB-. Considering that we encountered only one single labelled PV+ GC in our material, we speculate that the relatively numerous human parasol cells contribute instead to the sizeable PV+/CaR+ GCs population. Some CaR+ GCs in our specimens exhibited morphological features that most resembled the previously described CaR-expressing bistratified GCs (Kolb et al. 1992; Lee et al. 2016). Some other unidentified GCs showed CaR-staining only but even this population contained cell bodies of various sizes, suggesting that more than one GC type expressed CaR alone. Based on the intense PV-labelling in the GCL, we conclude that almost all but a few (single-labelled CaR+ and CaB+ cells) express PV in the human GCL. A similarly large number of PV+ cells in the GCL has been described in the monkey retina (Kolb et al. 2002), suggesting that the majority of GCL cells express PV in both monkeys and humans.
CaBP colocalisation in human retinal neurons
On several occasions, we found that a particular neuron contained more than one CaBP. Such co-localisation of proteins typically occurred in the inner retina, whereas HCs were the sole example in the outer retina. HII-type HCs were found to be positive for both CaB and PV. Interestingly, intracellular labels of the two proteins overlapped only partially, as CaB was localised in the central somatic area and within the thin axonal processes. In contrast, PV was mainly localised in peripheral somatic areas, throughout the dendritic branches and in the lollipop-shaped endings. This compartment-specific location probably reflects a division of labour in Ca2+-buffering amongst CaBPs. The Ca2+-binding kinetics of PV have been reported to be slow, meaning that PV action only affects the decay phase of Ca2+-transient increases. CaB, however, binds Ca2+ fast enough to truncate the rising phase of Ca2+-increments during neuronal activation (Schwaller 2015). Moreover, the Ca2+-binding capacity (number of Ca2+-binding domains), the intracellular mobility (molecular weight) and the dissociation constant (KD,Ca(2+); the Ca2+ concentration at which the protein starts binding IC Ca2+) of these two proteins are different (for a review, see Schwaller 2015). Another obvious compartment-specific localisation of the various CaBPs was observed in AII ACs in which large lobular appendages displayed mostly CaB-positivity, whereas medium and small endings contained CaR and PV, and only a small fraction of the lobular endings expressed all three proteins. The third example was the population of CaB/PV-labelled star-shaped ACs whose entire somato-dendritic area displayed PV positivity, whereas only the soma and the primary dendrites contained CaB. This discrepancy in the CaB and PV labelling resembles that observed in double-labelled HII HCs in the outer retina (see above). Finally, we found that type 1 TH-expressing ACs also expressed CaR and SCGN. Whereas the CaR labelling of these neurons was weak and found mainly in the soma and thicker dendrites, SCGN was localised in the soma and in apparently all dendritic processes. Interestingly, however, type 1 TH-expressing cells showed SCGN labelling only in the soma and dendrites, whereas the characteristic ring-like structures that form presynaptic surfaces with a population of AC somata in stratum 1 appeared negative for SCGN. This suggests that SCGN is also localised in a compartment-specific manner, as can be found in the soma and dendrites, but not in the axonal processes of type 1 TH+ cells. The above observed co-localisation pattern between SCGN and other neural markers is perfectly in agreement with the literature, as in the brain, SCGN labels neuronal populations that are distinct from other CaBP-synthesising neurons. Moreover, SCGN+ cells in the mouse and human olfactory bulb often express TH and CaR, but not CaB or PV (Mulder et al. 2009; Attems et al. 2012).
References
Attems J, Alpár A, Spence L, McParland S, Heikenwalder M, Uhlén M, Tanila H, Hökfelt TGM, Harkány T (2012) Clusters of secretagogin-expressing neurons in the aged human olfactory tract lack terminal differentiation. Proc Natl Acad Sci U S A 109:6259–6264
Casini G, Rickman DW, Trasarti L, Brecha NC (1998) Postnatal development of parvabumin immunoreactive amacrine cells in the rabbit retina. Brain Res Dev Brain Res 111:107–117
Dacey DM (1993) Morphology of a small-field bistratified ganglion cell type in the macaque and human retina. Vis Neurosci 10:1081–1098
Dacey DM, Peterson BB, Robinson FR, Gamlin PD (2003) Fireworks in the primate retina: in vitro photodynamics reveals diverse LGN-projecting ganglion cell types. Neuron 37:15–27
Debertin G, Kántor O, Kovács-Öller T, Balogh L, Szabó-Meleg E, Orbán J, Nyitrai M, Völgyi B (2015) Tyrosine hydroxylase positive perisomatic rings are formed around various amacrine cell types in the mammalian retina. J Neurochem 134:416–428
Eliasieh K, Liets LC, Chalupa LM (2007) Cellular reorganization in the human retina during normal aging. Invest Ophthalmol Vis Sci 48:2824–2830
Endo T, Takazawa K, Kobayashi S, Onaya T (1986) Immunochemical and immunohistochemical localization of parvalbumin in rat nervous tissues. J Neurochem 46:892–898
Famiglietti EV (1992a) Polyaxonal amacrine cells of rabbit retina: morphology and stratification of PA1 cells. J Comp Neurol 316:391–405
Famiglietti EV (1992b) Polyaxonal amacrine cells of rabbit retina: PA2, PA3, and PA4 cells. Light and electron microscopic studies with a functional interpretation. J Comp Neurol 316:422–446
Fernandez-Bueno I, Fernández-Sánchez L, Gayoso MJ, García-Gutierrez MT, Pastor JC, Cuenca N (2012) Time course modifications in organotypic culture of human neuroretina. Exp Eye Res 104:26–38
Gábriel R, Witkovsky P (1998) Cholinergic, but not the rod pathway-related glycinergic (All), amacrine cells contain calretinin in the rat retina. Neurosci Lett 247:179–182
Gábriel R, Lesauter J, Bánvölgyi T, Petrovics G, Silver R, Witkovsky P (2004) AII amacrine neurons of the rat retina show diurnal and circadian rhythms of parvalbumin immunoreactivity. Cell Tissue Res 315:181–186
Garcia-Segura LM, Baetens D, Roth J, Norman AW, Orci L (1984) Immunohistochemical mapping of calcium-binding protein immunoreactivity in the rat central nervous system. Brain Res 296:75–86
Gartner W, Lang W, Leutmetzer F, Domanovits H, Waldhaeusl W, Wagner L (2001) Cerebral expression and serum detectability of secretagogin, a recently cloned EF-hand Ca(2+) binding protein. Cereb Cortex 11:1160–1169
Ghosh KK, Bujan S, Haverkamp S, Feigenspan A, Wässle H (2004) Types of bipolar cells in the mouse retina. J Comp Neurol 469:70–82
Grünert U, Martin PR, Wässle H (1994) Immunocytochemical analysis of bipolar cells in the macaque monkey retina. J Comp Neurol 348:607–627
Haley TL, Pochet R, Baizer L, Burton MD, Crabb JW, Parmentier M, Polans AS (1995) Calbindin D-28K immunoreactivity of human cone cells varies with retinal position. Vis Neurosci 12:301–307
Haverkamp S, Wässle H (2000) Immunocytochemical analysis of the mouse retina. J Comp Neurol 424:1–23
Haverkamp S, Haeseleer F, Hendrickson A (2003) A comparison of immunocytochemical markers to identify bipolar cell types in human and monkey retina. Visual Neurosci 20:589–600
Jacobowitz DM, Winsky L (1991) Immunocytochemical localization of calretinin in the forebrain of the rat. J Comp Neurol 304:198–218
Kántor O, Benkő Z, Énzsöly A, Dávid C, Naumann A, Nitschke R, Szabó A, Pálfi E, Orbán J, Nyitrai M, Németh J, Szél Á, Lukáts Á, Völgyi B (2015a) Characterization of connexin36 gap junctions in the human outer retina. Brain Struct Funct (in press)
Kántor O, Varga A, Tóth R, Énzsöly A, Pálfi E, Kovács-Öller T, Nitschke R, Szél Á, Székely A, Völgyi B, Négyessy L, Somogyvári Z, Lukáts Á (2015b) Stratified organization and disorganization of inner plexiform layer revelaed by TNAP activity in healthy and diabetic rat retina. Cell Tissue Res 359:409–421
Knop G, Pottek M, Monyer H, Weiler R, Dedek K (2014) Morphological and physiological properties of EGFP- expressing wide-field amacrine cells in the ChAT-EGFP mouse line. Eur J Neurosci 39:800–810
Kolb H, Linberg KA, Fischer SK (1992) Neurons of the human retina: a Golgi study. J Comp Neurol 318:147–187
Kolb H, Zhang L, Dekorver L, Cuenca N (2002) A new look at calretinin-immunoreactive amacrine cell types in the monkey retina. J Comp Neurol 453:168–184
Lee EJ, Han JW, Kim HJ, Kim IB, Lee MY, Oh SJ, Chung JW, Chun MH (2003) The immunocytochemical localization of connexin 36 at rod and cone gap junctions in the guinea pig retina. Eur J Neurosci 18:2925–2934
Lee SC, Weltzien F, Madigan MC, Martin PR, Grünert U (2016) Identification of AII amacrine, displaced amacrine, and bistratified ganglion cell types in human retina with antibodies against calretinin. J Comp Neurol 524:39–53
Liu WL, Hoshi H, Mills SL, Massey SC (2010) AII amacrine cell input to OFF ganglion cells via α1 glycine receptors in the rabbit retina. Invest Ophthalmol Vis Sci 51:E-Abstract 1209
Mariani AP (1984) Bipolar cells in the monkey retina selective for the cones likely to be blue-sensitive. Nature 308:184–186
Massey SC, Mills SL (1996) A calbindin-immunoreactive cone bipolar cell type in the rabbit retina. J Comp Neurol 366:15–33
Mills SL, Massey SC (1998) The kinetics of tracer movement through homologous gap junctions in the rabbit retina. Vis Neurosci 15:765–777
Mulder J, Zilberter M, Spence L, Tortoriello G, Uhlén M, Yanagawa Y, Aujard F, Hökfelt T, Harkány T (2009) Secretagogin is a Ca2+ binding protein specifying subpopulations of telencephalic neurons. Proc Natl Acad Sci U S A 106:22492–22497
Park HY, Kim JH, Park CK (2014) Neuronal cell death in the inner retina and the influence of vascular endothelial growth factor inhibition in a diabetic rat model. Am J Pathol 184:1752–1762
Pasteels B, Rogers J, Blanchier F, Pochet R (1990) Calbindin and calretinin localization in retina from different species. Vis Neurosci 5:1–16
Percival KA, Martin PR, Grünert U (2013) Organisation of koniocellular-projecting ganglion cells and diffuse bipolar cells in the primate fovea. Eur J Neurosci 37:1072–1089
Peterson BB, Dacey DM (2000) Morphology of wide-field bistratified and diffuse human retinal ganglion cells. Vis Neurosci 17:567–578
Puthussery T, Gayet-Primo J, Taylor WR (2010) Localization of the calcium-binding protein secretagogin in cone bipolar cells of the mammalian retina. J Comp Neurol 518:513–525
Röhlich P, Szél Á (1993) Binding sites of photoreceptor specific antibodies COS-1, OS-2 and AO. Curr Eye Res 12:935–944
Sanna PP, Keyser KT, Battenberg E, Bloom FE (1990) Parvalbumin immunoreactivity in the rat retina. Neurosci Lett 118:136–139
Schindelin J, Arganda-Carreras I, Frise E, Kaynig V, Longair M, Pietzsch T, Preibisch S, Rueden C, Saalfeld S, Schmid B, Tinevez YH, White DJ, Hartenstein V, Eliceiri K, Tomancak P, Cardona A (2012) Fiji: an open-source platform for biological-image analysis. Nat Methods 9:676–682
Schwaller B (2009) The continuing disappearance of "pure" Ca2+ buffers. Cell Mol Life Sci 66:275–300
Schwaller B (2015) Cytosolic Ca2+ buffers. Cold Spring Harb Perspect Biol 2:a004051
Souza CF de, Kalloniatis M, Christie DL, Polkinghorne PJ, McGhee CN, Acosta ML (2012) Creatine transporter immunolocalization in aged human and detached retinas. Invest Ophthalmol Vis Sci 53:1936–1945
Stafford DK, Dacey DM (1997) Physiology of the A1 amacrine: a spiking, axon-bearing interneuron of the macaque monkey retina. Vis Neurosci 14:507–522
Voigt T, Wässle H (1987) Dopaminergic innervation of AII amacrine cells in mammalian retina. J Neurosci 7:4115–4128
Völgyi B, Pollak E, Buzás P, Gábriel R (1997) Calretinin in neurochemically well-defined cell populations of rabbit retina. Brain Res 763:79–86
Völgyi B, Xin D, Amarillo Y, Bloomfield SA (2001) Morphology and physiology of the polyaxonal amacrine cells in the rabbit retina. J Comp Neurol 440:109–125
Völgyi B, Debertin G, Balogh M, Popovich E, Kovács-Öller T (2014) Compartment-specific tyrosine hydroxylase-positive innervation to AII amacrine cells in the rabbit retina. Neuroscience 270:88–97
Wässle H, Grünert U, Röhrenbeck J (1993) Immunocytochemical staining of AII-amacrine cells in the rat retina with antibodies against parvalbumin. J Comp Neurol 332:407–420
Weltzien F, Dimarco S, Protti DA, Daraio T, Martin PR, Grünert U (2014) Characterization of secretagogin-immunoreactive amacrine cells in marmoset retina. J Comp Neurol 522:435–455
Weltzien F, Percival KA, Martin PR, Grünert U (2015) Analysis of bipolar and amacrine populations in marmoset retina. J Comp Neurol 523:313–334
Witkovsky P (2004) Dopamine and retinal function. Doc Ophthalmol 108:17–40
Acknowledgement
The authors thank Zsuzsanna Vidra, Brigitta Fadgyas and Dr. Gábor Baksa for their technical or organisational assistance. The authors are grateful to Dr. Karin Dedek for the sheep secretagogin antibody and to Dr. Mark Eyre for assistance with the English language.
Author information
Authors and Affiliations
Corresponding author
Additional information
This work was supported by OTKA K105247 to B.V. and OTKA K-113147 to Z.S. and by the Hungarian Brain Research Program (KTIA_NAP_13-2-2015-0008) to B.V. This research was also supported by the European Union and the State of Hungary, co-financed by the European Social Fund in the framework of the TÁMOP-4.2.4.A/2-11/1-2012-0001 “National Excellence Program” to B.V.
Electronic supplementary material
Below is the link to the electronic supplementary material.
ESM 1
(DOC 73 kb)
Supplemental Figure 1
Images displaying results of negative control experiments carried out on human retinal cross sections by the omission of primary antibodies and treatment with donkey anti-goat IgG conjugated with DyLight 405 (a, blue), donkey anti-guinea pig conjugated with Cy3 (b, red), donkey anti-rat IgG conjugated with DyLight 649 (c, green), donkey anti-mouse IgG conjugated with Alexa 488 (e, blue), donkey anti-mouse IgG conjugated with DyLight 649 (f, red) and donkey anti-rabbit IgG conjugated with Alexa 555 (g, red) secondary antibodies. Composites of a–c and e–g are shown in d, h. Clearly, the secondary antibodies failed to label any neuronal structure in the human retina and only resulted in some negligible background staining mostly around vessels. Faint autofluorescence of photoreceptor outer segments was also observed. Bars 20 μm. (GIF 50 kb)
Supplemental Figure 2
Cross sections of the Wistar rat retina stained with antisera utilised in this study. a–d Immunoreactions with goat anti-PV (a, blue), rabbit anti-PV (b, red) and mouse anti-PV (c, green) antisera and a composite image (d). All utilised antibodies resulted in a characteristic staining of PV+ inner retinal cells in the rat retina, including AII amacrine cells. All PV antibodies labelled the same retinal structures. e–h Immunoreactions with mouse anti-CaR (e, blue), goat anti-CaR (f, red) and rabbit anti-CaR (g, green) antisera and a composite image (d). All utilised antibodies resulted in a characteristic staining with CaR+ inner retinal cells in the rat retina, including starburst amacrine cell somata in both the INL and the GCL and three immunolabelled bands in the IPL. i Cross-section of the Wistar rat retina stained with the goat anti-SCGN serum. The antibody specifically stained a population of bipolar cells in the rat retina corresponding strongly to previous descriptions by Puthussery and colleagues (2010). Bars 20 μm (a-h), 10 μm (i). (GIF 194 kb)
Supplemental Figure 3
Cross sections of Wistar rat cortex stained with antisera utilised in this study. a–d Low-power photomicrographs of the cortex stained with goat anti-PV (a, blue), rabbit anti-PV (b, red) and mouse anti-PV (c, green) antisera and a composite image (d). Images display PV+ cortical basket cells and their PV+ axon terminals surrounding pyramidal cell somata (asterisks). All sera mark the same neuronal structures. e–h PV+ cortical structures labelled with goat anti-PV (e, blue), rabbit anti-PV (f, red) and mouse anti-PV (g, green) antisera and a composite image (h). i–l Cortical cross-sections labelled with goat anti-CaR (i, blue), rabbit anti-CaR (j, red) and mouse anti-CaR (k, green) antibodies and a composite image (l). Cortical interneurons and neuronal fibres are stained with all three antibodies. Each antiserum labelled the same neuronal elements. Bars 20 μm (a-d), 40 μm (e-l). (GIF 235 kb)
Rights and permissions
About this article

Cite this article
Kántor, O., Mezey, S., Adeghate, J. et al. Calcium buffer proteins are specific markers of human retinal neurons. Cell Tissue Res 365, 29–50 (2016). https://doi.org/10.1007/s00441-016-2376-z
Received:
Accepted:
Published:
Issue Date:
DOI: https://doi.org/10.1007/s00441-016-2376-z