
Abstract
The impacts of the Madden Julian Oscillation (MJO) on the South American monsoon season are analyzed in the global context of the MJO propagating anomalies of convection and circulation. Unexplored aspects, such as the continental-scale daily precipitation anomalies in the MJO frequency band and changes in the frequency of extreme rainfall events, are disclosed throughout its cycle. Among other effects, the MJO increases the average daily precipitation by more than 30% of the climatological value and doubles the frequency of extreme events over central-east South America (SA), including the South Atlantic Convergence Zone (SACZ). The evolution of the most intense precipitation anomalies depends on the interplay between tropics–tropics and tropics–extratropics teleconnections, and the topography over central-east SA seems to play a role in enhancing low-level convergence. The maximum anomalies are produced by a tropics-extratropics wave train. It not only favors precipitation anomalies over the SACZ and subtropical SA, but also strengthens the anomalies over tropical SA when the system propagates northeastward. Influence function analysis and simulations of the responses to different components of upper-level anomalous divergence associated with the MJO anomalous convection indicate the probable origin of the anomalous circulation leading to the main precipitation anomalies over SA. It is triggered by secondary anomalous convection, while the main tropical anomalous circulation is produced by the strongest equatorial convection anomalies. There are indications that MJO-related anomalies over SA contribute to the impacts on other regions and to the initiation of the MJO in the Indian Ocean.
1 Introduction
Impacts of the Madden-Julian Oscillation (MJO) have been detected in all continents (e.g., Zhang 2013, and references therein). Besides dominating global intraseasonal climate variability in the tropics, it also affects the extratropics through Rossby wave trains triggered by its associated anomalous tropical convection. Some aspects of the MJO impacts on outgoing longwave radiation (OLR), precipitation anomalies and its extreme events over South America (SA) have been shown by some studies on the South Atlantic Convergence Zone (SACZ, e.g., Paegle et al. 2000; Carvalho et al. 2004), and on equatorial Brazil (Souza and Ambrizzi 2006). The global analysis of Jones et al. (2004) showed signals of MJO influence on the frequency of extreme precipitation events in the continent. Alvarez et al. (2015) computed maps of probability of weekly-averaged rainfall exceeding the upper tercile in each phase of the MJO cycle. Barrett et al. (2012) showed the impact on Chilean precipitation anomalies. More recently, Hirata and Grimm (2015) showed the importance of the MJO contribution to the occurrence of extreme precipitation events in the SACZ region and the middle-lower Parana-La Plata Basin.
Since it is clear that the MJO affects significantly precipitation and its extreme events over SA, it is of interest to carry out a comprehensive, detailed and robust characterization of some unexplored aspects of these impacts by using a relatively long data set of daily precipitation gauge data. This interest is enhanced by the fact that variability of observed rainfall and of its proxies are not always in good agreement over SA, and that gridded precipitation data sets may underestimate extreme precipitation events in SA regions much affected by the MJO (Hirata and Grimm 2017). Besides, it is relevant to further disclose the mechanisms of those impacts. MJO is the only intraseasonal variability that shows some degree of predictability (Waliser et al. 2003), but models still have problems in representing it correctly, although there have been progress in simulating realistically the MJO in atmospheric models through diverse approaches (e.g., Weisheimer et al. 2014), and CMIP5 models show improvement over the CMIP3 models in this regard (Lin et al. 2006; Hung et al. 2013). As there is a variety of data and techniques to monitor and predict the formation and evolution of the MJO, the knowledge of the statistically significant impacts on SA and their mechanisms in the different phases of the oscillation contributes to improve the weather and climate prediction. It is particularly important for the subseasonal to seasonal prediction, and for the models’ validation. It is desirable that models used for subseasonal prediction in SA reproduce well the observed MJO impacts, since they contribute to extreme events in very populated regions during the monsoon season.
This study adds to the valuable information already available by presenting a comprehensive assessment of the impacts of the MJO on South American observed daily precipitation and its extreme events, with great spatial and temporal coverage, using a detailed characterization of the MJO phases (Wheeler and Hendon 2004). This characterization is convenient because it has been widely used by operational centers for monitoring and prediction. The impact of different MJO phases on precipitation is here characterized by composites of daily anomalies filtered in the 20–90 days band, therefore excluding effects of ENSO or decadal/interdecadal variability, which are very strong in certain affected regions (Grimm 2003, 2004; Grimm and Saboia 2015; Grimm et al. 2016). Regarding the MJO impact on extreme precipitation events, the analysis is focused on the events whose 3-day running mean is above the 90th percentile, producing strongest impacts due to persistence, and the results are informed in an easily understandable way. Both types of information have not yet been provided on continental scale and with relatively long period of data by previous studies. As MJO influences precipitation in very populous regions, such as central-east SA (CESA) and southeast SA (SESA), which display the highest population density in the continent, this information has very practical usefulness. The results are presented for the eight phases of the MJO, in order to cover possible nonlinearities in the impacts of opposite phases.
Besides this information, possible mechanisms for the main MJO impacts on SA are explored, and possible remote effects of these impacts and their possible role in the MJO cycle are suggested. The circulation anomalies associated with the precipitation anomalies are analyzed and forcing of the strongest impacts is tested with simple model simulations. The results of these tests can provide guidance towards a more effective monitoring for prediction of anomalous rainfall in SA.
The focus is on the austral summer (December–January–February, DJF), since MJO is stronger in this season and this is the rainy season over most of SA (Fig. 1 for the climatological austral summer conditions, and Fig. 1 in Grimm 2011 for the annual cycles of precipitation over SA). The highest precipitation occurs in the central part of the continent and in the SACZ, one of the most prominent South American monsoon features (Grimm et al. 2005; Grimm and Silva Dias 2011; Liebmann and Mechoso 2011; Marengo et al. 2012; and references therein). As there is little MJO impact on austral summer precipitation south of 47.5°S, this latitude is the limit of the analysis.

Upper left panel: mean daily precipitation (mm day−1) in austral summer for the period 1979–2009, from station data. Upper right panel: streamlines at 850 hPa and sea level pressure (hPa) for the same period, from NCEP/NCAR Reanalysis products (Kalnay et al. 1996). Lower panel: Topography of South America
Section 2 describes data and methods, Sect. 3 reviews dynamical mechanisms of MJO, and Sect. 4 describes its influence on precipitation and the frequency of its extreme events in SA, while Sect. 5 suggests an evolution pattern of the most intense MJO-related precipitation anomalies over the continent. Section 6 characterizes the anomalous circulation leading to South American precipitation anomalies through tropics–tropics and tropics–extratropics teleconnections, while Sect. 7 explores the sources of these teleconnections and indicates possible remote effects of the MJO-related anomalous convection over SA. Section 8 presents a summary and the conclusions.
2 Data and methods
2.1 Data
The precipitation data are observed daily rainfall totals from more than 10,000 stations in SA for the period 1979–2009, provided by the Brazilian Water Agency (ANA) and hydrometeorological institutes from Argentina, Bolivia, Paraguay and Uruguay. They are verified for problems detected (Grimm and Saboia 2015) and are gridded to 1°. To obtain better coverage in northern SA, a 1° gridded set described by Liebmann and Allured (2005) is also used in that region. For analyses of other atmospheric fields, NCEP/NCAR reanalysis products are used (Kalnay et al. 1996).
The analysis starts in 1979 because the zonally-averaged OLR in the deep tropics (10°N–20°S), is lower after 1978 than before, probably due to different sensors and to different equator crossing times (Kousky 1988). Therefore, we have chosen to ignore the data prior to 1979 to minimize biases in the anomalies. Furthermore, reanalysis before 1979 is less reliable for not including satellite observations. Since the MJO phases are determined by using OLR and zonal wind from the reanalysis, their characteristics could be affected by any biases in these data. Therefore, the focus is on the period 1979–2009.
2.2 Methods
The eight phases of the MJO are defined by Wheeler and Hendon (2004, WH04) according to the following steps:
-
multivariate empirical orthogonal function (EOF) analysis of 15°S–15°N averaged OLR and zonal wind at 850 and 200 hPa, after removal of the annual cycle and interannual variability and normalization by the standard deviation;
-
computation of the indices RMM1 and RMM2 (RMM = realtime multivariate MJO index) by projecting OLR and zonal wind at 850 and 200 hPa onto the first two combined EOFs;
-
definition of eight MJO phases for the 45° intervals from 0° to 360° of a phase angle θ = tan−1 (RMM2/RMM1), but no MJO phase is considered if the amplitude of MJO (A = (RMM1)2 + (RMM2)2)1/2) is smaller than 1 (neutral MJO day). For greater temporal resolution of the evolution of anomalies, also sub-phases of 15° intervals are used in Sect. 5.
To assess the MJO impacts on precipitation, the climatological annual cycle of daily values is calculated for each grid point by smoothing the entire period daily means with a 31-day moving average, since there is much spurious variance in the annual cycle of daily means due to the relatively short sample. The climatological annual cycle is then subtracted from the daily values at each grid point, to obtain a series of anomalies. This series is then submitted to a bandpass Lanczos filter (Duchon 1979) with 211 weights that retains intraseasonal variability in the 20–90 day band, and then only the DJF season is separated from the filtered data and used in the analyses. Composites of anomalies and assessment of their significance are carried out for each MJO phase. Since the anomalies are filtered, no other variability contributes to them in a meaningful way (synoptic, interannual, interdecadal). There can be significant differences between composites with raw or filtered anomalies, as influence of ENSO and interdecadal variability is strong in certain regions (Grimm 2003, 2004; Grimm and Saboia 2015). This filter also reduces the influence of outliers on daily anomalies, since outliers are usually the result of constructive superposition of variability in different time scales.
The statistical significance of the composites is assessed with a Student’s t-test in which the effective sample size is reduced by considering the autocorrelation introduced in the series by the filter (Wilks 2006), resulting in a stringent test. A non-parametric approach based on the hypergeometric distribution shows similar significance results.
For the assessment of the MJO influence on the frequency of extreme events, they are determined based on 3-day averages, as in Grimm and Tedeschi (2009), since their impact is enhanced by persistence. 3-day running means of precipitation are computed, the value is attributed to the central day, and Gamma distributions are fitted to these means, one distribution for each day of the year (considering only nonzero values, above 0.1 mm). An extreme event is counted in a grid point whenever a 3-day mean percentile is above 90. The daily average number of extreme events (or probability of extreme event occurrence) is calculated for each MJO phase and for all the summer days and the difference between these values is calculated for each grid point and its significance assessed. However, in order to give the user a more easily understandable number, instead of representing the isolines of the difference, the ratio between these probabilities is represented on the maps, informing by which factor the climatological probability of occurrence of extreme events changes in each MJO phase. For instance, if this number is 2 the frequency of extreme events doubles.
The filtered summer data are also submitted to EOF analysis based on the correlation matrix, to disclose the main coherent spatiotemporal continental structures of precipitation variability in the MJO band. This allows determining the main variability patterns associated with MJO, and compare them with the largest anomalies in the various phases of MJO. The covariance matrix gives very similar results. Varimax rotation is applied to the modes with eigenvalues equal or greater than 1, according to the Kaiser’s rule (Wilks 2006). It preserves the orthogonality of the time coefficients (factor scores), without imposing orthogonality on the spatial factor loading maps. Unrotated modes are constrained to be spatially orthogonal, which can produce nonphysical modes. Besides, the sampling problem and other problems inherent to unrotated EOFs are greatly reduced by using rotated solutions (Richman 1986).
Teleconnections responsible for the strongest impacts over SA are investigated with the help of influence functions of a vorticity equation model with a divergence source (Grimm and Silva Dias 1995a, b). This model is linearized about a realistic basic state, including the divergence of this state and vorticity advection by its divergent wind:
where
F′ depends only on the anomalous divergent flow, ζ is absolute vorticity, D is divergence, Vχ and Vψ are the divergent and rotational components of the wind, and A′ is the damping term, including linear damping and biharmonic diffusion. The model is applied at 200 hPa, a level near the maximum divergence associated with convective outflow in the tropics and an equivalent barotropic level in the extratropics. Its stationary version is:
where M is a linear operator and ψ′ the anomalous streamfunction. The influence function based on divergence forcing is defined by:
where \(\delta \left( {\lambda ,\varphi ,\lambda ^{\prime},\varphi ^{\prime}} \right)\) is the delta function. The influence function represents at each point with longitude and latitude (λ′, φ′) the model response at a target point (λ, φ) to an upper-level divergence located at (λ′, φ′). Maps with contours of influence function for a given target point indicate the regions in which the anomalous upper-level divergence is most efficient in producing streamfunction anomalies around that target point. Upper-level anomalous divergence (convergence) in regions with positive values of the influence function produces positive (negative) streamfunction anomalies around the target point, and the opposite is true for negative values of this function. More information can be found in Grimm and Silva Dias (1995b). This model is also used for simulations of the observed streamfunction anomalies at 200 hPa in response to prescribed idealized anomalous divergence associated with MJO-related anomalous convection.
Influence functions are calculated for action centers of anomalous teleconnection wave train associated with the MJO phase of highest impacts on SA. They indicate regions in which upper level anomalous divergence associated with anomalous tropical/subtropical convection is most efficient in producing the observed wave train. Simulations with the vorticity equation model confirm the remote influence by reproducing the main observed circulation features.
3 Background on MJO dynamical mechanisms
The MJO dominates the tropical intraseasonal variability, with spectral peaks at 30–90 days, comprising an equatorial planetary-scale circulation system coupled with large-scale convection that moves eastward with speed of about 5 m/s in the Eastern Hemisphere (EH, Indo-Pacific warm pool), and about 15 m/s over the Western Hemisphere (WH). It is fundamentally a first baroclinic mode that combines the first equatorial Rossby and Kelvin modes. In the vertical, it displays westward-tilted vertical motion and moisture, and in the boundary-layer the low-pressure, convergence, and enhanced humidity lead the major convective center, favoring new convective systems to the east, while the opposite occurs to the west. This system is stronger in the austral summer and its anomalous convection is stronger over the EH than over the WH (e.g., reviews by Zhang 2005; Wang et al. 2016; Wang and Chen 2017, and references therein, such as Lau and Peng 1987; Wang and Rui 1990; Salby et al. 1994; Houze et al. 2000; Matthews et al. 2004; Masunaga 2007; Kiladis et al. 2009, among many others).
The circulation anomalies associated with the MJO present characteristics of the combined Rossby and Kelvin wave response to anomalous equatorial convection (anomalous heating). Although the observed patterns are produced by interacting heating, waves and moisture, some basic features are represented in the stationary responses to specified steady tropical heating (e.g., Matsuno 1966; Gill 1980; Lim and Chang 1983; Kraukunas and Hartmann 2007), since these responses can be interpreted as time-averaged responses. Equatorial diabatic heating produces a Kelvin wave propagating to the east and an equatorial Rossby wave propagating to the west at much lower velocity. The Kelvin mode response displays equatorial bands of easterly and westerly wind converging to the heating (mass sink), while the Rossby mode response consists of a pair of cyclonic (anticyclonic) circulations straddling the equator west (east) of the heating (e.g., Lim and Chang 1983). These characteristics influence the steady state response in a resting atmosphere with dissipative processes, producing a pair of cyclones and a zone of equatorial westerlies to the west of the heating and a more extensive zone of easterlies to the east. Although this eastern signal resembles the equatorial Kelvin wave, it is also contributed by the Rossby wave. There is descent to the east of this eastern signal and to the west of the Rossby wave cyclones. This response may be different if the basic state is not at rest. For instance, in a westerly basic wind the Rossby wave can also contribute to eastward zonal wind propagation, besides producing extratropical propagation (e.g., Lim and Chang 1983). When a pair (dipole) of mass sink and mass source (heating and cooling) occupies the equatorial region, as in Matsuno (1966), the Rossby and Kelvin wave responses produce a streamfunction quadrupole, in which westerlies (easterlies) and a pair of cyclones (anticyclones) straddle the equator to the west of the mass sink (mass source), and there are easterlies (westerlies) to the east. Zonal equatorial flow is directed from the mass source (suppressed convection) to the mass sink (enhanced convection) and is strong along the equator, where rotational winds reinforce the divergent winds.
Several of the MJO characteristics described above can the observed in Figs. 2, 3, 4, 5 and 6, which will be described in greater detail in Sect. 4.1. Several theories have been proposed to explain those observed aspects. Even though the Kelvin wave has been considered a dynamical fundament of the MJO, since it resembles the MJO equatorial eastward zonal wind field, the convectively coupled Kelvin wave displays a much higher eastward speed than the MJO. Therefore, the basic theories have to explain this discrepancy and the mechanisms that selectively supply energy to the frequency, scale and eastward propagation speed of the MJO (e.g., reviews by Zhang 2005; Wang et al. 2016; Wang and Chen 2017, and references therein). These theories involve interactions among equatorial wave-boundary layer dynamics, convection and moisture. The boundary layer moisture convergence feedback is considered crucial in coupling the equatorial Kelvin and Rossby waves with the convective heating, selecting a preferred eastward propagation of the mixed Kelvin–Rossby wave structure, and generating instability. The Kelvin and Rossby waves induce a unified boundary layer frictional moisture convergence to the east of the convective heating, accumulating moist static energy. They also have off-equatorial components of boundary layer convergence, partly collocated with each other. The moisture feedback can enhance the Rossby wave component and therefore slows down eastward propagation. This propagation is slower over the EH, because the enhanced SST promotes convective heating, reducing the moist equatorial Kelvin wave speed, and faster over the colder ocean in the WH. The MJO instability depends on the basic state SST or basic state moist static energy, which is the main heating energy source for this instability. Analyses of normal modes and experiments with numerical models indicate that a frictionally modified Kelvin mode grows in amplitude and decreases its phase speed for SSTs higher than a critical value around 29 °C, while subcritical SSTs damp it (Wang and Rui 1990; Salby et al. 1994; Wang and Li 1994).

Composite anomalies of OLR and 850 hPa velocity potential in each phase of the MJO for austral summer. Contour interval is 2.5 W m−2 for OLR and 2 × 10⁵ m2 s−1 for velocity potential. The color bar indicates confidence levels of OLR anomalies, with signs indicating positive or negative anomalies. Velocity potential negative anomalies are in green and positive anomalies are in purple, with their maximum absolute values indicating centers of anomalous divergence and convergence, respectively

Composite anomalies of OLR and 850 hPa winds in each phase of the MJO for austral summer. Contour interval is 2.5 W m−2 for OLR. The color bar indicates confidence levels of OLR anomalies, with signs indicating positive or negative anomalies. Only wind anomalies (m s−1) with confidence levels better than 80% are shown

Composite anomalies of the 850 hPa streamfunction filtered in the 20–90 day band, for each phase of the MJO during the austral summer (DJF). Contour interval is 3 × 10⁵ m2 s−1; zero line omitted. The color bar indicates confidence levels of streamfunction anomalies, with signs indicating positive or negative anomalies. Superimposed on the streamfunction anomalies are the composite anomalies of OLR, with contour interval 2.5 W m−2, negative anomalies in green (enhanced convection) and positive anomalies in purple (reduced convection)

Composite anomalies of the 200 hPa streamfunction filtered in the 20–90 day band, for each phase of the MJO during the austral summer (DJF). Contour interval is 6 × 10⁵ m2 s−1; zero line omitted. The color bar indicates confidence levels of streamfunction anomalies, with signs indicating positive or negative anomalies

Time-longitude Hovmoller diagrams of 0°–15°S averaged OLR anomalies (upper panel, in W m−2), zonal wind anomaly at 850 hPa (middle panel, in m s−1) and 200 hPa (bottom panel, in m s−1), for each of the eight MJO phases defined by the WH04 index during the austral summer (DJF). The dotted and dashed lines delimit the significant values with confidence level better than 80%
Besides these basic characteristics, there are other aspects of the MJO-related signal that also demand explanation, such as its propagation over the WH, the triggering of anomalous convection over the Americas and Africa, and the MJO initiation in the Indian Ocean. Observational data indicate that the successive events (initiated from a previous MJO) are much more frequent than the primary ones (initiated without a previous MJO) (e.g., Matthews 2008; Straub 2013; Sakaeda and Roundy 2015; Maloney and Wolding 2015).
There are basically two views regarding the MJO propagation over the WH and its successive initiation. One emphasizes tropics–tropics teleconnections, based on the role of the circumnavigating equatorial Kelvin wave, and also of the equatorial Rossby wave (e.g., Seo and Kim 2003; Masunaga 2007; Matthews 2008; Haertel et al. 2015; Powell and Houze 2015; Maloney and Wolding 2015). According to this view, the Kelvin wave that initiates MJO convection in the Indian Ocean is originated from the inactive phase of a previous MJO cycle. Therefore, the complete cycle comprises Kelvin waves emerging from both active and suppressed phases of MJO convection and circumnavigating the tropics to trigger the opposite phase. A new cycle of the MJO would initiate when the circumnavigating Kelvin wave generated by the suppressed convection anomaly of the previous cycle meets the Rossby wave response to the reduced convection anomaly over the Indian Ocean, and they work together in strengthening off-equatorial boundary layer convergence. The Kelvin wave it produces extends further to the east of MJO convection at a later phase of its cycle, characterizing a self-generating and self-sustaining life cycle under its dipole structure (e.g., Seo and Kim 2003; Masunaga 2007).
Another view on the mechanisms of the MJO propagation over the WH, the development of new MJO-related convective centers and successive initiation of Indian Ocean MJO activity emphasizes the influence of tropics–extratropics teleconnections on the development of MJO-related convection (e.g., Hsu et al. 1990; Grimm and Silva Dias 1995b; Ray and Li 2013; Seo and Son 2012; Sakaeda and Roundy 2015). According to this view, tropical MJO-related circulation and convection centers are also influenced by extratropical waves originated by previous MJO convection anomalies and wave-mean flow interaction through the extratropical circulation. Regarding the South American MJO-related convection, Grimm and Silva Dias (1995b) had already suggested that it is influenced by extratropical waves produced by subtropical MJO-related convection in central-south Pacific, and that it influences subsequent development of MJO-related tropical convection, including the initiation of a new MJO cycle. Further tests and details are discussed in Sect. 7.
Observational and modeling studies have provided findings on the importance of both mechanisms, but there is no consensus on their relative contribution.
4 MJO influence on South America precipitation and its extreme events
4.1 Global evolution of the MJO tropical convection and associated circulation
Some of the basic MJO features described in the previous section are visible in Figs. 2, 3, 4, 5 and 6. Each of the eight MJO phases defined by WH04 are characterized in Figs. 2 and 3 with respect to anomalies of OLR, velocity potential and wind at 850 hPa. The rotational circulation at 850 hPa and 200 hPa is characterized through streamfunction anomalies in Figs. 4 and 5. Figure 6 displays the eastward propagation of OLR and zonal wind anomalies in time-longitude Hovmoller diagrams calculated for the latitudinal band 0–15°S, in which tropical OLR and zonal wind anomalies are more intense in austral summer (Figs. 2, 3). Although OLR anomalies have been shown in many previous analyses of MJO, they are presented for comparison with the precipitation anomalies in the period 1979–2009 over SA, and for association with the circulation anomalies.
Figures 2 and 3 show anomalous convection, represented by OLR anomalies, propagating eastward following the tropical low-level centers of anomalous convergence and divergence, indicated by the centers of velocity potential (Fig. 2) and also visible in the significant low-level wind anomalies (Fig. 3). These centers are generally slightly to the east of the maximum convection anomaly and south of the equator. The most enhanced convection is near the Maritime Continent in phases 4 and 5, while the strongest implied subsidence is in the same region in phases 8 and 1.
Figure 4, in which the OLR anomalies are also represented, shows the low-level streamfunction anomalies, while Fig. 5 shows them at upper levels, where they have opposite sign in the tropics, as expected in a first baroclinic mode. The streamfunction responses to opposite convection anomalies are nearly opposite. The general resulting patterns around a dipole of opposite tropical convection anomalies feature a quadrupole rotational circulation straddling the equator. This pattern is clearer at lower-level (Fig. 4), since at upper-level the tropics–extratropics teleconnections imprint a stronger signal than at lower-level and can perturb the equatorial Rossby–Kelvin wave signal (Fig. 5). This tropics–extratropics propagation is stronger in the Northern Hemisphere, where it is favored by the winter basic circulation, but it is also important in the Southern Hemisphere, particularly to the impact of MJO on SA.
In phase 1, enhanced convection (negative OLR anomalies, in blue in Fig. 2), prevails over the WH, is strongest over tropical southern Central Pacific, CESA and Central-Equatorial Africa, and starts developing in the Indian Ocean. In phase 2 it fades over Central Pacific, weakens over SA, moves to East-Equatorial Africa and intensifies over the Indian Ocean, progressing eastward. In phases 4 and 5 it moves over the Maritime Continent, and then progresses over the Pacific Ocean in phases 5 through 8. As the signal enters the WH, it moves into the subtropics of the southern Pacific Ocean, shifting the South Pacific Convergence Zone (SPCZ) eastward (Fig. 2). At phase 8 convection anomalies also develop over SA and Africa, where they further strengthen in phase 1.
Although the equatorial convection weakens over the colder waters of the eastern Pacific (Figs. 3, 6), the eastward propagation of the equatorial MJO signal in the WH is still present in the lower and upper-level zonal winds (Hovmoller diagrams, Fig. 6), as faster free waves (uncoupled with convection) (Zhang 2005, and references therein) and subtropical and midlatitude Rossby waves (Sakaeda and Roundy 2015), as detailed in Sect. 6. The propagation slows again over SA, between 60° and 30°W, where the main continental convection anomalies reside, and over east equatorial Africa. These features are more evident in the low-level wind, although a continuous equatorial propagation is more visible in the upper level wind.
The Hovmoller diagrams of low- and upper-level winds show a known tendency to westward tilt with height in the vertical structure of opposite anomalies in low and upper levels. The tropical convection anomalies over SA, indicated by the OLR diagram in Fig. 6, reveal characteristics more of a standing oscillation than of propagating convection, although there is a resulting eastward displacement between 90°W and 45°E, since the strongest and most extensive convection anomalies over tropical Africa happen after those over tropical SA.
4.2 Precipitation patterns over South America
Probably the best way of analyzing the MJO precipitation anomalies over SA is to start from phase 3 or 7, when the strongest Pacific Ocean equatorial convection anomaly crosses the Date Line in its eastward progression and moves into the subtropics of South Pacific (Figs. 2, 3). These phases are characterized by changes in precipitation anomalies over most of SA, although the anomalies are not intense or widely significant.
The description starts from phase 7 (Fig. 7), when enhanced convection (negative OLR anomaly) crosses the Date Line (Fig. 2). Precipitation anomalies turn positive in northwestern and central SA, while negative anomalies start spreading over the Parana/La Plata Basin. However, these anomalies are weak and not extensively significant. In phase 8 the positive anomalies extend over CESA (which includes SACZ in its southern part), while the negative anomalies dominate the central/southern parts of the Parana/La Plata Basin, in SESA, and the magnitude of the anomalies is enhanced. However, the greatest enhancement occurs in phase 1, especially of the positive anomalies in Central Brazil (monsoon core region), the SACZ and eastern Amazon Basin, as well as of the negative anomalies in northwestern SESA. Therefore, phase 1 displays the strongest positive anomalies in CESA and negative anomalies in SESA. Suppressed convection also appears in northwest SA, east of the Andes.

Composite anomalies of austral summer daily precipitation rate (color bar, mm day−1) filtered in the 20–90 day band, for each phase of the MJO. Crosshatched regions have anomalies with confidence levels better than 90%
As the positive convection anomalies (negative OLR) in central subtropical Pacific disappear in phase 2 (Fig. 2), the positive (negative) precipitation anomalies over CESA (SESA) weaken (Fig. 7), remaining only in the equatorial region, over northeast SA.
Since in phases 3, 4, 5, and 6 convective anomalies tend to be opposite to those in phases 7, 8, 1, and 2 (Fig. 2), the above description of precipitation anomalies may be repeated with opposite signs (Fig. 7). There is, however, one significant aspect that deviates from the anti-symmetry between these phases. While the maximum positive precipitation anomalies in CESA (and negative ones in SESA) occur in phase 1, the maximum opposite anomalies do not occur in phase 5, but in phase 4. Therefore, it seems that the transition from maximum negative anomalies to maximum positive anomalies in CESA takes longer than the opposite transition. Besides, the maximum negative anomalies in CESA do not reach as much intensity as the positive anomalies over extensive regions, especially over the SACZ (cf. phases 4 or 5 and phase 1 in Fig. 7). This could be attributed to further intensification of positive convection anomalies produced by regional processes, such as the influence of the mountains in Southeast Brazil, which tends to anchor the SACZ in this region, and the CISK mechanism (Grimm et al. 2007; Grimm and Zilli 2009).
Figure 7 shows that the contribution of MJO-related anomalies alone may reach above 3 mm day−1, which amounts to about 30% of the climatological summer rainfall over extensive regions of the monsoon core region (Fig. 1). Composites of unfiltered daily precipitation anomalies are generally more intense (not shown), since other types of variability (ENSO, interdecadal variability), contribute to precipitation over the same regions.
As several studies on intraseasonal variability in SA have used OLR as a proxy for precipitation, it is convenient to point out some differences between OLR and precipitation anomalies in Figs. 2 and 7. In phase 1, for instance, the strongest negative OLR anomalies over SA are shifted northeastward with respect to the maximum precipitation anomalies (in Central Brazil). A northeastward shift of negative OLR anomalies is also noticed in phase 8. In phase 4 the negative OLR anomalies over SESA are displaced eastward with respect to the precipitation anomalies. These differences might be ascribed to the displacement of the upper part of clouds by the upper level summer winds. It is also worth mentioning that significant OLR anomalies generally cover greater areas than significant precipitation anomalies (cf. Figs. 2, 7), which also emphasizes the need for reliable precipitation data analysis.
The evolution of the anomalies in OLR and precipitation indicates that generally the prevalent anomalies in the northern half of the continent first establish over the northwestern most part of SA and Amazon (phase 7), and then develop in the southern Amazon and central-east Brazil (phases 8 and 1), extending into the SACZ (phase 1). After the maximum, the enhanced convection retreats into Northeast Brazil and the eastern Amazon (phase 2). The evolution and associated teleconnections will be detailed in Sect. 5 and 6.
4.3 Extreme precipitation events in South America
The effect of the MJO on the frequency of extreme events is generally consistent with the effect on the average daily precipitation (cf. Figs. 7, 8), although generally the regions with significant difference between the probability of occurrence of extreme precipitation events in each phase and the climatological probability are larger than the regions with significant anomalous daily precipitation. This indicates the importance of MJO influence on the frequency of extreme events, already emphasized by Hirata and Grimm (2015). In phases 3 and 7, there are examples of regions in CESA and SESA with no significant anomalies of daily precipitation but significant changes in the frequency of extreme events. The phase with greatest impact on the mean daily precipitation in a certain region is not always the same with the greatest change in the frequency of extreme events, as can be seen by comparing phases 3 and 4 with regard to SESA (Figs. 7, 8). The greatest impact on the frequency of extreme events in SESA happens during phase 3, while the most intense and extensive impact on daily precipitation amount occurs in phase 4.

Ratio between the probability of occurrence of extreme precipitation events in each of the MJO phases, and the mean probability. Contour interval is 0.4 and contour 1.0 is omitted. Contour values above 1.0 are in green and below 1.0 are in purple. Background colors indicate levels of confidence for the difference between the probability of occurrence for each MJO phase and the mean probability
The most intense MJO impact on the frequency of extreme events occurs in phase 1, when the frequency of extreme events (probability of occurrence of extreme events) increases more than 2.0 times over the SACZ and the core monsoon region. This impact is especially important for great urban centers, such as Rio de Janeiro and Sao Paulo, where summer extreme events are responsible for urban floods and landslides. In the Parana/La Plata Basin, the frequency of extreme events increases more than 1.6 times in phase 3 over southern Brazil, also a very populous region. These results are coherent with Hirata and Grimm (2015). Alvarez et al. (2015) carried out a different analysis, obtaining changes in the frequency of weekly averaged rainfall exceeding the upper tercile in each MJO phase. Although the sign of the changes is generally consistent between their Fig. 11 and Fig. 8 of this study, there are some relevant differences. The main one is during phase 1 over the SACZ, where Fig. 8 shows that the extreme events increase by a factor of 2.0, while in Alvarez et al. (2015) there is little impact over the SACZ and the increase is more concentrated in Central Brazil, and by a factor less than 1.5. This difference may be caused by the different thresholds (90th percentile in this study and 66.6th percentile in Alvarez et al. 2015) and by the use of 7-day running mean rainfall in Alvarez et al. (2015), which may have smoothed out some impacts. It is worth noting that the significant impact on the SACZ is not present in phases 8 and 2, and therefore, including days in phases 8 and 2 in 7-day running mean rainfall for phase 1 could smooth out the impact on the SACZ in Phase 1.
5 EOF analysis and evolution of the precipitation anomalies over South America
The precipitation anomalies associated with phase 1, the strongest and most extensive over SA (Fig. 7), do not occur all simultaneously, but present a prevailing evolution. This is suggested by the EOF analysis of intraseasonal variability of precipitation and by the evolution of anomalies in three sub phases of phase 1.
The first four rotated EOFs (REOFs) of summer daily precipitation anomalies filtered to retain 20–90 day variability display strongest factor loadings in regions of SA that are most affected by the MJO in the tropical part of the continent (north of 23°S): CESA, including the central part of the continent, southeast Amazon and SACZ, and northeast SA (Fig. 9). All these regions display greatest anomalies during phases 8 and 1, especially in phase 1 (Fig. 7). The first mode covers most of the anomalies observed in phase 1, but the second, third and fourth also represent anomalies present in this phase. Since the variability of these regions is represented by different rotated EOFs, the related anomalies do not happen all simultaneously and may have different origins. Although they all appear in phase 1, they are most probably not present in all days of this phase, but appear in its composite precipitation anomalies.

Factor loadings of the rotated EOFs of the austral summer daily precipitation in the 20–90 day band
The precipitation anomalies (Fig. 7) and the changes in the frequency of extremes (Fig. 8) in phases 8, 1 and 2 already indicated a prevailing general evolution of precipitation anomalies. It is possible to detail the evolution of the strongest anomalies through composites of precipitation anomalies in sub phases of the MJO phases 1 and 2 (a sub phase corresponds to one-third of a phase, as explained in Sect. 2.2) (Fig. 10). They confirm that the anomalies in phase 1 start in the northern part of CESA, and while they weaken in this region, they appear in the southern edge of the SACZ, from where they propagate northeastward, enhancing again precipitation in CESA and northeast SA, where they last longer. As detailed in the next section, the first part of this evolution, in northern SA and the northern part of CESA, seems to be favored by the eastward-propagating upper-tropospheric large-scale divergence on the leading edge of the equatorial easterly wind anomalies over the WH (which favors drop in surface pressure) (as in Sakaeda and Roundy 2015), as well as by the triggering of convection on the downstream sides of troughs of extratropical wave trains during their equatorial intrusion (as in Kiladis and Weickmann 1997). It also benefits from the propagation of Kelvin waves produced by convection anomalies in northwestern SA (as in Liebmann et al. 2009). The second part of the evolution, starting in the SACZ and moving northeastward, seems to be produced by tropics-extratropics teleconnection in the Southern Hemisphere (see Sect. 7).

Composite anomalies of austral summer daily precipitation rate (color bar, mm day−1) filtered in the 20–90 day band for three sub-phases of the MJO phases 1 and 2, indicating the evolution of the strongest anomalies. Crosshatched regions have anomalies with confidence levels better than 90%. See text for explanation
The REOF5 represents the MJO variability in the medium Parana/La Plata Basin, around the triple border between southern Brazil, northern Argentina and southern Paraguay (Fig. 9). This variability can occur in conjunction with the SACZ opposite anomalies, as in REOF1, but can also occur separately, even in intraseasonal variability not connected with the MJO. This region shows greatest daily average precipitation anomaly in MJO phase 4, but greatest change in the frequency of extreme events in phase 3 (Figs. 7, 8).
6 MJO anomalous circulation leading to South American precipitation anomalies
Precipitation anomalies are due to changes in the essential ingredients of precipitation: moisture convergence and force to lift the moist air to the condensation level. As mentioned before, the MJO-related anomalies over SA are brought about by circulation anomalies produced by tropics–tropics and tropics–extratropics teleconnections. The first type is associated with the equatorial Kelvin and Rossby waves that compose the MJO, while the second one is associated with Rossby waves emanating from tropical/subtropical heat sources towards extratropical latitudes and redirected towards subtropical/tropical regions (Sect. 3). Both types contribute to the anomalies over SA.
The enhancement of MJO-related convection over the tropical WH, including the Americas and Africa, and the initiation of the MJO in the Indian Ocean, is most frequently associated with high-level equatorial easterly anomalies, which propagate eastward (Fig. 6). On the leading edge of the easterly anomalies there is eastward-propagating upper-tropospheric large-scale divergence, which favors a drop in surface pressure, thereby reinforcing lower-tropospheric convergence and anomalous convection over preferred regions in the WH, as SA. It decouples from the central Pacific convection and propagates farther eastward where it later couples with the convection over SA and Africa. When it approaches the western Indian Ocean, it favors a MJO initiation (Sakaeda and Roundy 2015). The anomalous MJO-related equatorial zonal wind in the WH is often considered as associated with a dry Kelvin wave radiated from the strong convective anomaly over the western Pacific warm pool. However, observational and modeling results show that not only equatorial Kelvin wave but also equatorial Rossby wave and extratropical Rossby wave trains produced by previous MJO convection influence the anomalous equatorial winds in order to produce favorable conditions for anomalous tropical convection in the WH and the MJO initiation in the Indian Ocean (e.g., Grimm and Silva Dias 1995b; Sakaeda and Roundy 2015). The dynamics driving these equatorial winds changes as they propagate, and there are regions in which the Kelvin wave dynamics dominate.
The initial development of the upper-level easterly anomalies east of the date line is associated with equatorial Kelvin and Rossby waves produced by the MJO anomalous equatorial convection dipole entering the WH. Besides, the tropics–extratropics teleconnections associated with tropical anomalous convection produce equatorward-propagating Rossby wave trains, whose anomalies merge with the equatorial anomalies. Furthermore, the midlatitude troughs propagating from the Northern and Southern Hemispheres favor convection on their downstream sides over the eastern subtropical North and South Pacific, Americas and Atlantic basin. For instance, the anomalous convection over Central America and northwest SA in phase 7, can be produced by the equatorial intrusion of the Northern Hemisphere midlatitude wave train observed in phases 6 and 7 (Fig. 5), in the same way as described by Kiladis and Weickmann (1997, their Fig. 6b, but with the reference anomalous convection and corresponding circulation shifted to the west). The presence of basic state westerly wind in the equatorial WH allows the midlatitude waves to approach (and cross) the equator and directly modulate the tropical circulation (e.g., Webster and Holton 1982). Over the east Pacific, the upper-tropospheric equatorial easterly wind anomaly initially develops in association with subtropical and midlatitude Rossby ridges associated with previous convection over the Pacific Ocean, but when convection starts over Central America and northern SA the associated equatorial Rossby wave anticyclones flanking the equator also contribute to enhance the upper level easterlies in this region. According to Sakaeda and Roundy (2015), as the easterly wind amplifies and propagates farther eastward, a negative upper-tropospheric geopotential height anomaly develops over tropical west SA and couples with the easterly wind anomaly, forming a structure consistent with theoretical Kelvin waves that propagates further east, favoring the eastward convection propagation. This Kelvin wave propagation may help producing the strong convection over the northern part of CESA. Therefore, the convection over SA strengthens the Kelvin wave component of the easterlies, as also does convection over Africa and Indian Ocean (Sakaeda and Roundy 2015). The propagation of Kelvin waves associated with South American enhanced tropical convection towards Africa has been documented (e.g., Wang and Fu 2007; Liebmann et al. 2009; Guo et al. 2014).
It seems therefore, that while in phase 7 the convection starting in tropical Americas (including northwest SA) may be associated with the extratropical Rossby response propagating equatorward and the eastern Pacific equatorial anomalous winds are associated with wave-mean flow interaction of this extratropical response with the equatorial band, in phase 8 a Kelvin wave structure can already contribute to the tropical eastward propagation, associated with an upper level negative geopotential anomaly over western equatorial SA (Sakaeda and Roundy 2015). This is consistent with the appearance of negative precipitation anomalies in this region in phases 8 and 1, while the positive anomalies move eastward.
Although it is not possible to rule out the contribution of extratropical teleconnection already in phase 8, its convection anomalies are also coherent with the Kelvin and Rossby wave off-equatorial frictional components of boundary layer convergence (Sect. 3). The convergence extends into CESA in phase 8 (Fig. 2), as the equatorial Rossby wave extending over the Atlantic (Fig. 4) can constructively interfere with the incident Kelvin wave in producing off-equatorial meridional wind component and boundary layer convergence (Wang and Rui 1990; Salby et al. 1994; Masunaga 2007). Although the propagation of the upper-level equatorial easterly anomalies (and its associated upper-level divergence), associated with the equatorial Kelvin and Rossby waves as well as extratropical Rossby waves, can enhance or suppress convection along the path of the MJO, a more standing behavior and stronger convection anomalies tend to occur at preferred locations (Roundy and Frank 2004). CESA is probably one such region (even though with much less intensity than the Indian Ocean/Maritime Continent), partly due to its augmented topography (Fig. 1, lower panel), able to favor maximum regional convergence. It is noteworthy that the significant tropical precipitation anomalies over SA in phase 8 follow a signature of possible interaction between the westerly-northwesterly anomalous low-level winds penetrating the continent (Fig. 3) and its main north–south oriented orographic features over CESA (cf. Fig. 7, phase 8, and Fig. 1, lower panel). The OLR Hovmoller diagram (Fig. 6) shows that convection (OLR) and zonal wind display a rather standing oscillation over SA, with the signal in the zonal wind propagating towards Africa afterwards.
Figure 10 indicates that just tropical MJO-related convection would probably not cause as much rainfall over CESA as observed. The much more enhanced precipitation in late phase 1 is probably due to the subtropical rainfall anomalies caused by the extratropical teleconnection starting in central subtropical South Pacific Ocean, propagating poleward, and turning from the extratropics into subtropical SA. This pattern is already visible in phase 8, but is stronger over SA in phase 1 (Fig. 5). It produces anticyclonic anomaly over the southern continent and cyclonic anomaly over the subtropics, similar to a circulation structure detected in previous studies as associated with a convective dipole between CESA and SESA (e.g., Casarin and Kousky 1986; Diaz and Aceituno 2003). This feature, which is barotropic in the subtropics/extratropics (Figs. 4, 5), favors moisture flux from the Amazon into CESA (and the SACZ), where there is moisture convergence, and divergence of moisture flux from the middle/lower Parana/La Plata Basin (SESA). The moisture flux is not shown, but is similar to the low-level winds displayed in Fig. 3. Furthermore, this feature favors uplift over southern CESA and subsidence to the southwest, over SESA, coherently with the precipitation anomalies in phases 8 and 1 (Fig. 7). Hirata and Grimm (2015) also showed that the summertime negative zonal stretching deformation around the climatological position of the SACZ, associated with increased wave energy density in this region, is modulated by this feature of intraseasonal variability, influencing the development of rainfall extremes. The tropics–extratropics teleconnection not only favors a rain producing system over subtropical SA, but also strengthens anomalies over tropical SA, as this system propagates northeastward.
As the positive convection anomalies in central subtropical South Pacific disappear in phase 2 (Fig. 2), the wave train connecting this region and subtropical SA disappears (Figs. 4, 5), and the precipitation anomalies over CESA and SESA weaken (Fig. 7).
In phases 3, 4 and 5 convective anomalies tend to be opposite to those in phases 7, 8 and 1 (Fig. 2), with suppressed convection in equatorial central Pacific extending southeastward into the subtropics of central South Pacific, and also the circulation and precipitation anomalies are fairly opposite.
7 Teleconnections associated with the South American MJO signal and possible role in the MJO cycle
Investigation of the origins of the teleconnections that affect the South American precipitation in the MJO context is important for monitoring and forecast purposes, as well as for assessment of the models’ skill in subseasonal prediction. Moreover, the possible role of the South American MJO-related anomalies in producing teleconnections favoring MJO propagation and/or initiation of a new MJO cycle is also of interest. Some of the ideas first presented in Grimm and Silva Dias (1995b) are extended and detailed in this section.
7.1 Teleconnections producing the South American MJO-related anomalies
Figure 11a shows the OLR anomalies for phase 8, representing anomalous convection in the tropics/subtropics, while Fig. 11b shows the 200 hPa streamfunction anomalies combined at phases 8 and 1. This combination seeks the best representation of the lagged response to convection anomalies in phase 8, although phase 1 in Fig. 5 could also be used. A visual inspection is not sufficient to identify the possible origin of the Southern Hemisphere extratropical wave train in phases 8 and 1. It could be ascribed to different convection anomalies in the Indian Ocean and western or central Pacific Ocean. Therefore, it is convenient to look for the regions in which convective anomalies are more effective in producing the part of the wave train that affects most the precipitation anomalies over SA. To this end, the influence functions proposed by Grimm and Silva Dias (1995b) and simulations with an extended vorticity equation model are used, as explained in the Sect. 2.2.

a OLR anomalies associated with the MJO phase 8. Contour interval is 2.5 W m−2, zero line omitted. The ellipses indicate the convection anomalies relevant to the response in the tropics and in the Southern Hemisphere, according to criteria described in the text. b 200 hPa streamfunction anomalies combined at phases 8 and 1. Contour interval is 6 × 10⁵ m2 s−1; zero line omitted. c 200 hPa positive/negative idealized divergence anomalies prescribed for the simulation of the tropical and Southern Hemisphere response. Contour interval 10 × 10−7 s−1; zero line omitted. d Simulated 200 hPa streamfunction anomaly response. Contour interval is 2 × 10⁶ m2 s−1; zero line omitted. e, f Influence functions for austral summer basic state for target points 1 and 2, indicated in b. The values shown in each location are proportional to the streamfunction response at the target point to a unitary upper-level divergence anomaly in this location. Blue (red) contours represent negative (positive) values. The color shades in a and b indicate confidence levels according to the bar in Figs. 2, 3, 4 and 5
Figure 11c displays the upper-level positive/negative idealized divergence anomalies tested as possible forcing of the main tropical and Southern Hemisphere circulation anomalies, especially those producing the precipitation anomalies over SA. The choice of these divergence anomalies took into account their magnitude and their efficiency in producing the relevant response over SA, indicated by selected influence functions.
The most important streamfunction anomalies leading to the subtropical precipitation anomalies in SA during phases 8 and 1 are the anticyclonic/cyclonic patterns over southern/subtropical SA, around target points 1 and 2 (TP1 and TP2, Fig. 11b). The influence functions for these target points (Fig. 11e, f) show that, among the regions with relevant OLR anomalies, the largest influence resides in the southern subtropical Pacific, around 30°S. Therefore, besides the strongest tropical divergence anomalies, also weaker subtropical anomalies situated in regions of great influence are tested. Convection anomalies over Africa, Middle-East and other regions in the Northern Hemisphere are not considered since the influence functions for TP1 and TP2 are very weak in these regions.
Figure 11d shows the 200 hPa streamfunction steady response to the prescribed divergence anomalies. The main features of the tropical anomalous circulation are well reproduced, such as the anomalous quadrupole straddling the equator over the Indian and Pacific oceans. The Southern Hemisphere extratropical anomalous circulation is also well reproduced, including the wave train with its anticyclone/cyclone pair over SA. The anticyclonic pair over tropical SA is not present, since it is forced by the convective response over SA itself, which is not prescribed. There still are other non-correctly reproduced features over the Atlantic Ocean, Africa and other parts of the Northern Hemisphere, which also depend on the anomalous convection over SA and on anomalies in the Northern Hemisphere, not prescribed in this experiment (see Sect. 7.2).
In order to shed further light on the origin of the MJO-related circulation anomalies leading to precipitation anomalies in SA, experiments were carried out separately with the most relevant individual upper-level divergence anomalies occurring around phase 8 (Fig. 12). The anomalous upper-level convergence over the Maritime Continent (Fig. 12a), the strongest anomaly in this period, is responsible for the main tropical circulation anomalies in the Indian and Pacific oceans, but does not produce the observed response over SA and Atlantic Ocean, or in the extratropics in general (cf. Figs. 11b, 12a).

Simulation of the 200 hPa streamfunction response to different components of the 200 hPa idealized divergence anomalies during phase 8 of MJO, in order to test their contribution to the tropical and Southern Hemisphere response, especially over South America. a Upper-level tropical convergence over the Maritime Continent; b upper-level tropical divergence over Central Pacific; c upper-level divergence in southern subtropical Central Pacific. Blue (red) colors represent negative (positive) values. Contour interval is 10 × 10−7 s−1 for divergence and 2 × 10⁶ m2 s−1 for streamfunction; zero lines omitted
The response to the upper-level divergence over the equatorial Central Pacific (Fig. 12b) is not similar to the observed response (Fig. 11b), except in the tropical central Pacific Ocean. However, it improves the response to the upper-level convergence over the Maritime Continent (Fig. 12a), as shown by the response to the combined convergence/divergence anomalies in both regions (Fig. 12c). This response improves the quadrupole straddling the equator in the tropics, besides some other aspects, but does not reproduce the observed response over the extratropics and over SA/Atlantic Ocean (cf. Figs. 11b, 12c).
To reproduce the extratropical response it is necessary to take into account the subtropical divergence/convergence anomalies, which, although not strong, are situated in regions of strong influence. For instance, Grimm and Silva Dias (1995a, b) showed that the subtropical North Pacific is a more important source region for the ENSO-related Pacific-North American teleconnection pattern than the equatorial Central Pacific, even if the divergence/convergence anomalies around the equator are stronger than in the subtropics. Therefore, to reproduce the extratropical circulation anomalies, it is necessary to prescribe the subtropical divergence/convergence anomalies. The influence functions for TP1 and TP2 (Fig. 11 e, f) display high values in the southern subtropical Central Pacific, a region with relevant MJO-related divergence anomalies, although secondary. These functions also have high values in other regions, especially in the extratropics, but these regions do not contain relevant MJO-related convection anomalies. In the case of TP1 and TP2, the most relevant OLR anomaly extends southeastward from the equatorial anomaly over the Central Pacific, indicating a SPCZ shifted eastward in phase 8 (Fig. 11a). This anomaly is in the subtropical region with strong negative influence function for TP1 and strong positive influence function for TP2 (Fig. 11e, f). Therefore, upper-level divergence in this region is efficient in producing negative streamfunction anomalies around TP1 and positive ones around TP2, as observed. It is possible to argue that the upper level convergence over the Maritime Continent similarly extends to the subtropics, over and east of Australia (Fig. 11a), also entering the subtropical region with the same sign of influence function, and thus could produce response opposite to the observed one around TP1 and TP2. However, the influence functions of TP1 and TP2 are weaker to the west, near Australia, than over the Central Pacific. Therefore, only the response to the subtropical divergence in Central Pacific is shown (Fig. 12d). Although the subtropical convergence over and east of Australia contributes to the response over the extratropical South Pacific (Fig. 11d), it does not produce the observed response over SA.
The simulation in Fig. 12d shows clearly the influence of upper-level divergence over southern subtropical central Pacific in producing the pair anticyclone–cyclone over SA that is important in producing enhanced precipitation over SACZ and decreased precipitation over southern Parana/La Plata Basin. The same divergence anomaly also contributes to the tropical anticyclonic pair straddling the equator in Central Pacific and to a more realistic wave train over North Pacific and North America (cf. Figs. 11b, 12d).
7.2 Teleconnections produced by the South American MJO-related anomalies
Grimm and Silva Dias (1995b) suggested that the South American MJO-related convection anomalies produced global circulation anomalies able to significantly influence the MJO-related circulation and the initiation of a new cycle in the Indian Ocean. Those first ideas are further explored here, in the light of the observational results obtained in this study and using also more recent results related with the same ideas.
The simulated streamfunction anomalies in Fig. 11d are different from the observed anomalies over equatorial SA and Atlantic (Fig. 11b) because the anomalous MJO-related divergence over SA is not prescribed in this simulation. Although the convection anomalies over SA are weaker than over Indian Ocean and west Pacific Ocean, they can influence the global circulation response to MJO and the initiation of the MJO in the Indian Ocean. As described in Sect. 3, the main proposed mechanisms for the MJO initiation are the circumnavigating Kelvin wave and its contribution to the frictional moisture convergence over the Indian Ocean, and the influence of extratropical Rossby wave train propagation towards this region (Maloney and Wolding 2015, and references therein). The response to SA convection (Fig. 13) provides both mechanisms. It produces extratropical Rossby wave trains propagating towards the tropical Indian Ocean in both hemispheres, as well as tropics–tropics teleconnection.

Simulation of the 200 hPa streamfunction response to idealized 200 hPa divergence anomalies during phase 1 of MJO over South America. Contour interval is 10 × 10−7 s−1 for divergence and 2 × 10⁶ m2 s−1 for streamfunction; zero lines omitted
Furthermore, the response to SA anomalous convection (Fig. 13) contributes to improving the response to the Maritime Continent/Pacific forcing (Fig. 11d), since the superposition of both responses would produce streamfunction anomalies closer to the observed ones (Fig. 11b) over several regions, such as the tropical eastern Pacific, equatorial SA, tropical and North Atlantic, Africa and Eurasia. Therefore, the MJO-related anomalies in SA impact other regions, such as southeastern Africa, as shown by the summer intraseasonal teleconnections between SA and South Africa (Grimm and Reason 2015).
The tropical response reproduces the observed pair of anticyclones straddling the equator over tropical SA, as well as the opposite anomalies to its east. It extends the previously simulated tropical quadrupole pattern (Fig. 11d) eastward, as observed. It is convenient to remember that this equatorial response has also Rossby-wave component, as mentioned before.
There are several studies showing that Kelvin waves propagating eastward from SA may play an important role in modulating convective activity downstream. For instance, Wang and Fu (2007) and Liebmann et al. (2009) showed that convectively coupled Kelvin waves induced by deep convection in tropical SA propagate eastward across the Atlantic, producing changes in convection over the tropical Atlantic ITCZ, and then into Africa. Guo et al. (2014) showed that the activity of the convectively coupled Kelvin waves is greatly enhanced in MJO phase 1 over SA and tropical Atlantic, which coincides with the maximum MJO-related convection anomalies over SA. This activity also extends over tropical Africa and Indian Ocean, indicating possible linkage between the upstream Kelvin waves and the initiation of the MJO in the tropical western Indian Ocean. The enhanced low-level easterlies (and upper-level westerlies) over the Indian Ocean and the previous OLR anomalies over SA are consistent precursor signals of MJO initiation over the Indian Ocean (e.g., Straub 2013; Sakaeda and Roundy 2015).
The strengthening and further propagation of the low-level equatorial westerlies, after regions with weak values, by the spatially discontinuous enhanced convection along the path of the MJO over the WH during phases 7–2, is visible in Fig. 3. The westerlies almost disappear over the eastern tropical Pacific in phase 7, but reappear in phase 8 over the Americas, associated with the enhanced convection over Central America and northwestern SA. In the same way, they are weak over the tropical Atlantic in phase 8, but are strengthened in phase 1, associated with the enhanced convection over CESA. Thus, the anomalous convection over SA sustains the propagation of the equatorial westerlies until Africa, where they meet the easterlies of the Rossby wave associated with the reduced convection over the Maritime Continent, and enhance convection over Africa.
Although the anomalous convection over SA shows weaker connection with the large-scale organization of the intraseasonal oscillations than convection in the Indian and Pacific oceans, in the austral summer it can have a significant role. In this season, the frequency of occurrence of Kelvin waves in the equatorial region (15°N–15°S) displays a minimum in the eastern Pacific, but is reinforced over SA, Atlantic Ocean and Africa (Masunaga 2007).
8 Summary and conclusions
The mechanisms of the MJO are reviewed along with its associated global convection and circulation anomalies in each of its eight phases, in order to place and explain the anomalies over SA in a global context. Unexplored aspects of the MJO impacts on SA are characterized, such as the filtered daily precipitation anomalies and changes in the frequency of extreme events. The contribution of teleconnections produced by different MJO-related convection anomalies to the mechanisms of these impacts is also further disclosed.
The MJO produces significant impact on the daily precipitation and its extreme events over SA, especially in CESA, where in phase 1 it increases the average daily precipitation by more than 30% of the climatological value. Although the precipitation anomalies tend to be opposite in opposite phases, there are deviations from this anti-symmetry. The transition from maximum negative to maximum positive anomalies in CESA takes longer than the opposite transition, and the maximum positive anomalies are more intense than the maximum negative anomalies. This can be attributed to further intensification of positive convection anomalies by regional processes and the CISK mechanism. Although there is general qualitative agreement between the OLR and the precipitation anomalies over SA, there are visible shifts between their maximum values, emphasizing the need for reliable precipitation data analysis.
Although the effect of the MJO on the frequency of extreme events is generally consistent with the effect on the average daily precipitation, there are notable differences. The areas affected by significant changes in the frequency of extreme events are generally larger than those undergoing significant changes in mean daily precipitation. The frequency of extreme events increases more than 2.0 times over the SACZ and the core monsoon region in phase 1 and more than 1.6 times in phase 3 in the middle Parana/La Plata Basin. These results emphasize the need for evaluating the skill in simulating the MJO impact on SA when selecting models for subseasonal prediction of extreme events during the summer monsoon.
The enhancement of MJO-related convection over the tropical WH, including the Americas and Africa, and the initiation of the MJO in the Indian Ocean, is most frequently associated with high-level equatorial easterly anomalies propagating eastward with large-scale divergence on its leading edge. This favors drop in surface pressure and anomalous convection over preferred regions in the WH, as SA. Although these easterly anomalies are often associated with a dry Kelvin wave radiated from the strong subsidence anomaly over the western Pacific warm pool, observational and modeling results show that not only equatorial Kelvin wave but also equatorial Rossby wave and extratropical Rossby wave trains produced by previous MJO-related convection contribute to these anomalies. The extratropical contribution is favored by the presence of basic state westerly wind in parts of the equatorial WH. The dynamics driving these easterly anomalies changes as they propagate, and there are regions in which they are due to an equatorial Rossby wave, while in others they are associated with the wave-mean flow interaction via the equatorward intrusion of midlatitude Rossby wave responses, and still in other regions the Kelvin wave dynamics dominates, as over SA, Africa and Indian Ocean (Sakaeda and Roundy 2015).
The evolution of the most intense MJO-related precipitation anomalies over SA depends on the interplay between tropics–tropics and tropics–extratropics teleconnections. The eastward equatorial propagating upper-level easterlies and associated upper-level divergence (and decreased surface pressure) favor enhanced tropical convection over Central America and northern SA, which is also favored on the downstream sides of troughs propagating equatorward with extratropical Rossby wave trains, including Northern Hemisphere wave trains (as in Kiladis and Weickmann 1997). Once convection has started, the upper tropospheric easterly wind is enhanced and, according to Sakaeda and Roundy (2015), as the easterly wind amplifies and propagates farther eastward, a negative upper-tropospheric geopotential height anomaly develops over tropical west SA and couples with the easterly wind anomaly, forming a structure consistent with theoretical Kelvin waves that propagates further east, favoring the eastward convection propagation. This propagation may help to initially produce the strong convection over the northern part of CESA. However, the maximum impact over SA occurs when a tropics–extratropics wave-train enters SA from the Southern Hemisphere midlatitudes and influences the precipitation anomalies. They then appear in the southern part of CESA (SACZ) and with opposite sign in SESA, and propagate northeastward, reinforcing the anomalies in the northern part of CESA and northeast SA, where they last a longer time. The enhancement of extreme events follows approximately the same evolution.
The off-equatorial frictional component of boundary layer convergence of the tropical Kelvin and Rossby waves is probably enhanced over CESA due to the augmented topography in this region. The patterns of precipitation anomalies over SA in phase 8 suggest interaction between the westerly-northwesterly anomalous low-level winds and the main north south oriented orographic features over CESA. However, the evolution of the main rainfall anomalies indicates that the strongest precipitation in late phase 1 is most probably due to the extratropical teleconnection starting in central subtropical South Pacific Ocean, which turns from the extratropics into subtropical SA. It produces an anticyclonic (cyclonic) anomaly over extratropical (subtropical) SA, favoring moisture convergence and uplift that enhances the SACZ while causing moisture divergence and subsidence to the southwest, over SESA. It also modifies the upper-level subtropical zonal wind, enhancing the negative zonal stretching in the SACZ and thus the wave energy density and convective activity (Hirata and Grimm 2015). This tropics–extratropics teleconnection not only favors a system responsible for precipitation anomalies over SACZ and SESA, but also strengthens the anomalies over tropical SA when the system propagates northeastward. The favorable conditions described above make CESA one preferred location for more standing and stronger convection anomalies along the path of the MJO. Grimm et al. (2007) showed that the topography in Southeast Brazil helps anchoring the SACZ in this region.
Influence function analysis and simulations of the response to the different components of upper-level anomalous divergence associated with the MJO-related anomalous convection indicate the most influential anomalies in producing the circulation perturbations that lead to the main precipitation anomalies over SA. The equatorial divergence/convergence anomalies over the Maritime Continent/Central Pacific are responsible for the main tropical circulation anomalies representing the equatorial Rossby/Kelvin wave response, important for the beginning of the anomalous convection over the continent, but do not produce the observed response over SA and Atlantic Ocean, or in the extratropics in general, especially the extratropical wave train turning into the subtropical SA. This wave train associated with the major enhancement of precipitation over SA is triggered by subtropical convection anomalies in southern central Pacific associated with the SPCZ shifted southeastward during phase 8. These anomalies are weaker than those over the Maritime Continent or the equatorial Central Pacific, but they are situated in a region that strongly favors the generation of the observed wavetrain turning into SA from the extratropics.
The simulations aimed to explain the teleconnections affecting SA do not reproduce several aspects of the MJO-related circulation over the equatorial SA, the Atlantic Ocean, Africa and other parts of the Northern Hemisphere, because these also depend on the convective anomalies over SA and other anomalies in the Northern Hemisphere, not prescribed in these experiments. The response to the MJO-related convection over SA contributes significantly to reproduce the observed circulation over tropical eastern Pacific, tropical SA, tropical and North Atlantic, Africa, Eurasia, and Indian Ocean. Furthermore, the response to SA convection can influence the MJO initiation in the Indian Ocean by providing the main mechanisms proposed for the MJO initiation: equatorial Kelvin/Rossby waves and extratropical Rossby wave trains propagating towards this region.
References
Alvarez MS, Vera CS, Kiladis GN, Liebmann B (2015) Influence of the Madden Julian Oscillation on precipitation and surface air temperature in South America. Clim Dyn 46:245–262
Barrett BS, Carrasco JF, Testino AP (2012) Madden–Julian Oscillation (MJO) modulation of atmospheric circulation and Chilean winter precipitation. J Clim 25:1678–1688
Carvalho LMV, Jones C, Liebmann B (2004) The South Atlantic convergence zone: intensity, form, persistence, and relationships with intraseasonal to interannual activity and extreme rainfall. J Clim 17:88–108
Casarin DP, Kousky VE (1986) Precipitation anomalies in Southern Brazil and variations of the atmospheric circulation. Rev Bras Meteor 1:83–90
Diaz A, Aceituno P (2003) Atmospheric circulation anomalies during episodes of enhanced and reduced convective cloudiness over Uruguay. J Clim 16:3171–3185
Duchon CE (1979) Lanczos filtering in one and two dimensions. J Appl Meteor 18:1016–1022
Ferranti L, Palmer TN, Molteni F, Klinker E (1990) Tropical–extratropical interaction associated with the 30–60 day oscillation and its impact on medium and extended range prediction. J Atmos Sci 47:2177–2199
Gill AE (1980) Some simple solutions for heat-induced tropical circulation. Q J R Meteor Soc 106:447–462
Grimm AM (2003) The El Niño impact on the summer monsoon in Brazil: regional processes versus remote influences. J Clim 16:263–280. https://doi.org/10.1175/1520-0442(2003)016%3C0263:TENIOT%3E2.0.CO;2
Grimm AM (2004) How do La Niña events disturb the summer monsoon system in Brazil? Clim Dyn 22:123–138. https://doi.org/10.1007/s00382-003-0368-7
Grimm AM (2011) Interannual climate variability in South America: impacts on seasonal precipitation, extreme events and possible effects of climate change. Stoch Environ Res Risk Assess 25: 537–554. https://doi.org/10.1007/s00477-010-0420-1
Grimm AM, Reason CJC (2015) Intraseasonal teleconnections between South America and South Africa. J Clim 28:9489–9497. https://doi.org/10.1175/JCLI-D-15-0116.1
Grimm AM, Saboia JPJ (2015) Interdecadal variability of the South American precipitation in the monsoon season. J Clim 28:755–775. https://doi.org/10.1175/JCLI-D-14-00046.1
Grimm AM, Silva Dias PL (1995a) Use of barotropic models in the study of the extratropical response to tropical heat sources. J Meteorol Soc Jpn 73:765–779. https://doi.org/10.2151/jmsj1965.73.4_765
Grimm AM, Silva Dias PL (1995b) Analysis of tropical–extratropical interactions with influence functions of a barotropic model. J Atmos Sci 52: 3538–3555. https://doi.org/10.1175/1520-0469(1995)052%3C3538:AOTIWI%3E2.0.CO;2
Grimm AM, Silva Dias MAF (2011) Synoptic and mesoscale processes in the South American monsoon. In: Chang CP, Ding Y, Lau NC, Johnson RH, Wang B, Yasunari T (eds) The global monsoon system: research and forecast, world scientific series on Asia-Pacific weather and climate, vol 5. World Scientific Publishing Company, Singapore, pp 239–256 (ISBN-13 978-981-4343-40-4; ISBN-10 981-4343-40-4)
Grimm AM, Tedeschi RG (2009) ENSO and extreme rainfall events in South America. J Clim 22:1589–1609. https://doi.org/10.1175/2008JCLI2429.1
Grimm AM, Zilli MT (2009) Interannual variability and seasonal evolution of summer monsoon rainfall in South America. J Clim 22:2257–2275. https://doi.org/10.1175/2008JCLI2345.1
Grimm AM, Vera CS, Mechoso CR (2005) The South American monsoon system. In: Chang CP, Wang B, Lau NCG (eds) The global monsoon system: research and forecast, WMO/TD 1266-TMRP 70, pp 219–238. http://www.wmo.int/pages/prog/arep/tmrp/documents/global_monsoon_system_IWM3.pdf. Accessed 15 Jan 2018
Grimm AM, Pal J, Giorgi F (2007) Connection between spring conditions and peak summer monsoon rainfall in South America: role of soil moisture, surface temperature, and topography in eastern Brazil. J Clim 20:5929–5945. https://doi.org/10.1175/2007JCLI1684.1
Grimm AM, Laureanti NC, Rodakoviski RB, Gama CB (2016) Interdecadal variability and extreme precipitation events in South America during the monsoon season. Clim Res 68:277–294. https://doi.org/10.3354/cr01375
Guo Y, Jiang X, Waliser DE (2014) Modulation of the convectively coupled Kelvin waves over South America and the tropical Atlantic ocean in association with the Madden–Julian Oscillation. J Atmos Sci 71:1371–1388
Haertel P, Straub K, Budsock A (2015) Transforming circumnavigating Kelvin waves that initiate and dissipate the Madden–Julian Oscillation. Q J R Meteorol Soc 141:1586–1602
Hendon HH, Salby ML (1994) The life cycle of the Madden–Julian Oscillation. J Atmos Sci 51:2225–2237
Hirata FE, Grimm AM (2015) The role of synoptic and intraseasonal anomalies in the life cycle of summer rainfall extremes over South America. Clim Dyn 46: 3041–3055. https://doi.org/10.1007/s00382-015-2751-6
Hirata FE, Grimm AM (2017) Extended-range prediction of South Atlantic convergence zone rainfall with calibrated CFSv2 reforecast. Clim Dyn. https://doi.org/10.1007/s00382-017-3836-1
Houze RA Jr, Chen SS, Kingsmill DE (2000) Convection over the Pacific warm pool in relation to the atmospheric Kelvin–Rossby wave. J Atmos Sci 57:3058–3089
Hsu HH, Hoskins BJ, Jin FF (1990) The 1985/86 intra-seasonal oscillation and the role of the extratropics. J Atmos Sci 47:823–839
Hung MP, Lin JL, Wang W, Kim D, Shinoda T, Weaver SJ (2013) MJO and convectively coupled equatorial waves simulated by CMIP5 climate models. J Clim 26:6185–6214
Jones C, Carvalho LMV (2002) Active and break phases in the South American monsoon system. J Clim 15:905–914
Jones C, Carvalho LMV, Lau KM, Stern W (2004) Global occurrences of extreme precipitation events and the Madden–Julian Oscillation: observations and predictability. J Clim 17:4575–4589
Kalnay E et al (1996) The NCEP/NCAR 40-year reanalysis project. Bull Am Meteor Soc 77:437–471
Kiladis GN, Weickmann KM (1997) Horizontal structure and seasonality of large-scale circulations associated with submonthly tropical convection. Mon Weather Rev 125:1997–2013
Kiladis GN, Straub KH, Haertel PT (2005) Zonal and vertical structure of the Madden–Julian Oscillation. J Atmos Sci 62:2790–2809
Kiladis GN, Wheeler MC, Haertel PT, Straub KH, Roundy PE (2009) Convectively coupled equatorial waves. Rev Geophys 47:RG2003
Kousky VE (1988) Pentad outgoing longwave radiation climatology for the South American sector. Rev Bras Meteor 3:217–231
Kraukunas I, Hartmann DL (2007) Tropical stationary waves in a nonlinear shallow-water model with realistic basic states. J Atmos Sci 64:2540–2557
Lau KM, Peng L (1987) Origin of low-frequency (intraseasonal) oscillations in the tropical atmosphere. Part I: Basic theory. J Atmos Sci 44:950–972
Liebmann B, Allured D (2005) Daily precipitation grids for South America. Bull Am Meteor Soc 86:1567–1570
Liebmann B, Mechoso CR (2011) The South American monsoon system. In: Chang CP, Ding Y, Lau NC, Johnson RH, Wang B, Yasunari T (eds) The global monsoon system: research and forecast, world scientific series on Asia-Pacific weather and climate, vol 5, World Scientific Publishing Company, Singapore, pp 137–157 (ISBN-13 978-981-4343-40-4; ISBN-10 981-4343-40-4)
Liebmann B, Kiladis GN, Carvalho LMV, Jones C, Vera CS, Bladé I, Allured D (2009) Origin of convectively coupled Kelvin waves over South America. J Clim 22:300–315
Lim H, Chang CP (1983) Dynamics of teleconnections and Walker circulations forced by equatorial heating. J Atmos Sci 40:1897–1914
Lin JL et al (2006) Tropical intraseasonal variability in 14 IPCC AR4 climate models. Part I: convective signals. J Clim 19:2665–2690
Maloney ED, Hartmann DL (1998) Frictional moisture convergence in a composite lifecycle of the Madden–Julian Oscillation. J Clim 11:2387–2403
Maloney ED, Wolding BO (2015) Initiation of an intraseasonal oscillation in an aquaplanet general circulation model. J Adv Model Earth Syst 7:1956–1976
Marengo JA et al (2012) Recent developments on the South American monsoon system. Int J Climatol 32:1–21. https://doi.org/10.1002/joc.2254
Masunaga H (2007) Seasonality and regionality of the Madden–Julian Oscillation, Kelvin Wave, and equatorial Rossby Wave. J Atmos Sci 64:4400–4416
Matsuno T (1966) Quasi-Geostrophic motions in the equatorial area. J Meteorol Soc Jpn 44:25–43
Matthews AJ (2008) Primary and successive events in the Madden–Julian oscillation. Q J Roy Meteor Soc 134:439–453
Matthews AJ, Hoskins BJ, Masutani M (2004) The global response to tropical heating in the Madden–Julian oscillation during the northern winter. Q J R Meteorol Soc 130:1991–2011
Moskowitz BM, Bretherton CS (2000) An analysis of frictional feedback on a moist equatorial Kelvin mode. J Atmos Sci 57:2188–2206
Ohuchi K, Yamasaki M (1997) Kelvin wave-CISK controlled by surface friction: a possible mechanism of super cloud cluster. Part I: Linear theory. J Meteorol Soc Jpn 75:497–511
Paegle JN, Byerle LA, Mo K (2000) Intraseasonal modulation of South American summer precipitation. Mon Weather Rev 128:837–850
Powell SW, Houze RA (2015) Effect of dry large-scale vertical motions on initial MJO convective onset. J Geophys Res Atmos 120:4783–4805. https://doi.org/10.1002/2014JD022961
Ray P, Li T (2013) Relative roles of circumnavigating waves and extratropics on the MJO and its relationship with the mean state. J Atmos Sci 70:876–893
Ray P, Zhang C (2010) A case study on the mechanisms of extratropical influence on the Madden–Julian Oscillation. J Atmos Sci 67:515–528
Richman MB (1986) Rotation of principal components. J Climatol 6:293–335
Roundy PE, Frank WM (2004) Effects of low-frequency wave interactions on intraseasonal oscillations. J Atmos Sci 61:3025–3040
Sakaeda N, Roundy PE (2015) The development of upper-tropospheric wind over the Western Hemisphere in association with MJO convective initiation. J Atmos Sci 72:3138–3160
Salby ML, Garcia RR, Hendon HH (1994) Planetary-scale circulations in the presence of climatological and wave-induced heating. J Atmos Sci 51:2344–2367
Seo KH, Kim KY (2003) Propagation and initiation mechanisms of the Madden–Julian oscillation. J Geophys Res 108(D13):4384
Seo KH, Son SW (2012) The global atmospheric circulation response to tropical diabatic heating associated with the Madden–Julian Oscillation during northern winter. J Atmos Sci 69:79–96
Souza EB, Ambrizzi T (2006) Modulation of the intraseasonal rainfall over tropical Brazil by the Madden–Julian Oscillation. Int J Climatol 26:1759–1776
Straub KH (2013) MJO initiation in the real-time multivariate MJO index. J Clim 26:1130–1151
Waliser DE, Lau WKM, Stern WF, Jones C (2003) Potential predictability and the Madden–Julian Oscillation. Bull Am Meteor Soc 84:33–50
Wang B (1988) Dynamics of tropical low-frequency waves: an analysis of the moist Kelvin wave. J Atmos Sci 45:2051–2065
Wang B (2005) Theory. In: Lau WKM, Waliser DE (eds) Intraseasonal variability in the atmosphere–ocean climate system. Springer, New York, pp 307–360
Wang B, Chen G (2017) A general theoretical framework for understanding essential dynamics of Madden–Julian oscillation. Clim Dyn 49:2309–2328. https://doi.org/10.1007/s00382-016-3448-1
Wang H, Fu R (2007) The influence of Amazon rainfall on the Atlantic ITCZ through convectively coupled Kelvin waves. J Clim 20:1188–1201
Wang B, Li T (1994) Convective interaction with boundary layer dynamics in the development of the tropical intraseasonal system. J Atmos Sci 51:1386–1400
Wang B, Rui H (1990) Dynamics of the coupled moist Kelvin–Rossby wave on an equatorial-plane. J Atmos Sci 47:397–413
Wang B, Liu F, Chen G (2016) A trio–interaction theory for Madden–Julian oscillation. Geosci Lett 3:34. https://doi.org/10.1186/s40562-016-0066-z
Webster PJ, Holton JR (1982) Cross-equatorial response to middle-latitude forcing in a zonally varying basic state. J Atmos Sci 39:722–733
Weisheimer A, Corti S, Palmer T, Vitart F (2014) Addressing model error through atmospheric stochastic physical parametrizations: impact on the coupled ECMWF seasonal forecasting system. Phil Trans R Soc A 372:20130290
Wheeler MC, Hendon HH (2004) An all-season real-time multivariate MJO index: development of an index for monitoring and precipitation. Mon Weather Rev 132:1917–1932
Wheeler MC, Kiladis GN, Webster PJ (2000) Large-scale dynamical fields associated with convectively coupled equatorial Waves. J Atmos Sci 57:613–640
Wilks DS (2006) Statistical methods in the atmospheric sciences. Academic Press, London
Xie SP, Kubokawa A (1990) On the wave-CISK in the presence of a frictional boundary layer. J Meteorol Soc Jpn 68:651–657
Zhang C (2005) The Madden–Julian Oscillation. Rev Geophys 43:RG2003
Zhang C (2013) Madden–Julian Oscillation: bridging weather and climate. Bull Am Meteor Soc 94:1849–1870. https://doi.org/10.1175/BAMS-D-12-00026.1
Acknowledgements
This study was supported by the National Council for Scientific and Technological Development (CNPq-Brazil) and by the Inter-American Institute for Global Change Research (IAI) Grant CRN3035, which is supported by the US National Science Foundation (Grant GEO-1128040). The author thanks Dr. George Kiladis and two anonymous reviewers for their comments on this article. The optimal working conditions at the International Centre for Theoretical Physics (Trieste) during visits under a Senior Associateship award are also gratefully acknowledged.
Author information
Authors and Affiliations
Corresponding author
Additional information
Publisher’s Note
Springer Nature remains neutral with regard to jurisdictional claims in published maps and institutional affiliations.
Rights and permissions
About this article

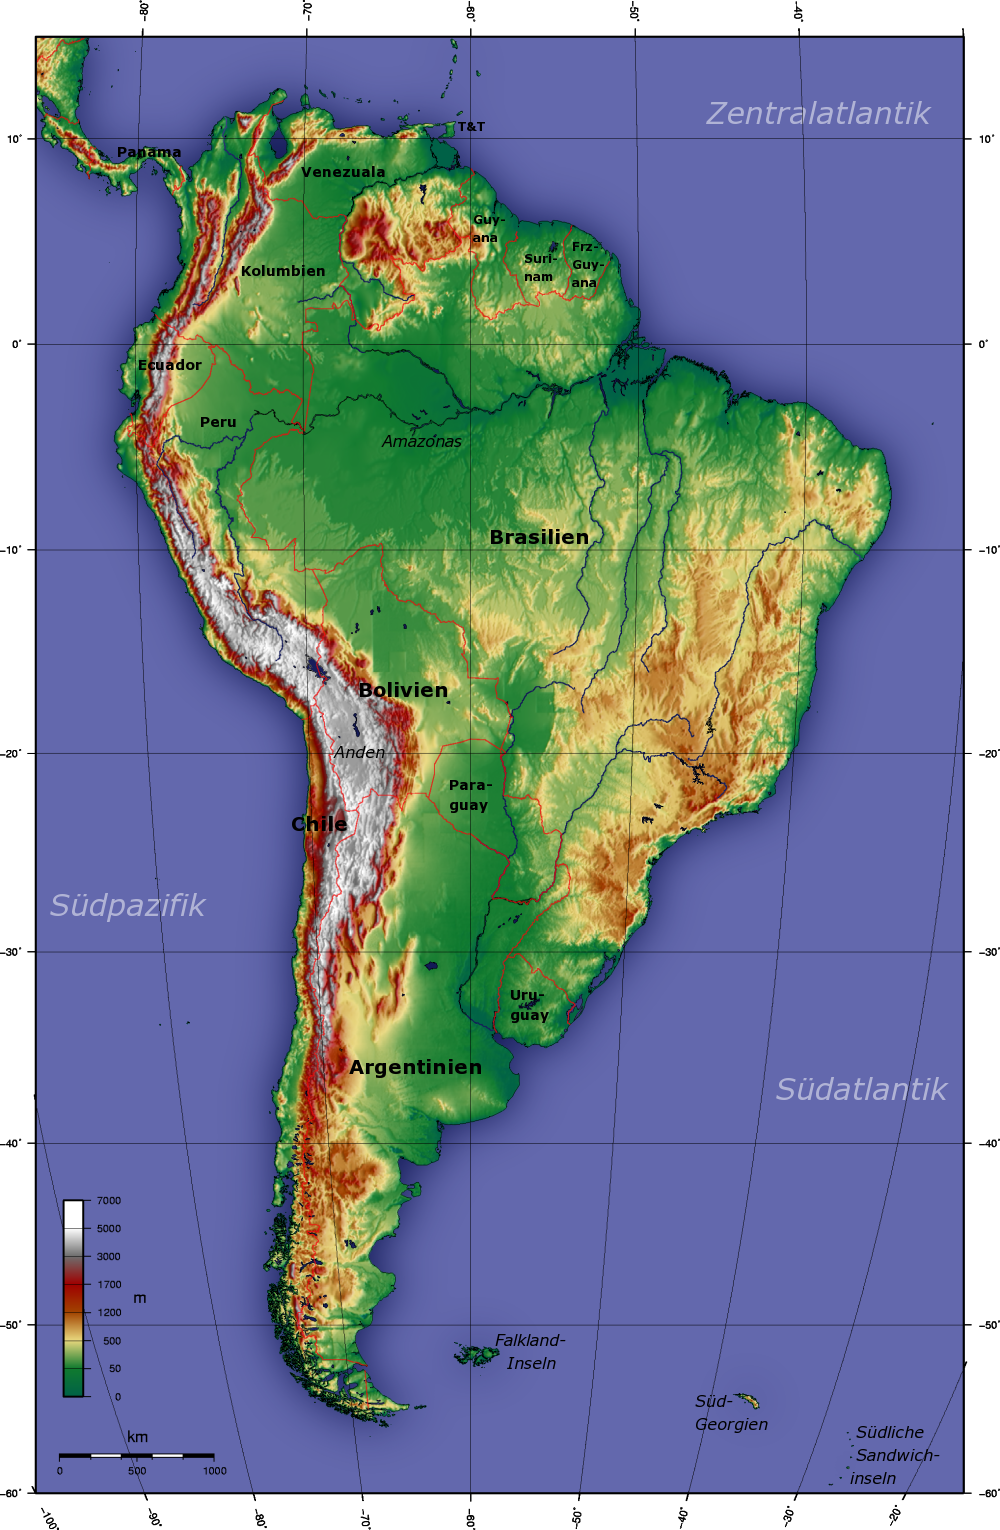
Cite this article
Grimm, A.M. Madden–Julian Oscillation impacts on South American summer monsoon season: precipitation anomalies, extreme events, teleconnections, and role in the MJO cycle. Clim Dyn 53, 907–932 (2019). https://doi.org/10.1007/s00382-019-04622-6
Received:
Accepted:
Published:
Issue Date:
DOI: https://doi.org/10.1007/s00382-019-04622-6