
Abstract
Introduction and hypothesis
In pelvic floor muscle (PFM) electromyography (EMG) two different bipolar configurations are applied: “true differential” configuration (TD) measures neuromuscular activity with two ipsilateral electrodes, whereas “faux differential” configuration (FD) has two electrodes placed on each side of the PFMs. The aim of the study was to determine possible differences and the relationship between both configurations.
Methods
A secondary data analysis of 28 continent (CON) and 22 stress urinary incontinent (SUI) women was performed. Surface EMG was measured using a vaginal probe during maximal voluntary (MVC) and fast voluntary (FVC) contractions. TD and FD were explored with amplitude- and time-related EMG parameters, cross-correlation coefficients (R(0)) and statistical parametric mapping (SPM).
Results
Of a total of 62 comparisons of EMG parameters of MVC and FVC, only one comparison showed significant differences between the two configurations (CON group, FVC4peak TD versus FD, p = 0.015). R(0) were high in both groups for all MVC and FVC variables (R(0) ≥ 0.989). SPM detected 3 out of 28 comparisons with short (0.124–0.404 s) significant supra-threshold clusters (p < 0.025).
Conclusions
The findings suggest that TD and FD might measure neuromuscular activity almost the same. Very high cross-correlation coefficients and a very limited number of significant results from EMG parameters, as well as SPM, suggest that in the measured sample the choice of TD or FD might remain practically irrelevant. To gain further insight into the scientific and clinical relevance of choosing either of the electrode configurations, the comparisons should be re-evaluated on a sample with more severe incontinence symptoms.
Introduction
Assessment of the neuromuscular function of the pelvic floor muscles (PFMs) is of great clinical and scientific importance in understanding PFM functioning and disorders. Surface electromyography (EMG) is one of the most common methods used in the assessment and treatment of various pelvic floor disorders because of its practicability [1]. It was demonstrated to be a reliable method of assessing PFM activity [2,3,4,5,6]. To train the PFMs, it is widely applied as biofeedback in physical therapy practice [7]. Several vaginal probes are commercially available. For correct validation of PFM surface EMG, it is necessary to provide information about probe details, such as probe geometry, electrode size, electrode position and electrode configuration. One of the issues that varies amongst available probes and may have a major impact on interpretation of the findings is electrode configuration [2].
As monopolar configuration may result in greater noise and crosstalk [8], bipolar differential configuration (two electrodes positioned on the muscle of interest, one reference electrode on unrelated tissue) is preferred. On condition that the two electrodes do not lie too far apart and are placed correctly on the muscle of interest, the signal detected shows less noise [9]. According to surface electromyography for the non-invasive assessment of muscles (SENIAM; http://www.seniam.org), a muscle should be measured along its line of action, with the two electrodes placed perpendicular to fibre direction [10]. To date, the SENIAM group has not yet described the correct electrode placement or configuration for the PFMs. In vaginal probes, bipolar configuration is applied in two different ways, one referred to as a “true differential” (TD) and the other as a “faux differential” (FD) [8]. With TD, both electrodes lie on the same side (left or right) of the PFMs. With FD, two electrodes are placed on opposite sides of the PFMs (one left, one right) inside the vagina. Unfortunately, it is not yet conclusively determined if the PFMs can be considered as a functional entity that acts en masse [11] and can be measured contralaterally with FD, or if they have to be measured ipsilaterally and separately for each side. Owing to the physiological and theoretical aspects of bilateral innervation of the PFMs by the levator ani or pudendal nerves [12], it can be argued that PFM activity must be measured unilaterally. If this is true, an FD, because of the greater distance between the two poles, would not only lead to much more crosstalk [4] but also possibly to a non-valid measurement, violating the required measurement along the line of action [10]. Activation patterns of the PFMs may be different in continent and incontinent women with regard to ways of symmetry [13]. To better control this issue, it has been proposed to assess PFMs in a TD.
A state-of-the-art review compared 16 different vaginal probes in relation to probe geometry, electrode position and configuration [8]. According to the findings, only one probe that is commercially available, the Femiscan® (Mega Electronics, Kuopio, Finland), measures the PFMs in a TD. All other probes were either configured using an FD or monopolarly.
The probe used for this PFM EMG data collection provides the capability to measure both configurations during one assessment. To the author’s knowledge, a simultaneous comparison of TD and FD has not been done so far.
Since stress urinary incontinence (SUI) is a major health issue in women and it has been shown that activation patterns can alter with this health complaint [14], we chose to explore both electrode configurations and their applicability in continent as well as incontinent women. The possible time- and amplitude-related differences, as well as the relationship of PFM EMG activity measured by TD and FD in both populations (healthy and SUI), were investigated with this study. Our findings might lead to the consequent application of either of the electrode configurations, especially in a SUI population.
Materials and methods
Study design
The research question was answered with an exploratory post-hoc data analysis of a larger cross-sectional study [15, 16]. The study protocol was approved by the cantonal ethics committee of Bern, Switzerland (KEK-No. 319/14).
Participants
Participants were recruited by the Women’s Hospital, Urogynaecology, Bern University Hospital and Bern University of Applied Sciences, Department of Health Professions. Fifty women were included in the study: 28 in the continent (CON) and 22 in the stress urinary incontinent (SUI) group. Inclusion criteria were age between 18 and 60 years, body mass index (BMI) 18–30 kg/m2, as well as a negative pregnancy test or being at least 12 months postpartum. Exclusion criteria were any contraindications for the measurement procedures such as inflammation, tumour, urogynaecological surgery or any Pelvic Organ Prolapse Quantification (POP-Q [17]) stage >1, as diagnosed by an experienced urogynaecologist.
After having given their written consent, participants answered the International Consultation on Incontinence Questionnaire Urinary Incontinence Short Form (ICIQ-UI-sf, German version) [18] to establish their level of continence.
Materials
The STIMPON® probe (Innocept Biobedded Systems, Oberhausen, Germany) used in this study consists of three poles of stainless steel and was embedded in a soft tampon (Prodry® Tampon; Innocept Biobedded Systems, Oberhausen, Germany), immersed in physiological saline solution before placement into the vagina. The probe had a diameter of 2.7 cm and a length of 7 cm. Inter-pole distance was 2 cm. Each pole was connected to a cable of a distinct colour and pole orientation was as shown in Fig. 1. A small protrusion on the probe marked the position of the pole, which had to be centred at the middle and back of the perineum to ensure measurement with both TD and FD. A single-use wet-gel electrode (BlueSensor N; Ambu, Ballerup, Denmark) acted as a reference electrode and was placed on the left iliac crest.
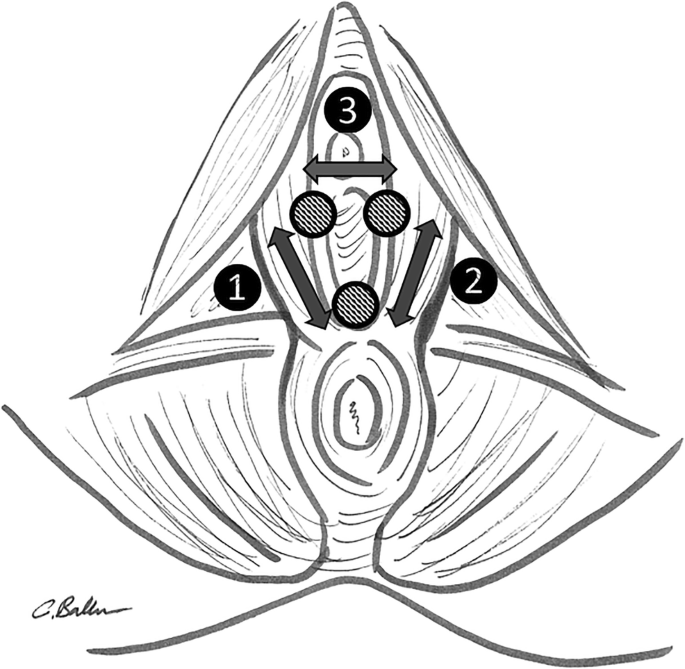
Schematic drawing of the pelvic floor muscles (caudal view) with location of the three poles of STIMPON®, display of electrode configuration and resulting three electromyography (EMG) channels: 1 unilateral EMG signal, right (TDr); 2 unilateral EMG signal, left (TD1); 3 bilateral EMG signal, right-left (FD)
Surface EMG was recorded by a 16-channel system (TeleMyo 2400 G2; Noraxon USA, Scottsdale, AZ, USA; sampling rate 3 kHz). The electrodes were connected to the telemetric system with use of a preamplifier (baseline noise: <1 μV RMS; input impedance: >100 MΩ; common mode rejection ratio: >100 dB; input range: ± 10 mV; base gain: 500; integrated band-pass filter: 10–500 Hz). Impedance of the electrodes was controlled (Digitimer model D175; Digitimer, Welwyn Garden City, UK) and had to be ≤2 kΩ to be accepted.
Test procedures
After emptying their bladder, the participants were instructed on how to contract their PFMs. An experienced physiotherapist controlled digitally if a correct contraction could be performed. A maximal voluntary contraction was scored with the modified Oxford grading scale [19] in supine position and the symmetry of the contraction was determined by palpation. The participants applied the probes themselves whereupon correct placement (orientation and depth) of the probe was controlled by the examiner to make sure that the required orientation for configuration comparison was provided.
Electromyography was measured in an upright standing position. Although this may result in higher activity at rest [20], this position was considered more functional than the lithotomy position and allowed better comparisons with further investigations such as running or jumping. First, rest activity was recorded for 30 s. Second, two maximal voluntary contractions (MVCs) with 5-s hold and 15 s of rest between trials. Finally, five consecutive fast voluntary contractions (FVC) with 5 s of rest between trials were recorded.
Data processing
Electromyography data were processed using custom software in MATLAB (version 2017b; The MathWorks, Natick, MA, USA). Raw EMG data were 10-Hz high-pass and 500-Hz lowpass filtered (zerolag Butterworth filter, 2nd order). For onset determination, the muscle was considered active superior to the mean of rest plus one standard deviation (SD) for both MVC and FVC, according to Hodges and Bui [21]. For MVC and FVC analyses, data were smoothed with a moving root mean square (RMS) process before amplitude- and time-related parameters were extracted. Window lengths of 200 ms and 100 ms were applied during the moving RMS filtering for the MVC and FVC EMGs respectively. The windows were shifted by one sample at each filter iteration and hence overlapped maximally. EMG data were normalised to the peak of MVC (100 %MVC) of each participant. EMG from each MVC contraction was normalised to its individual peak value (100%). FVCs were normalised to the mean of both MVC peak values.
For the comparison of electrode configurations, the two EMG channels right (r) and left (l) each represent a TD, whereas the third channel right–left (r–l) represents an FD configuration (Fig. 1). From those three channels, the following parameters were extracted: FVCpeak, as an amplitude-related variable, represents the peak of each FVC signal in %MVC. The time-related variables MVCtimepoint of peak and FVCtimepoint of peak express the timepoint of the peak value of each contraction in milliseconds. To make a comparison between channels possible, the timing of the onset of a contraction has to be determined. To compare the onset of the activity of the different channels, the following time-related variable was calculated: MVConset difference and FVConset difference. This onset difference expresses possible delays in the calculated onset of TD and FD in milliseconds. All variables were compared in the two possible ways for TD versus FD, namely: r versus r-l (TDr/FD) and l versus r-l (TDl/FD). Time-related parameters for FD were calculated twice, first with respect to onset of the right channel (FDrOn) and second with respect to onset of the left channel (FDlOn). This was necessary to make comparisons interpretable.
Comparing EMG data with pre-determined discrete amplitude- and time-related parameters cuts down the waveform signal of EMG [22]. Subsequently, to perform a more complete EMG analysis, and so as not to lose any information on the complete contraction, relationships and differences within and between data were analysed using cross-correlation analyses and statistical parametric mapping (SPM).
Cross-correlations provide a method of comparing timing and shape of EMG signals [23]. Cross-correlation coefficients (R) of MVC and FVC signals were determined based on the normalised signals (%MVC) at time lag zero R(0). MVC was examined from 500 ms before and 10,000 ms after onset, FVC from 500 ms before and 3,000 ms after onset.
Statistical parametric mapping (SPM) was performed as a further method of curve sketching and is a method of comparing continuous data such as EMG time curves between different conditions [24]. Again, EMG data were normalised to the MVC and examined over the same time period as cross-correlations.
Raw EMG data, as well as the detected onsets and offsets of the smoothed and rectified data, were controlled visually for plausible timing using MATLAB software. Where necessary, visual determination was used for adjustment [5].
Statistical analysis
The exploratory design used various statistical methods. MVC1–2 and FVC1–5 were examined separately per group (CON, SUI). In the three EMG parameters peak, timepoint of peak and onset difference, a total of 62 comparisons were possible (FVC1–5 peak, MVC1–2 timepoint of peak/FVC1–5 timepoint of peak and MVC1–2 onset difference /FVC1–5 onset difference = 62). To test normal distribution of data, all variables were subjected to Shapiro–Wilk tests. A level of significance of p ≥ 0.25 was considered necessary for normal distribution to minimise danger of β-error [25]. As normal distribution across all amplitude- and time-related EMG parameters was almost never given, paired non-parametric tests were performed (Wilcoxon tests of TDr/FDrOn or TDl/FDlOn). Statistical analysis for these variables was performed using SPSS software (version 24.0 for Windows, SPSS, Chicago, IL, USA).
To explore all cross-correlations R(0) of TD with FD, a total of 28 correlations resulted (TDr with FDrOn and TDl with FDlOn for MVC1–2 and FVC1–5 in the CON and SUI groups). To account for skewed distribution of the data, medians and interquartile ranges of the coefficients were examined. R(0) values were calculated using MATLAB.
The same 28 comparisons were submitted to SPM. All statistical procedures were performed using non-parametric tests according to Chi-squared tests implemented in SPM, as normality of the distribution across the samples of both CON and SUI was almost never given. SPM analyses were implemented in MATLAB using the opensource spm1d code [22] (v.M0.4, www.spm1d.org).
To make the comparisons interpretable, FD variables had to be calculated in relation to the onset of either TDr or TDl. Because of this dependency and to counteract the problem of multiple comparisons, the α level of a significant test was set to p < 0.025 for all amplitude- and time-related parameters and SPM procedures.
Results
Baseline comparison of demographics showed that there was a significant difference in age between the groups (Table 1). The groups did not differ in terms of weight, BMI or height. Both groups had a similar score on the modified Oxford grading scale, meaning that there was no significant difference in digitally palpated muscle performance of the PFMs between the two groups. In the ICIQ-UI-sf, the CON group scored an average of 0.5 points, whereas the SUI group scored a significantly higher average of 6.5 points. In some participants there was a digitally distinguishable stronger contraction of either the left or right side of the PFMs. In the SUI group half of the participants showed asymmetry, whereas in the CON group only 4 out of 28 showed asymmetry.
All examined EMG parameters are presented in Tables 2, 3, 4, 5, 6, and 7. FVC1–5peak median amplitude ranged from 86.2 to 96.4 %MVC in CON participants and from 87.6 to 101.9 %MVC in SUI participants. In FVC1–5 from both groups, one significant difference could be found in the CON group (FVC4peak TDr/FD, p = 0.015).
The MVC1–5 timepoint of peak medians ranged from 1,196.2 ms to 2,375.5 ms in CON participants and from 1,232.7 to 3,026.3 ms in SUI participants. For FVC1–5 timepoint of peak medians ranged from 394.0 to 514.7 ms (CON) and from 438.0 to 702.8 ms (SUI). For MVC1–2 timepoint of peak and FVC1–5 timepoint of peak, no statistically significant difference could be shown in the comparison of TDr/FD and TDl/FDlOn in CON or SUI.
The MVConset difference and FVConset difference showed median differences from 0.5 to 16.2 ms with IQR from 37.8 to 169.5 ms in both CON and SUI. There was no statistically significant difference in the onset timing of the muscle in TDr/FDrOn and TDl/FDlOn.
Median cross-correlation coefficients of TDr with FDrOn and TDl with FDlOn resulted in R(0) 0.994 in both CON and SUI for MVC1,2. For FVC1–5 in the CON group, median R(0) ranged from 0.992 to 0.994, and from 0.989 to 0.993 for SUI. All interquartile ranges were equal to 0.01.
Same as for cross-correlations, SPM analyses of MVC and FVC showed highly similar curve patterns (Fig. 2). Nevertheless, there were 3 out of a total of 28 comparisons with significant supra-threshold clusters (p ≥ 0.001 ≤ 0.022) with a total extent of significant time of 0.124–0.404 s for MVC in the SUI group (Table 8).

Data analysis with statistical parametric mapping (SPM). Top: median and percentiles of faux differential (FD) of all 22 participants in the stress urinary incontinence (SUI) group versus true differential 1 (TDl) for maximal voluntary contraction 1 (MVC1). Bottom: test statistics for SPM for the same dataset. Critical threshold at α level 0.025 (dashed line), amount of curve below the critical threshold shows significant curve values as displayed in Table 8. SnPM: statistical non-parametric mapping, tested using non-parametric tests owing to non-normal distribution
Discussion
Up to now, conclusive knowledge about the relevance of the application of “true differential” versus “faux differential” configuration for the EMG of PFMs is lacking. A secondary data analysis was performed focusing on time- and amplitude-related EMG parameters, cross-correlations and SPM to explore differences and relationships between TD and FD. Although differences in discrete EMG parameters were almost non-existent and the cross-correlation coefficients were generally very high, the SPM comparisons showed a very limited number of significant supra-threshold clusters (Fig. 2) in incontinent women. It is questionable whether the small number of 3 significant out of 28 comparisons in total is relevant, especially when the supra-threshold clusters compared with the total time of the contraction remain very short.
In current research, the question of measuring both sides of the PFMs separately is often neglected [26]. To date, when both sides of PFM activity have been reported separately [2, 26], it was either only for healthy nulliparous women or performed with monopolar configurations [2], which include more crosstalk and noise [8]. Although it is known that the PFMs are innervated bilaterally by the nerves of the sacral plexus [12], EMG analyses have shown that unequal distribution of this innervation exists [27]. This does not necessarily have an underlying pathology, as it was found in asymptomatic as well as patients with a PFM disorder [27]. A probe with TD could take asymmetry into account, but implies that both sides (TDr and TDl) are measured and reported, which is not the current standard in EMG research for the PFMs [26]. Although there seemed to be a significant number of SUI participants with digitally palpated asymmetry, no difference could be shown when both sides of the PFMs were measured with TD and with FD. Although the choice of TD versus FD is theoretically and physiologically justifiable, in this investigation it apparently remains practically irrelevant.
A strength of the study is the presentation of normalised EMG parameters. To make it possible to compare different muscles, time-aspects or participants, surface EMG activity should always be normalised [28]. Raw EMG data, presented in microvolts (μV), the original measurement values, should not be used for comparisons owing to individual independencies. It was decided to examine and compare each contraction separately to account for the individuality of each contraction, although fatigue or learning effects did not visibly change the contractions.
The use of a probe with a tight fit in the vagina is another important strength. It is not only essential for testing in upright or even dynamic procedures, but also necessary to understand the behaviour of the PFMs during activities of daily living or sports in symptomatic patients. As it was shown that body positions only slightly affect PFM activity during voluntary contractions, the measurements in upright standing position cannot be considered as a limitation [20].
Some limitation is related to the test procedures. Although the position of the probe was controlled after insertion into the vagina, during and after the test procedures, no reassessment of the probe position was performed. Although unlikely because of the tight fit of the probe in the vagina due to the benefit of the tampon, shifting or rotational displacement during the test procedures cannot be excluded. If the probe had rotated, the recorded signals would not truly express a “true differential” configuration for the right and the left channels or “faux differential” configuration for the right–left channel.
Another limitation might be the chosen sample. As this was an exploratory study, the sample size of 50 was considered sufficient and no power analysis was performed. There were no differences in the Oxford score between CON and SUI. Both groups had high median scores, suggesting moderate to strong PFMs [19]. The relatively low median ICIQ-UI-sf score (6.5) in the SUI group represents a slightly affected population. In a study by Espuña-Pons et al. [29], mean values of 13.6 for the ICIQ-UI-sf score were reported for incontinent persons, which is much higher than in the examined sample.
As for the assessment of asymmetry, digital palpation is controversially discussed [30]. It remains questionable whether asymmetry assessed with palpation is a reliable outcome parameter and how much it should be weighted in the proof of existing asymmetry. Although a rather high number of participants with palpable asymmetric activation were reported, this did not correspond with the very limited results of significant comparisons of TD versus FD, where this should be likely to be reproduced.
Conclusions
In this study, apart from one exception in time-related EMG parameters in the CON group, SPM procedures were more sensitive and detected small but significant differences in TD versus FD. However, the results should be considered with caution as only 3 out of 28 possible comparisons differed significantly in very short supra-threshold clusters. Therefore, the recommendation of measuring PFMs with TD remains questionable. It is indeed possible for the PFMs to be interpreted as a single muscle, as proposed earlier [11], with very high cross-correlation coefficients of TD with FD support. As the SUI group from this study had high Oxford grading and low ICIQ-UI-sf scores, the results may not be generalisable to patients suffering from more severe SUI, higher asymmetry and weakness. To gather further insights into the scientific and clinical relevance of choosing either electrode configuration for these patients, the comparisons should be re-evaluated in a sample with lower Oxford scores, higher ICIQ-UI-sf scores, or asymmetry assessed by more valid measurement methods than palpation only.
References
Bø K, Sherburn M. Evaluation of female pelvic-floor muscle function and strength. Phys Ther. 2005;85:269.
Auchincloss C, McLean L. The reliability of surface EMG recorded from the pelvic floor muscles. J Neurosci Methods. 2009;182:85–96. https://doi.org/10.1016/j.jneumeth.2009.05.027.
Enck P, Vodušek DB. Electromyography of pelvic floor muscles. J Electromyogr Kinesiol. 2006;16:568–77. https://doi.org/10.1016/j.jelekin.2006.08.007.
Grape H, Dedering Å, Jonasson A. Retest reliability of surface electromyography on the pelvic floor muscles. Neurourol Urodyn. 2009;28:395–9. https://doi.org/10.1002/nau.20648.
Koenig I, Luginbuehl H, Radlinger L. Reliability of pelvic floor muscle electromyography tested on healthy women and women with pelvic floor muscle dysfunction. Ann Phys Rehabil Med. 2017;60:382–6. https://doi.org/10.1016/j.rehab.2017.04.002.
Luginbuehl H, Baeyens JP, Kuhn A, Christen R, Oberli B, Eichelberger P, et al. Pelvic floor muscle reflex activity during coughing—an exploratory and reliability study. Ann Phys Rehabil Med. 2016;59:302–7. https://doi.org/10.1016/j.rehab.2016.04.005.
Dumoulin C, Hay-Smith EJ, Mac Habee-Seguin G (2014) Pelvic floor muscle training versus no treatment, or inactive control treatments, for urinary incontinence in women. Cochrane Database Syst Rev. (5):CD005654. https://doi.org/10.1002/14651858.CD005654.pub3.
Keshwani N, McLean L. State of the art review: intravaginal probes for recording electromyography from the pelvic floor muscles. Neurourol Urodyn. 2015;34:104–12. https://doi.org/10.1002/nau.22529.
Flury N, Koenig I, Radlinger L. Crosstalk considerations in studies evaluating pelvic floor muscles using surface electromyography in women: a scoping review. Arch Gynecol Obstet. 2017;295:799–809. https://doi.org/10.1007/s00404-017-4300-5.
Hermens HJ, Freriks B, Disselhorst-Klug C, Rau G. Development of recommendations for SEMG sensors and sensor placement procedures. J Electromyogr Kinesiol. 2000;10:361–74. https://doi.org/10.1016/S1050-6411(00)00027-4.
Shafik A. A new concept of the anatomy of the anal sphincter mechanism and the physiology of defecation: mass contraction of the pelvic floor muscles. Int Urogynecol J Pelvic Floor Dysfunct. 1998;9:28–32.
Thor KB, de Groat WC. Neural control of the female urethral and anal rhabdosphincters and pelvic floor muscles. Am J Physiol Regul Integr Comp Physiol. 2010;299:R416–38. https://doi.org/10.1152/ajpregu.00111.2010.
Madill SJ, Harvey MA, McLean L. Women with stress urinary incontinence demonstrate motor control differences during coughing. J Electromyogr Kinesiol. 2010;20:804–12. https://doi.org/10.1016/j.jelekin.2009.10.006.
Madill SJ, Harvey MA, McLean L. Women with SUI demonstrate motor control differences during voluntary pelvic floor muscle contractions. Int Urogynecol J Pelvic Floor Dysfunct. 2009;20:447–59. https://doi.org/10.1007/s00192-008-0800-y.
Leitner M, Moser H, Eichelberger P, Kuhn A, Radlinger L. Evaluation of pelvic floor muscle activity during running in continent and incontinent women: an exploratory study. Neurourol Urodyn. 2017;36:1570–6. https://doi.org/10.1002/nau.23151.
Moser H, Leitner M, Eichelberger P, Kuhn A, Baeyens JP, Radlinger L. Pelvic floor muscle activity during jumps in continent and incontinent women: an exploratory study. Arch Gynecol Obstet. 2018;297:1455–63. https://doi.org/10.1007/s00404-018-4734-4.
Bump RC, Mattiasson A, Bø K, Brubaker LP, DeLancey JO, Klarskov P, et al. The standardization of terminology of female pelvic organ prolapse and pelvic floor dysfunction. Am J Obstet Gynecol. 1996;175:10–7.
Avery K, Donovan J, Peters TJ, Shaw C, Gotoh M, Abrams P. ICIQ: a brief and robust measure for evaluating the symptoms and impact of urinary incontinence. Neurourol Urodyn. 2004;23:322–30. https://doi.org/10.1002/nau.20041.
Laycock J, Jerwood D. Pelvic floor muscle assessment: the PERFECT scheme. Physiotherapy. 2001;87:631–42.
Chmielewska D, Stania M, Sobota G, Kwaśna K, Błaszczak E, Taradaj J, et al. Impact of different body positions on bioelectrical activity of the pelvic floor muscles in nulliparous continent women. Biomed Res Int. 2015;2015:905897. https://doi.org/10.1155/2015/905897.
Hodges P, Bui BH. A comparison of computer-based methods for the determination of onset of muscle contraction using electromyography. Electroencephalogr Clin Neurophysiol. 1996;101:511-519. https://doi.org/10.1016/S0921-884X(96)95190-5.
Pataky TC, Vanrenterghem J, Robinson MA. Zero- vs. one-dimensional, parametric vs. non-parametric, and confidence interval vs. hypothesis testing procedures in one-dimensional biomechanical trajectory analysis. J Biomech. 2015;48:1277–85. https://doi.org/10.1016/j.jbiomech.2015.02.051.
Wren TA, Do KP, Rethlefsen SA, Healy B. Cross-correlation as a method for comparing dynamic electromyography signals during gait. J Biomech. 2006;39:2714–8. https://doi.org/10.1016/j.jbiomech.2005.09.006.
Robinson MA, Vanrenterghem J, Pataky TC. Statistical parametric mapping (SPM) for alpha-based statistical analyses of multi-muscle EMG time-series. J Electromyogr Kinesiol. 2015;25:14–9. https://doi.org/10.1016/j.jelekin.2014.10.018.
Bortz J, Schuster C. Statistik für Human- und Sozialwissenschaftler. 2010. Heidelberg: Springer.
Voorham-van der Zalm PJ, Voorham JC, van den Bos TW, Ouwerkerk TJ, Putter H, Wasser MN, et al. Reliability and differentiation of pelvic floor muscle electromyography measurements in healthy volunteers using a new device: the multiple Array probe Leiden (MAPLe). Neurourol Urodyn. 2013;32:341–8. https://doi.org/10.1002/nau.22311.
Enck P, Hinninghofen H, Wietek B, Becker HD. Functional asymmetry of pelvic floor innervation and its role in the pathogenesis of fecal incontinence. Digestion. 2004;69:102–11. https://doi.org/10.1159/000077876.
Burden A, Bartlett R. Normalisation of EMG amplitude: an evaluation and comparison of old and new methods. Med Eng Phys. 1999;21:247–57. https://doi.org/10.1016/S1350-4533(99)00054-5.
Espuña-Pons M, Dilla T, Castro D, Carbonell C, Casariego J, Puig-Clota M. Analysis of the value of the ICIQ-UI SF questionnaire and stress test in the differential diagnosis of the type of urinary incontinence. Neurourol Urodyn. 2007;26:836–41. https://doi.org/10.1002/nau.20379.
Morin M, Dumoulin C, Bourbonnais D, Gravel D, Lemieux MC. Pelvic floor maximal strength using vaginal digital assessment compared to dynamometric measurements. Neurourol Urodyn. 2004;23:336–41. https://doi.org/10.1002/nau.20021.
Author information
Authors and Affiliations
Contributions
C.B.: project development, data analysis, manuscript writing; P.E.: data processing, manuscript writing; M.L.: data collection, data processing; H.M.: data collection, data processing; H.L.: project development, manuscript writing; A.K.: medical advisor, recruitment of participants; L.R.: project development, data analysis, manuscript writing.
Ethics declarations
Conflicts of interest
None.
Additional information
Publisher’s note
Springer Nature remains neutral with regard to jurisdictional claims in published maps and institutional affiliations.
Rights and permissions
About this article

Cite this article
Ballmer, C., Eichelberger, P., Leitner, M. et al. Electromyography of pelvic floor muscles with true differential versus faux differential electrode configuration. Int Urogynecol J 31, 2051–2059 (2020). https://doi.org/10.1007/s00192-020-04225-4
Received:
Accepted:
Published:
Issue Date:
DOI: https://doi.org/10.1007/s00192-020-04225-4