
Abstract
Private vehicle ownership is rapidly increasing in the cities. The increase in the overall population of private vehicles/middle-range vehicles in the city is causing congestion on the roads as well as parking problems. The study is concerned with Vadodara city. Parking facilities in the city are inefficient. “On-street” parking is the norm in almost all the major parts of the city. Commercial plazas are emerging along major routes, but only a few of them have proper parking facilities. It ultimately leads to the illegal occupation of streets for parking, which leads to congestion. Public consensus is required to adopt a suitable parking policy. The work aims to identify and analyze the problems pertaining to parking faced by the public. We aim to understand how the public perceives the problem of urban parking. For this purpose, we have conducted a survey via Google forms of about a hundred residents of the city. The work will focus on identifying current parking planning problems and suggest new or improved parking management strategies.
Access provided by Autonomous University of Puebla. Download chapter PDF
Keywords
9.1 Introduction
A vehicle spends most of its life in parking, unutilized by its owner. The normal use of personal vehicles such as cars and bikes are for short market trips, trips to the workplace, and daily commutes [1]. In recent years, Indian cities have seen a massive increase in the number of privately owned vehicles in urban as well as rural areas. With an increasing number of vehicles, the demand for parking is increasing exponentially, and vehicles require parking space at every location we take them with us. There are a number of reasons for the increasing number of vehicles registering in India each passing year. However, public transport facilities also increase at around the same speed [2, 3]. Therefore, making parking is an unignorable topic in every aspect of planning, infrastructure development, etc., because 96% of a car’s time is spent in parking.
There are three main aspects of any transportation system for its efficient running: the vehicles through which the transportation will be done, the right of way for driving, and the terminal for starting and ending the journey. Railway uses locomotives and wagons for transporting passengers and goods on its dedicated right of way, which is solely used by railways and not by any other mode of transport. Railways and terminals are dedicated to railway transportation. For air transportation, there are planes carrying passengers and cargo on their right of way through airports and cargo terminals. In the case of land transportation, cars, trucks, bikes, etc., are the vehicles, and roads, highways, and expressways are the right of way for traveling. Terminals for road transportation are different for different category of vehicles, such as bus stand for buses, auto stand for auto and rickshaws, and personal and public parking spaces for private vehicles (cars and bikes). The number of vehicles by rail and air is limited due to many constraints, but it is not the same in the case of road transportation [4]. With the westernization of India, the number of private vehicles, especially cars, has increased dramatically in the last two decades.
9.1.1 Introduction to Vadodara City
Baroda, situated on the bank of River Vishwamitri, is said to be that name derived from the great Saint Vishwamitra. In 1974 Baroda was changed to Vadodara, but some people still like to call it by its old name. Vadodara is the 3rd largest city in Gujarat. The area under Vadodara Municipal Corporation (VMC) is about 160 sq. km [5]. It has a population of over two people and a population density of 10,415 persons per sq. km, according to the 2011 Census [6]. Vadodara/Baroda city is known as ‘Sanskar Nagri’ and ‘Sayaji-Nagari.’ The Vadodara city flourished from the year 1875 under the rule of Maharaja Sayajirao III. During his rule, Baroda progressed and achieved a name in all fields, such as establishing compulsory primary education, university, library system, art, and architecture [5].
The city is mainly divided into two parts, one is the old city which has Maharaja Sayajirao University, Laxmi Vilas Palace, Pratap Vilas Palace, and the narrow-gauge line station Pratap Nagar, and the other one is the new city called Alkapuri, which is properly planned and developed with future vision [5]. Since Vadodara was an established city for a long time, it has a substantial population of more than 22 lakhs, and the old city is not planned well to meet future demands. Like many cities in India, Vadodara has narrow streets and crowded markets. With the increasing population, these narrow streets aren’t able to handle the demand of traffic, and hence driving in the city becomes a hectic task for local people.
9.1.2 Motorization
There has been a rise in job prospects in our cities due to globalization, privatization, and liberalization. People’s income levels have risen as a result. This, combined with the falling cost of automobiles, has resulted in a massive surge in demand for personal vehicles. Because the increase of registered automobiles always outnumbers population growth and new roads are developed, travel risks and traffic exposure grow much higher with rising motorization and expanding road networks [7].
Low-density decentralization wreaks havoc on public transportation. It results in fewer targeted trips in heavily frequented corridors, making transportation more difficult to serve. It has significantly increased vehicle and motorcycle usage in India, resulting in congested roadways, slower bus speeds, higher bus operating expenses, and reduced public transportation utilization. Walking and cycling account for nearly half of all journeys in medium-sized cities and about a third in large cities as cities grow and travel distances increase [7].
However, there is a lot of variety in car usage within the city. According to research, a private automobile is motionless for 96% of its lifetime [8]. Despite this, while traffic congestion, road connection, and road quality are all important factors in urban transportation design, parking remains a minor consideration in urban infrastructure planning. Parking has been identified as a critical component in major cities worldwide, prompting the development of parking policies and plans. However, in India, the issue of parking has not been given the attention it deserves.
Some may claim that parking is one of urban transportation’s minor annoyances, yet this viewpoint has resulted in its removal from policy, resulting in numerous traffic jams. As a result, poor quality urban transportation, land abuse, and rising social and environmental costs result. India’s cities are all experiencing a transportation issues. While problems like a bad connection, poor road quality, traffic congestion, and air and noise pollution are regularly addressed, parking negligence negatively impacts urban transportation quality [7].
With the rising number of private vehicles on the road, it is critical that parking be viewed as a critical component of creating an effective transportation system in our cities. Parking is a significant issue in the push-and-pull method to better urban transportation, which involves fewer vehicles and more cycling, walking, and public transportation. This study will look at parking as a significant economic element rather than just an externality of private transportation. Instead of seeing parking as a problem to be solved, it should be viewed as a tool that can be used to create jobs and income while also improving the general quality of urban transportation.
India’s urban population grew from 2.58 million in 1901 to 121 million in 2011 [7]. This number is rapidly rising as more individuals migrate to cities in search of work and better living conditions. These numbers constitute a severe danger to the current urban transportation infrastructure, especially when the expansion of road space is so small in contrast. This necessitates the establishment of a more comprehensive urban planning strategy. The rising reliance on private autos will only exacerbate traffic congestion. Bridging these gaps will be easier with a better-organized parking system.
9.1.3 Parking Requirements
For a city’s prosperity, an efficient motor traffic system is required. Motor traffic can serve many of the city’s business and commercial activities. Parking is an integral part of urban mobility. Individuals, communities, and transportation networks are all affected in long- and short-term ways. Parking is an issue contributing to traffic congestion [7]. They need a parking spot where passengers can load and unload their belongings. Individuals who own a car will most likely prefer to travel to their destination by car if parking is conveniently situated at the destination and the cost of parking is fair. In other words, parking is an incentive if it is cheap or free and abundant. Parking is a significant deterrent to driving one’s car.
Varied types of buildings have different parking needs. Only a common parking place is required for residential plots of less than 300 sq. m. A minimum of one-fourth of the open land on a residential plot of 500–1000 sq. m should be set aside for parking. At least one parking place may be required for every 70 sq. m of office space. In a restaurant, one parking place is sufficient for ten seats, whereas theaters and cinema halls require only one parking space for 20 seats. As a result, different land use zones have different parking needs.
9.1.4 Key Concerns Related to Parking
-
1.
Growth in the number of vehicles.
The city’s parking supply is insufficient, given the increase in the car population. In the long run, demand will surpass supply, resulting in tremendous hardship and a terrible standard of living. The necessity of the hour is for a policy to minimize and diminish reliance on private vehicles [7].
-
2.
Need for Effective Public Transport
The transition from private vehicles to public transportation must be facilitated by providing efficient transportation options. Multiple modes must be investigated to provide and design an effective public transportation system [7].
-
3.
Coordinate Operational urban planning
Change must be brought about through coordinated operational urban planning with the active participation of the planning institutions. The city’s present planning tools are woefully insufficient. The provision of parking and the shift to public transportation must be factored into project legislation and operational planning. This necessitates a fresh approach to planning [7].
-
4.
Enforcement of parking restrictions
It is necessary to create order on the city’s streets. Strict enforcement of parking rules and regulations will bring about a change in people’s irresponsible behavior of parking on roads [7].
Although the Building Bye Laws require parking in the basement and an adequate number of car parks in the buildings, there has been widespread violation [7].
Slowly constructing parking infrastructure to fulfill high demand in congested places. Adequate funding for the construction of parking lots and transit-oriented infrastructure is required. The parking policy framework addresses many challenges and concerns [7].
9.2 Study Framework
9.2.1 Need of the Study
-
1.
According to 2006 research by the Central Road Research Institute in New Delhi, the average car is parked 95% of the time and only steers 4% of the time. Every day, each car requires/occupies an average of three separate parking places throughout the city. Every day, each car occupies 69 sq. m of land, most of which is public space.
-
2.
As the number of vehicles and their use in cities grows, so does the need for parking spaces. (Average rise of 1 to 1.2 lakh vehicles in Vadodara).
-
3.
The new trend of using buildings with increased densities of people, such as shopping malls and multiplexes, has resulted in adopting measures for the commercial use of buildings and accompanying parking requirements.
-
4.
An increase in car holdings and private vehicle ownership has aggravated the problems.
-
5.
Increase in traffic every year by 18–20%.
-
6.
Violations of parking bylaws.
-
7.
Insufficient mass transportation facilities increase the number of vehicles on the road.
-
8.
Local Govt. Fail to develop parking lots.
9.2.2 Aim
To assess parking problems in Vadodara city by studying the public’s perception of the problems they face on a day-to-day basis. We aim to survey the resident of Vadodara and want to know their opinion on the present status of the parking problem in the city. This will give us a better understanding of the parking scenario in the city. Based on the citizens’ responses, we have tried to analyze the significant problems and suggest measures and recommendations to solve the parking problem.
9.2.3 Objectives
-
1.
To carry out surveys of citizens using online questionnaires to study the existing parking conditions and problems in the city.
-
2.
To find out the major parking problems and their causes in the city.
-
3.
To carry out residents’ surveys using online questionnaires to study the existing parking conditions and problems in the city.
-
4.
To study the correlation between various factors of parking behavior and problems faced by the residents.
-
5.
To recommend possible solutions for the problems.
9.2.4 Methodology
Examining the reports and plans that are now available. The study located, gathered, and examined accessible reports, plans, survey data, and statistics relating to parking in Baroda. The parking regulations and practices were investigated. In addition, secondary sources of information were gathered by contacting relevant authorities and government departments.
Analysis of Data and Inferences
-
A qualitative study of the responses received
-
Graphical representation of the data through bar charts, pie charts, etc.
-
Finding a Correlation between the various factors affecting parking behavior, based on the Likert scale
Data from all the parking surveys were analyzed in terms of computing various parking characteristics, such as parking accumulation, parking duration, parking index, parking turnover, the need for off-street parking, and commuters’ opinions on the acceptability of various parking management plans. Based on the data analysis, conclusions were formed. Commuter opinion on parking and adoption of various parking management plans. Based on the data analysis, conclusions were formed.
The questionnaire was divided into five segments
-
Prevailing parking conditions in Vadodara
-
Parking pricing
-
Locational choices affecting parking
-
Parking preferences
-
Problems faced while parking in a complexes
Suggestions and recommendations. The data analysis and inferences generated aided in making ideas and advocating specific strategies to address the parking problem in the neighborhood.
9.2.5 Scope and Limitations
-
The scope will be limited to the number of respondents to the online questionnaire.
-
The scope of the study is limited to selected areas of Vadodara city.
-
It will be based on a small data pool as it is not viable to collect a huge data pool due to resource constraints.
-
The study will be limited to responses from one or two citizens from each area of the city which attempts to represent the city trend.
-
The impact of the virtual market on parking requirements has not been considered.
-
The impact of transit-oriented development has not been studied.
9.3 Data Collection and Data Analysis
9.3.1 Data Collection Matrix
Table 9.1 shows the data collection matrix used in this study.
9.3.2 Vadodara City Profile
Vadodara, formerly known as Baroda, is the third most populous city in Gujarat, after Ahmedabad and Surat. It is the administrative center of the Vadodara District and is situated on the banks of the Vishwamitri River, 141 km from Gandhinagar, the state capital. The Delhi–Mumbai railway line and the national highway 8 (NH8) pass through Vadodara. Vadodara is one of India’s top ten fastest-growing cities, with a population of about 2 million people as of 2011. The city is home to the Lakshmi Vilas Palace, which was originally possessed by the Marathas’ royal Gaekwad dynasty [5].
The Maharaja Sayajirao University of Baroda (Vadodara), Gujarat’s largest university, is also located here. The city is a significant industrial, cultural, and educational hub in western India, with multiple national and regional institutions and major industries such as petrochemicals, engineering, chemicals, pharmaceuticals, plastics, information technology, and foreign exchange services. By crossing the one-million population milestone in 1991, Vadodara and seven other cities throughout the country became a metropolis. The corporation’s boundaries have shifted, and outgrowths have arisen as areas that encompass all of the facilities inside the corporation’s boundaries, producing an urban agglomeration [7, 8].
According to Census data, population trends suggest that the population is steadily expanding, despite the fact that the rate of growth in each decade is decreasing. From 1971 to 1981, the highest growth rate was obtained. This could be linked to industrial establishments appearing out of nowhere. When major industrial units are established in a location, several smaller businesses spring up as a result. Recent trends suggest a decreasing growth rate, with a decade-long average of 24.17% from 2001 to 2011 [7, 8]. Table 9.2 shows the metadata of Vadodara city.
9.3.3 Vehicle Data
An expressway, national and state highways, broad-gauge and meter-gauge railways, and an airport connect Vadodara to the rest of the country. The majority of the city’s transportation system relies on roadways. The pace of rise in vehicle growth has been boosted by 8.5%. There is a lot of traffic on the roads right now. As a result, considerable air pollution has resulted.
Total vehicles in VMC limit. As per the R.T.O. record, within the VMC limit in 2010, the total number of vehicles was 1,100,037. In 2011, 2012, 2013, 2014, and 2015 total number of vehicles was 1,301,156, 1,409,526, 1,538,259, and 1,673,882, respectively. So, in 2021 total vehicles will be incising 2,493,282 with an average growth rate of 8.5%.
Type of vehicle in VMC limit
Type of vehicle in VMC limit in 2015. Within the Vadodara Municipal Corporation (VMC) limit, out of total vehicles, there are 76% two-wheeler, 16% four-wheelers, 3% three-wheeler, 4% goods, and 1% passenger vehicles are in the year 2015.
Type of vehicle increasing per year in VMC limit. As per the R.T.O. record purchase of vehicles out of total vehicles, 92% of vehicles are purchased in urban centers. The chart shows the growth pattern of various vehicle segments in Vadodara in the last 4 years. In Vadodara, within the VMC limit, the average growth rate of two-wheelers, four-wheelers, and three-wheelers increase by 8.5, 9.33, and 8.25% per year simultaneously. In short, every year, 1.2 lakh vehicles are increasing in Vadodara, which indicates that the demand for parking is increasing drastically.
9.3.4 Data Analysis (Questionnaire Survey)
Current Parking Condition. Most participants are not satisfied with the current parking conditions on the road (Fig. 9.1).

Satisfaction with the current parking situation
Core Problem for Parking. This question was asked to assess the core problem of parking in the city. 82.7% of the respondents believe that ‘Finding a place to park’ is the major problem. 9.1% of the respondents feel vehicle safety is a significant parking problem. Other factors, such as parking fares, dedicated parking slots, lack of proper parking areas, etc., are other problems that got minimal responses (Fig. 9.2).

Core problem in parking vehicles
Parking on roads causes congestion. 93.3% of the respondents answered that illegal parking on the roads causes traffic congestion. Illegal parking on the roads is a major contributor to the parking problems in the city (Fig. 9.3).

Illegal parking—a cause of congestion of not
Main reasons for parking problems on the roads. To assess the main reasons for parking problems, this question was asked. The respondents had mixed opinions. Shopper parking and daily commuter parking are major reasons for the parking problem on the road. Apart from that, Commercial vehicles and residents parking from neighborhood areas account for 55.8 and 41.3% of the responses, respectively. Lack of dedicated parking slots, undisciplined parking, and high vehicle ownership is also a major reason for road parking problems (Fig. 9.4).

Reasons for parking problems
Timing of the Parking issues
Parking constraints generally happened during the evening time between 3 p.m. to 8 p.m. It accounted for about 63.5% of the parking issues that occurred in the evening time. About 12.5% of the respondents answered that they face parking problems throughout the week, both on the week and the weekdays. The public faces limited parking issues during morning and noon hours (Fig. 9.5).

Peak time of parking problem
Parking as a location factor. According to their locational preferences, the respondents asked about parking problems. Respondents faced parking problems mainly in the markets, offices, and railway stations. Markets are the most problematic areas with respect to parking. About 90% of the respondents faced parking issues at the market. Railway stations/Bus stations and Temples followed with 60.6% and 53.8% of the responses (Fig. 9.6).

Locations in the city and parking problem
Parking space availability in residential areas. This question was asked to get an idea of the availability of parking spaces in the respondents’ residences. 58.7% of the respondents had enough parking spaces, while 41.3% of the respondents did not have enough parking spaces in their residences (Fig. 9.7).

Parking availability at the residence
Parking space availability in working premises. This question was asked to get an idea of the availability of parking spaces in the working premises of the respondents. 69.2% of the respondents had enough parking spaces, while 30.8% of the respondents did not have enough parking spaces in their residences (Fig. 9.8).

Parking space availability at working premises
Difficulties in finding a space to park in Resident Permit Zones. 43.3% of the respondents could find a space to park without much difficulty in a resident permit zone, while 19.2% of the respondents did not face any difficulties. And about 37.5% of the respondents face the problems occasionally. So, overall, it appears like a mixed response. A significant proportion of the respondents are facing difficulties while others are not (Fig. 9.9).

Difficulties in finding parking space in the resident permit zone
Difficulties in finding a space to park in Non-Resident Permit Zone. 37.5% of the respondents did not find space to park without much difficulty while parking in a Non-resident permit zone. Approximately 38.5% of the respondents sometimes face these problems, and only 24% of the respondents easily find a parking space. This means finding a space to park in a Non-resident zone is a cumbersome job. The majority of the respondents faced parking space constraints sometimes or other (Fig. 9.10).

Difficulties in finding parking space in non-residence zone
Parking for ‘Free on Streets.’ Free parking on streets is a prevalent practice in the city. Almost half of the respondents did not find space to park without much difficulty while parking on the streets. Approximately 30.8% of the respondents sometimes face these problems, and only 21.2% quickly found a space to park. This means that finding a space to park on the streets is difficult. Free parking on streets is easy for the citizens but finding a space in the first place is a hectic task (Fig. 9.11).

Availability of parking space on the street
Parking Pricing. In this section, questions were asked to the participants about the price of the parking. It aimed to study the paying behavior and readiness of the respondents while paying parking fees in a parking lot.
Free Parking to the residents. This question was asked to analyze how the residents feel about who should pay the parking fees or whether or not parking should be provided free of charge to the residents by the Government. One-third of the respondents were neutral and had no strong opinion on this statement. About 35.6% of the respondents strongly agreed that parking should be free for the residents. And 15.4% of the respondents strongly opposed the proposition of free parking (Fig. 9.12).

Free parking choice
Willingness to pay for Assured Parking. More than 80% of the respondents are firmly convinced that they will pay for parking if guaranteed an assured parking space. At the same time, some of the participants are not willing or unsure about the proposition. There is a strong consensus among the residents that they will pay for the parking if services are provided to them. So, we conclude that, generally, the residents do not want free parking but rather efficient parking services and are ready to pay for it (Fig. 9.13).

Willingness to pay for assured parking
Awareness about the parking charges in the city. Only about half of the respondents were aware of the parking charges in the city. The rest of the respondents are either unaware or unsure about the parking charges. So, we conclude there is a lack of information about the parking charges among the residents (see Fig. 9.14).

Parking charges in the city
Usage of Private vehicles if Parking Charges are taken. 44.2% of the respondents will use private vehicles even if parking charges are taken. Parking charges do not have a significant impact on their private vehicle usage. In contrast, a small fraction of the respondents will not use their private vehicles if parking charges are taken from them. So, we can say that charging parking charges will stop some of the residents from using private vehicles. Still, it will not have much impact on curbing the number of vehicles on the road as the majority of the residents will continue to travel in private vehicles and will pay the charges as demanded (Fig. 9.15). Table 9.3 shows the correlation between various factors of parking pricing.

Intention to pay parking charges
Correlation between willingness to pay parking charges and awareness of the parking charges
These two factors are slightly negatively correlated, but this value is so close to zero that there isn’t strong evidence for a significant association between these two variables.
Correlation between willingness to parking charges and usage of private vehicles
These two factors are strongly positively correlated. A high value of 0.86, which is very near to 1, suggests that those respondents who wish to use private vehicles are ready to pay the parking charges.
Parking charges per hour
It was asked to measure the extent of the amount that the residents are willing to pay for parking for an hour. 54.8%, that is, the majority is ready to pay Rs. 10/h for parking. Some of the residents also agreed to pay Rs. 15 and Rs. 20 per hour. But rare of the residents agreed to pay Rs. 30 per hour for parking. It brings us to the conclusion that parking charges should be minimal to encourage more people to use the parking facilities (Fig. 9.16).

Parking charges per hour
Public’s preferences of Parking. 28.8% of the respondents preferred roadside parking over parking lots. At the same time, about 70% of the respondents agreed to park their vehicle in a parking lot or a multistory parking lot if the parking spaces were available. It reflects the adaptability of most residents to use parking facilities instead of parking on the road, provided efficient parking services are made available to them. However, a particular segment needs to be adequately informed about the ill effects of roadside parking and thus needs to avoid it (Fig. 9.17).

Choice of parking
Those respondents, who willingly chose to park on the roadside, were asked to justify their responses. 51.6% of respondents feel that the walking distance from the vehicle to their destination is less when they park on the road. Less time required to park and better choice for a short stay is also an argument given by the respondents. They believe it is easy to park on roads and less time is required to park. So, they willingly chose roadside parking for their own sake of comfort and convenience. Here comes the role of towing vans and strict regulations by the Government. The strict regulations and heavy fines will change people’s attitudes (Fig. 9.18).

Favorable reason for roadside parking

Factors affecting parking

Security as a factor affecting the parking

Convenience as a factor affecting parking
The most important factor of Parking. The respondents were asked to rate the parking experience based on security, convenience, and cost. All these three factors were deemed necessary by the respondents, but the security of the vehicle was the top priority (Figs. 9.19, 9.20 and 9.21).
From the graph, we deduce that vehicle security is the respondents’ top priority.
Convenience and cost of parking are also essential factors in parking. But they are overridden by vehicle security. The cost of parking was the least priority of the respondents. What matters the most while parking is the safety and security of the vehicles in addition to the convenience of the commuter (Fig. 9.22). Table 9.4 shows the major correlation between vehicle security, convenience, and the cost of parking.

Cost as a factor affecting parking
Correlation between Vehicle security and convenience while parking
Vehicle security and convenience are slightly positively correlated. There is evidence for some association between these two variables.
Correlation between Vehicle security and Cost
Vehicle security and cost are positively correlated, but this value (0.3194) is relatively close to zero. So, there isn’t strong evidence for a significant association between these two variables.
Correlation between Convenience and Cost
Vehicle convenience and cost are positively correlated, but this value (0.2075) is relatively close to zero. So, there isn’t strong evidence for a significant association between these two variables. That is cost and convenience of parking do have an interrelationship.
Preference of Types of Parking
The respondents were shown in Fig. 9.23 and asked about their parking preferences. About 75% of the respondents chose Angled parking as their 1st preference, followed by perpendicular parking (Fig. 9.24). Parallel parking was the least preferred form of parking. Angled parking is the easiest parking method, and it is relatively easy to park and un-park the vehicle in this arrangement. Although parallel parking requires the least number of spaces, it is inconvenient for commuters.

3 Major types of parking patterns

Different types of parking patterns choice
Parking difficulties in a Parking Complex
In this section, questions were framed to assess the parking behavior of the residents while in a parking complex. They were asked to rate the following criterion based on their degree of coherence with the problem:
-
Poor visibility (bad lighting, blind corners, etc.)—The majority of the participants were neutral about the visibility issue. They didn’t find such an issue in a parking complex or didn’t notice it. However, there is also a segment agreeing that such problems exist (Fig. 9.25).
Fig. 9.25 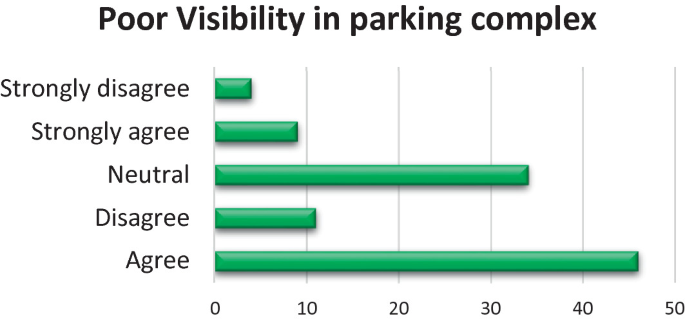
Visibility at parking complexes

Not enough walkways for Pedestrians—More than 50% of the respondents agreed that there are not enough walkways for pedestrians in the parking complexes. So, there are chances of accidents as there is not enough space for pedestrians and vehicles (Fig. 9.26).

Walkway for pedestrians
Drivers are not operating vehicles carefully—The respondents strongly agreed with this proposition. They feel that the drivers are not operating the vehicles carefully in the lanes in the parking complexes. While reversing and turning, there is a risk of collision. It also leads to wear and tear on the parked vehicles in the facility due to the collisions (Fig. 9.27).

Irresponsible driving of other drivers
Safety and Crowding in a Parking Complex
-
Difficulty in finding parking spaces—More than 70% of the respondents agreed that they face difficulty in finding parking spaces in the parking lot (Fig. 9.28).
Fig. 9.28 
Difficulty in finding parking space in the parking lot
-
Theft of personal property—The neutrality of the respondents reflects that they have reported no major cases of theft of personal belongings. So, theft of belongings is not a significant problem in the parking complexes (Fig. 9.29).
Fig. 9.29 
Theft of belongings from the parking lot
-
Vehicle damage from other vehicles—None of the participants strongly disagreed with this proposition. It means that their vehicle has been damaged by other vehicles. Moreover, the trend followed by the majority reflects that almost every respondent faced vehicle damage in the parking lots (Fig. 9.30).
Fig. 9.30 
Damage from the collision with other vehicles
-
Crowded (too many vehicles, people, etc.)—We can deduct from the graph that the parking facilities were crowded mostly as the trend of responses is toward ‘agree’ and ‘strongly agree’ (Fig. 9.31).
Fig. 9.31 
Crowding in the parking lot


Poorly Parked vehicles—There is a solid consensus among the respondents that the vehicles are parked poorly in the complexes. The commuters do not park their vehicles sequentially or properly (Fig. 9.32). Table 9.5 depicts the correlation between the various factors contributing to safety and crowding.

Poorly parked vehicles
Correlation between difficulty in finding parking space and theft of the vehicle
These two factors are positively correlated, but this value is near zero. There isn’t strong evidence for a significant association between the two.
Correlation between poorly parked vehicles and Difficulty in finding parking space
The score of 0.6139 suggests that these two factors are strongly positively correlated. That is the difficulty in finding a parking space results from poor and irregular parking behavior at the complexes.
Correlation between Crowd and Difficulty in finding parking space
Crowds and difficulty in finding parking spaces are also strongly positively correlated. It’s evident that more crowds will increase parking demand, and thus people will face difficulty finding a parking spot. A score of 0.6139 suggests the same.
Correlation between Crowd and Poorly parked vehicles
The crowd and poorly parked vehicles are strongly positively correlated. That is, poorly parked vehicles lead to crowding. Strong evidence (0.7514) shows the dependency between these two variables.
Correlation between Crowd and vehicle damage at the parking
Surprisingly, there was a slightly positive correlation between crowd and vehicle damage. The value of 0.4145 is relatively close to zero. So, there isn’t any substantial evidence to suggest a significant association.
Difficulties at access points of the parking lot
The survey suggests that there is difficulty at the access point. Some have strongly agreed to access difficulty. However, only a few strongly disagreed with access difficulty due to their own facility/fewer available vehicles (Fig. 9.33).

Difficulty at the access point
Difficulty turning into a lot from the street—Equal responses are received for neutrality and agreement. So, there is a conflict of opinion in this scenario (Fig. 9.34).

Difficulty turning into the lot from the street
-
Difficulty exiting the parking lot to the street—The majority of the respondents agreed that they encounter difficulty exiting the parking lot to a street (Fig. 9.35).
Fig. 9.35 
Count of difficulties at the access point

-
Pedestrians not watching for vehicles—Pedestrians are roaming carelessly and not watching for the vehicles running in and out of the complexes (Fig. 9.36). Table 9.6 represents a correlation between difficulty in entry and exiting the Parking lot.
Fig. 9.36 
Pedestrians not watching for vehicles
Table 9.6 Correlation between difficulty in entry and exiting the parking lot

The correlation matrix value of 0.5535 suggests a slightly positive correlation. This value is someway between 0 and 1. So, we cannot draw a clear conclusion about the association between the two variables.
9.4 Conclusions and Recommendation
There is high vehicle ownership in the city due to a lack of proper public transport infrastructure. Citizens are forced to use personal transportation due to the lack of public transportation. The parking facilities in the city are inadequate, resulting in illegal occupation of the streets in the city. To assess the public perception of the parking problem. A survey of more than 100 residents of the city was taken, and the following were the results:
-
1.
The current parking condition in the city: 95% of the respondent were not satisfied with the current parking situation on the road. The core parking problem is the unavailability of a suitable parking spot. Other problems include vehicle safety, lack of awareness among citizens, and a smaller number of dedicated parking complexes in the city. Commuters parking in front of shops and residents parking their vehicles on the road are the main reason for parking problems in the city. About 70% of the parking issues happened in the evening between 3 and 8 p.m.
-
2.
Parking as a Location Factor: About 90% of the respondents faced parking constraints in the market. Railway stations and buses stand for more than half of the responses. There were enough parking spaces at the resident’s and working places for most of the people. Free parking on the streets is prevalent in the city. Free parking on streets is easy for citizens, but finding space is hectic.
-
3.
Parking Pricing: More than 80% of respondents are certain they will pay for parking if they are promised a spot. So, we conclude that residents do not want free parking; they want efficient parking services and are ready to pay for it. Only about half of the respondents were aware of the parking charges in the city. There is a lack of awareness about parking charges. They are ready to pay up to Rs. 10 per hour for parking.
-
4.
Public preference for parking: People have a solid consensus to park their vehicles in parking lots instead of roadside parking. But there was a significant section which is keen on roadside parking. So, we tried to figure out the reason for the same. Less walking distance from the vehicle to the desired destination motivated them to follow the roadside parking. They willingly choose roadside parking for the sake of their comfort. The respondents were asked to rate their parking experience based on the security of vehicles, convenience, and cost of parking. The security of vehicles is the most critical factor people consider while parking. Angled parking was the most preferred parking mode by the people.
-
5.
Difficulties in parking complexes: Poor visibility, bad lighting, lack of walkways for the pedestrians, and irresponsible attitude of the driver, create the risk of collision while turning and reversing the vehicle. Usually, the parking complexes are too crowded, and the vehicles are poorly parked. Also, people encounter vehicle damage from other vehicles. Entry and exit points of the parking complexes were problematic for commuters.
Based on the study, the following recommendations can be drawn:
-
The current practice of free on-street parking needs to be changed. Charging higher on-street parking charges will make change in people’s behavior.
-
Increasing the existing parking supply in central business district (CBD) areas to meet the increasing demand.
-
Increasing the parking fees discourages people from using Private vehicles and shifting to public transport.
-
Multilevel parking is required to increase the supply to avoid the new land acquisition for the parking.
-
Policymakers should keep proper guidance and information system for parking prices in mind.
References
Litman, T.: Parking Management Strategies, Evaluation and Planning [Internet]. 2021 [cited 2022 May 12]. Available from: https://www.vtpi.org/park_man.pdf
Evaluation of Parking Characteristics: A case study of Delhi - ScienceDirect [Internet]. [cited 2022 May 12]. Available from: https://www.sciencedirect.com/science/article/pii/S235214652030661X
Pressl, R., Rye, T.: Park4SUMP - Parking management as game changer for urban mobility. [cited 2022 May 11]. Available from: https://park4sump.eu/sites/default/files/2020-02/PARK4SUMP_good%20reasons_and_principles_4_parking_management_0.pdf
Litman, T: How More Efficient Parking Pricing Can Help Solve Parking and Traffic Problems, Increase Revenue, and Achieve Other Planning Objectives. 2018 Apr 11; 35. Available from: https://cob.org/wp-content/uploads/todd-litman-parking-pricing-implementation-guidelines-2013.pdf
History of Vadodara - Baroda [Internet]. History of Vadodara - Baroda. [cited 2022 May 11]. Available from: https://historyofvadodara.in/
Vadodara City Population Census 2011–2022 | Gujarat [Internet]. [cited 2022 May 11]. Available from: https://www.census2011.co.in/census/city/338-vadodara.html#futurepop
Parking Policy for Vadodara City. 2019 Apr; 87. Available from: https://vmc.gov.in/pdf/VADODARA%20CITY_%20PARKING%20POLICY_(ENGLISH).pdf
Parking Management Strategies for Vadodara 2040 | CEPT - Portfolio [Internet]. [cited 2022 May 15]. https://portfolio.cept.ac.in/fp/strategic-plan-for-urban-transport-system-ut4000-spring-2019/parking-management-strategies-for-vadodara-2040-spring-2019-pg180145
Author information
Authors and Affiliations
Corresponding author
Editor information
Editors and Affiliations
Appendix (Survey Questionnaire)
Appendix (Survey Questionnaire)
Part 1:
-
Name
-
Age*
-
18–25
-
25–35
-
35–45
-
>45
-
-
Gender
-
Male
-
Female
-
I prefer not to say
-
-
Current Status
-
Employed
-
Student/Unemployed
-
-
Income level
-
Less than 2.5 Lakhs per annum
-
2.5–5 Lakhs per annum
-
5–10 Lakhs per annum
-
10 Lakh Per Annum +
-
-
Number of 2-wheelers you own
-
If you don’t own a 2-wheeler, please respond with N.A.
-
Number of 4-wheelers you own
-
If you don’t own a 4-wheeler, please respond with N.A.
Part 2:
-
Are you satisfied with the current parking situation on the roads?
-
Yes
-
No
-
-
What, according to you, is the core problem with parking?
-
Finding the place to park
-
Vehicle Safety
-
Parking fare
-
Other:
-
-
Do you believe that illegal parking on roads causes traffic congestion?
-
Yes
-
No
-
Maybe
-
-
What do you consider are the main reasons for the parking problems on the road?
-
Commuter parking
-
Commercial vehicles
-
Shopper parking
-
Some households have too many vehicles
-
Residents from neighboring roads parking
-
Other:
-
-
When do you consider the parking issues on your road mainly occurring?
-
Daytime (e.g., 8 a.m. to 12:00)
-
Noon (12:00 to 3 p.m.)
-
Evening (e.g., 3 to 8 p.m.)
-
Weekends.
-
24/7 (weekdays and weekends).
-
Part 3:
-
Do you agree that parking should be supplied free of charge to the residents? *
-
Strongly disagree
-
Disagree
-
Neutral
-
Agree
-
Strongly agree
-
-
Do you agree that parking should be supplied free of charge to the commuters? *
-
Strongly disagree
-
Disagree
-
Neutral
-
Agree
-
Strongly agree
-
-
Are you prepared to pay parking charges if you get assured parking space? *
-
Yes
-
No
-
Maybe
-
-
Are you aware of the parking charges in the city? *
-
Yes
-
No
-
Maybe
-
-
Should parking prices be calculated based on the exact parking time and not per hour or any other fixed period? *
-
Yes
-
No
-
Maybe
-
-
If parking charges are taken from you, will you use a private vehicle? *
-
Yes
-
No
-
Maybe
-
-
If yes, then up to what level will you pay the parking charge per hour? *
-
10
-
15
-
20
-
30
-
Part 4:
-
Which places are difficult for you to park in? *
-
Offices
-
Multiplexes/Malls
-
Railway/Bus Station
-
Airport
-
Markets
-
Temples
-
Other:
-
-
Are there enough parking spaces in your residence? *
-
Yes
-
No
-
-
Are there enough parking spaces in your working premises? *
-
Yes
-
No
-
-
Are you able to find a space to park without too much difficulty in Resident Permit Zone? *
-
Yes
-
No
-
Sometimes
-
-
Are you able to find a space to park without too much difficulty in Non-Resident Permit Zone? *
-
Yes
-
No
-
-
Are you able to find a space to park without too much difficulty in ‘Free on Streets’?*
-
Yes
-
No
-
Sometimes
-
Part 5:
-
Suppose you have to visit a marketplace, and parking space is available. Which parking type will you most prefer? *
-
Road Side Parking
-
Multistory Parking
-
Parking lot
-
-
If you chose Option 1 in the previous question, please specify the reason.
-
Less time is required to park
-
Safety and security of car not compromised
-
Less distance to walk from the vehicle to the desired destination
-
The better choice for a short stay
-
Easy to park and fewer chances of an accident
-
Other:
-
-
What is most important when choosing where to park from the list below? (Please number in priority, one is for the highest priority, and five is for the lowest. Use each priority number once only) *
-
Security
-
Convenience
-
Cost
-
-
Vehicle Security*
-
Highly secured
-
1
-
2
-
3
-
4
-
5
-
Least secured
-
-
Convenience*
-
Highly convenient
-
1
-
2
-
3
-
4
-
5
-
Least convenient
-
-
Cost*
-
High cost
-
1
-
2
-
3
-
4
-
5
-
No cost
-
-
Which type of parking is less time-consuming and easy to park or un-park? *
-
Perpendicular Parking
-
Parallel Parking
-
Angle Parking
-
Part 6:
-
For a better understanding, below are some factors affecting parking behavior. We would like to know whether or not these problems are faced by you while parking your vehicle*
-
Strongly disagree
-
Disagree
-
Neutral
-
Agree
-
Strongly agree
-
Poor visibility (bad lighting, blind corners, etc.)
-
Not enough walkways for pedestrians
-
Drivers not operating vehicles carefully
-
-
Layout and design*
-
Strongly disagree
-
Disagree
-
Neutral
-
Agree
-
Strongly Agree
-
The poorly designed parking structure
-
-
Safety and crowding*
-
Strongly Disagree
-
Disagree
-
Neutral
-
Agree
-
Strongly Agree
-
Difficult to find open parking spaces
-
Theft of personal property
-
Vehicle damage from other persons or vehicles
-
Crowded (too many vehicles, people, etc.)
-
Poorly parked vehicles
-
-
Difficulties at access points*
-
Strongly Disagree
-
Disagree
-
Neutral
-
Agree
-
Strongly Agree
-
Difficulty turning into the lot from the street
-
Difficulty exiting the parking lot to the street
-
Pedestrians not watching for vehicles
-
Rights and permissions
Copyright information
© 2023 The Author(s), under exclusive license to Springer Nature Singapore Pte Ltd.
About this chapter

Cite this chapter
Tiwari, A., Raj, H., Upadhyay, R.K. (2023). A Study of Public’s Perception of Parking Problems in Vadodara. In: Upadhyay, R.K., Sharma, S.K., Kumar, V., Valera, H. (eds) Transportation Systems Technology and Integrated Management. Energy, Environment, and Sustainability. Springer, Singapore. https://doi.org/10.1007/978-981-99-1517-0_9
Download citation
DOI: https://doi.org/10.1007/978-981-99-1517-0_9
Published:
Publisher Name: Springer, Singapore
Print ISBN: 978-981-99-1516-3
Online ISBN: 978-981-99-1517-0
eBook Packages: EngineeringEngineering (R0)