
Abstract
Growing energy demands and concerns about environmental consequences of energy generation by conventional methods led to greatest ever focus on renewable energy worldwide. Due to technological advances, solar and wind powers are almost reaching grid parity in recent years in various countries. However, the stochastic and unreliable nature of renewable energy sources poses problems with grid integration in case of large penetration. Hybrid energy system (HES) combines two or more energy sources and energy storage elements to stabilize the supply, thereby increases the reliability. As nuclear power is carbon free, concentrated and continuous source of energy, it is an attractive option to meet base load demand as a part of HES. Such systems are called nuclear renewable hybrid energy systems (NRHES). In this paper, a techno-economic model for simulation-based cost optimization of NRHES is presented along with a case study to demonstrate the optimization process.
Access provided by Autonomous University of Puebla. Download conference paper PDF
Keywords
1 Introduction
With ever increasing global environment concerns, pollution-free energy generation is the most sought after option for future energy demands of developing countries. Energy sources like nuclear, solar, wind, tidal, etc., are suitable options to cater this situation. Except nuclear, remaining sources of energy are intermittent and statistical in their availability and magnitude of power generation, whereas nuclear is a concentrated energy form having capability for continuous operation at proven capacity factor of more than 90%. A choice of diverse mix of these sources helps in increasing the reliability of the electricity generation with minimum to no pollution. Not only electricity but also other products like hydrogen, process heating, desalinated water, etc., can be generated from this system. This hybrid mix of energy sources, including nuclear, and products is called nuclear renewable hybrid energy system (NRHES).
As the renewable energy sources as well as the demands and market prices of the products are variable in nature, a typical installation of NRHES should consider the most effective combination of sources and products to (a) earn maximum profit for given market scenario and/or (b) incur minimum cost in achieving maximum reliability. This turns out to be a complicated optimization problem. In the current study, we aimed at developing a detailed simulation-based techno-economic model for NRHES. This model helps the utility owners to determine the optimum mix of nuclear, solar, and wind sources to achieve a target reliability value at minimum cost. This model can also be used to perform parametric studies for policy decision makers to assess and realize the capabilities of various energy sources for reliable electricity generation.
2 Techno-Economic Model
The NRHES under consideration consists of an AC bus and a DC bus. Various energy sources and loads are connected to these buses as shown in Fig. 1. There is a two-way power conversion (P.C.) system between AC and DC buses. The formulation of techno-economic model includes energy generation models, costing models, and energy management models. These models are described below.

Schematic of nuclear renewable hybrid energy system under study
2.1 Energy Generation Models
Nuclear reactor.
The power generated by nuclear power plant (time averaged) is given by
where PN (t) is power generated by nuclear reactor (W), PNr is rated power (MWe), LF is load factor which considers refueling outages and other anticipated/unanticipated shut downs of the plant.
Solar PV.
Power generated from a solar panel (W) is calculated by [1]
where Voc (t) is open-circuit voltage, Isc (t) is short-circuit current, and FF is fill factor. They are given by
where STC stands for standard test conditions, Voc,STC and Isc,STC are open-circuit voltage (V) and short-circuit current (A) of panel at STC, respectively, Kv and KI are voltage and current, temperature coefficients (%/°C), respectively, G(t) is solar radiation flux (W/m2), and Tc (t) is the PV cell temperature (°C) [1].
Wind Generator.
Power generated by wind generator (WG) is estimated as [2]
where vci, vr, and vco are cut-in, rated, and cut-off wind speeds (m/s), v(t) is local wind speed (m/s) at hub height, and PWGr is rated power (W) of wind turbine.
Battery.
The maximum charging/discharging current of a battery is determined from its C-rating as [2]
where EAh is capacity of battery (Ah). Energy losses during charging and discharging are accounted by efficiency as \(\eta_{\text{ch}}\) and \(\eta_{\text{dis}}\), respectively. Batteries cannot be discharged below certain fraction of its capacity SOCmin and cannot be charged beyond its full capacity. Here, SOC stands for state of charge given as ratio of instantaneous charge and its total capacity.
Power conversion system.
A two-way power converter is used for converting the DC power to AC power and vice versa across AC and DC buses. Energy losses that occur during conversion are lumped into conversion efficiencies, \(\eta_{{i,{\text{AD}}}}\) (AC to DC) and \(\eta_{{i,{\text{DA}}}}\) (DC to AC).
2.2 Assessment of NRHES
In current study, reliability parameters like loss of load probability (LoLP), annual unmet load (Pul,total), and annual dumped energy (Pde,total) are considered. These parameters are defined as follows
Loss of load probability (LoLP): Loss of load probability is defined [2] as the ratio of number of hours in which there is a shortfall of supply and total number of hours in a year (8760), mathematically
where PL(t) is load demand and Pav(t) is available power (defined later in this paper) at time t.
Total unmet load (Pul,total): It is the total load demand (Wh) that could not be supplied in a year.
Total dumped energy (Pde,total): It is the amount of energy (Wh) that is dumped (wasted) in a year due to excess generation. Strictly speaking, this is not a reliability parameter. But, it represents the effective utilization of energy.
2.3 Energy Management
Philosophy of efficient energy utilization is taken as basis for energy management in current study. The total available instantaneous power, Pav (t), is given as
where nj is number of units of jth energy source. The maximum power that can be supplied by a single battery at any point of time ‘t’ is given by
where \(\sigma\) is coefficient of self-discharge for battery (hr−1). The rules/procedures adopted for energy management are
-
1.
As the load is connected to AC bus, it is supplied preferentially from AC power sources like nuclear and wind.
-
2.
In case of excess generation,
-
(a)
If battery is not fully charged, battery charging is done from solar PV preferentially. The power for charging is the maximum of available charging power and allowable charging rate. The SOC of battery is updated at every time step. Self-discharge of the battery is also considered.
-
(b)
If battery is fully charged or available current is in excess of that required for battery charging, excess energy is dumped. The energy that is about to be dumped will not be passed through power conversion unit.
-
(a)
-
3.
If the generation is insufficient for serving the load and if battery SOC is greater than SOCmin, the batteries are discharged at a power which is maximum of required power and possible discharge rate. The SOC of battery is updated at every time step.
-
4.
If load cannot be supplied completely at any time step t, then unmet load (Pul,total) and loss of load probability (LoLP) are updated
-
5.
The rating of power conversion unit is decided based on operation of NRHES as
2.4 Cost Estimation Model
Levelized energy cost (LEC) is used to assess the economics of NRHES. It is defined as a constant price at which the utility owner should sell the electricity, to gain all the investment incurred in the project by end of its design life without profit/loss. Inflation rate, i, and discount rate, r, are also considered in total cost estimation. With this consideration, LEC is given as [3]
where CRF is capital recovery factor, for given life time T (years) of the project, given by
Total present value consists of capital costs (CC), operation and maintenance costs (OMC), refurbishment costs (RfC), fuel costs (FC), and decommissioning cost (DC). Salvage value of the discarded components is included in TPV. Mathematically,
Capital cost.
Capital cost is incurred in purchasing all the equipment and systems that are needed to set up an energy generation system. For nuclear reactor, the cost of first core and moderator/coolant inventory is also considered as capital cost.
where Pj,r denotes rated power per unit of jth component, SCCj denotes specific capital cost, i.e., capital cost per W or per Ah of jth component.
Operation and Maintenance cost.
OMC is generally given as % of capital cost and calculated as
Total present value of OMC is
For nuclear reactor, heavy water make-up cost can also be included in OMC if the plant uses heavy water as moderator and/or coolant.
Refurbishment cost.
Cost incurred in replacement of some faulty/performance-degraded components before end of life of NRHES is called refurbishment cost (RfC). As an example, in pressure tube-type nuclear reactors, a large portion of the pressure tubes needs to be replaced once in a given interval of time. Unlike O&M cost, RfC is incurred once in a given period of time.
where Nref,k is number of refurbishments of components of the generating system k in given life of project and TRf is refurbishment interval.
Fuel cost.
Solar and wind resources are freely available. For nuclear reactor, fuel cost includes the cost for fresh fuel loaded during refueling. This is estimated based on average discharge burn-up of fuel, BUavg (MWd/Te HM). Mass of heavy metal (like Uranium) required for given annual power generation is given by
where \(\eta_{N}\) is overall efficiency of plant, \(\Delta t\) is time period of analysis (=1 h). The mass of fabricated fuel containing mHM amount of heavy metal is determined as
where x is ratio of molecular weight of fuel material (e.g., UO2 in PHWRs) to molecular weight of heavy metal and y is ratio of mass of fabricated fuel to that of fuel material (to consider structural materials like clad, spacers, end plates, etc.). The annual fuel cost can be determined as
SCFN (Rs./Te fuel) is specific cost of fabricated nuclear fuel. So, FCN becomes
Decommissioning cost.
At the end of life of unit, the infrastructure built for energy generation is to be decommissioned and the waste thus generated should be properly treated. The cost incurred in this activity is a one-time cost at the end of life (EoL) of plant. The present value of this cost is estimated as
where DCk (%) gives decommissioning cost as % of capital cost.
Salvage value.
During refurbishment and at EoL of NRHES, the discarded components carry some economic value called as salvage value. The present values of revenue from salvage of replaced components (PSVrep) and of total generating system at EoL (PSVEoL) are given by
3 Optimization
The objective of optimization problem is minimization of levelized energy cost (LEC) of NRHES subject to following constraints
where ful,max and fde,max are maximum fraction of load demand that is unmet and dumped in a year, respectively. PL,annual is total annual load demand.
It can be observed that the optimization problem is a mixed integer nonlinear programming problem (MINLP) due to nonlinear constraints (Eq. 27) and integer decision variables. In graphical observation of LEC function, it is concluded that it has multiple local minima and hence non-convex in nature. A computational tool Hybrid Energy System Optimization (HESOPT) is developed using NOMAD [5], a derivative-free solver, to solve optimization problem. To avoid locking in local minima variable neighborhood search (VNS) feature of NOMAD is used. This tool also consists of in-house computer codes for energy flow simulation and costing. Energy flow simulation code simulates the energy flow between sources, load, and storage to evaluate the reliability of a given combination of sources and supplies nonlinear constraints to NOMAD. Costing code evaluates the LEC for given configuration of NRHES and acts as objective function for NOMAD. The workflow in HESOPT is shown in Fig. 2.

HESOPT solver structure, (x is decision variable vector, x0 is start point for MADS algorithm, x* is sampled point, x** is qualified point, LECmin is minimum LEC found, xoptimum is optimum combination found)
4 Case Study
An example case study is performed considering the meteorological data and load demand of Mumbai city, India. PHWR technology is chosen for nuclear power in NRHES and reliability parameters are fixed as: LoLPmax = 0.01, ful,max = 0.1 and fde,max = 0.1.
4.1 Inputs
-
Hourly basis solar insolation (for fixed axis, annual optimum orientation), ambient temperature, and wind velocity data are collected from PVGIS [6] for the year 2016.
-
The values taken for technical parameters involved in the models mentioned in Sect. 2.1 are summarized in Table 1. Technical parameters for nuclear, wind turbines, batteries, and power conversion systems are taken with typical values based on market survey and literature.
Table 1 Technical parameter inputs for various generating systems -
Economic parameters for the generating systems are identified based on regulatory and market scenario in India. All the parameters are summarized in Table 2. The inflation and discount rates are considered as 5% and 10%, respectively. Economic parameters for battery and P.C. are taken based on market survey.
Table 2 Economic parameter inputs for various generating systems -
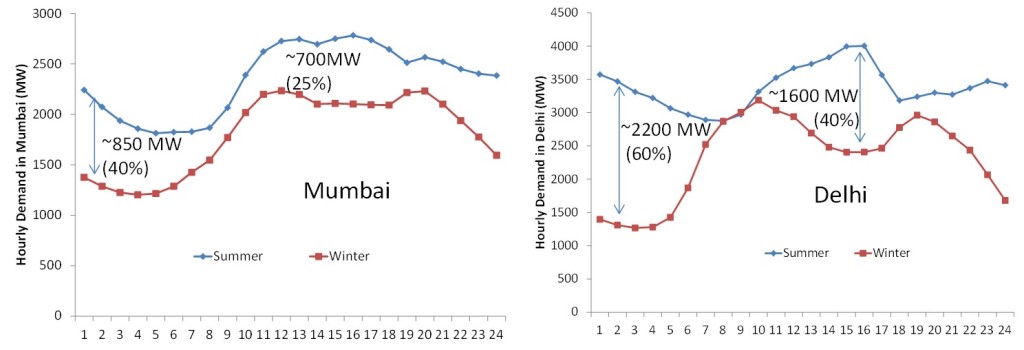
The electricity load demand for the city of Mumbai for a typical summer day is considered for analysis [8] and given in Fig. 3a. It can be observed that the average load and minimum load are 2345 MW and 1817 MW, respectively.
Fig. 3 
a Load profile used in case study. b The power generation, supply, and SOC of battery with optimum configuration of NRHES for a period of one year

4.2 Results and Discussion
The optimum configuration obtained by HESOPT for the current case with three nuclear reactors is summarized in Table 3. This result is confirmed from graphical solution of this optimization problem in iterative manner. While nuclear power serves significant part (1.89 GW) of the load demand, to serve the rest of load (<0.5 GW), an installation capacity of >3 GW is required for renewables due to their variable nature. The energy storage (>17 GWh) requirement is found to be very large. Observing the energy generation, supply and SOC of battery bank throughout the simulated year (Fig. 3b), it is found that renewable energy generation in monsoon reduces due to local meteorological conditions. This aspect dominates the selection of battery storage, leading to very large storage capacity requirement which remains underutilized through rest of the year.
5 Conclusions
A techno-economic model is developed for simulation-based optimization of NRHES. The resulting MINLP problem is solved using in-house developed tool, HESOPT, which employs open-source NOMAD solver and in-house developed energy flow simulator and costing tools to perform optimization. A case study is performed to showcase the set of inputs required and the methodology of optimization. The case study involves a typical NRHES consisting of nuclear, solar, and wind sources with battery backup and power convertor provisions. The LEC for the optimum configuration of this NRHES is determined. The capabilities of VNS algorithm of NOMAD and random initial guess generator, integrated and harnessed in HESOPT tool, led to reliable performance of HESOPT in capturing the global optimum for the non-convex MINLP problem studied in this work.
References
Eftichios, K., Dionissia, K., Antonis, P., Kostas, K.: Methodology for optimal sizing of stand-alone photovoltaic/wind-generator systems using genetic algorithms. Sol. Energy 80, 1072–1088 (2006)
Deshmukh, M.K., Deshmukh, S.S.: Modelling of hybrid renewable energy systems. Renew. Sustain. Energy Rev. 12, 235–249 (2008)
Mohamed, M.A., Eltamaly, A.M., Alolah, A.I.: PSO-based smart grid application for sizing and optimization of hybrid renewable energy systems. PLoS ONE 11(8), e0159702 (2016)
The proposed levelised generic tariff for various renewable energy technologies for 2016–17, Central Electricity Regulatory Commission, India. http://cercind.gov.in/2016/orders/sm_3.pdf. Last accessed 1 August 2019
Le Digabel, S.: Algorithm 909: NOMAD: nonlinear optimization with the MADS algorithm. ACM Trans. Math. Softw. 37(4), 1–15 (2011)
Photovoltaic Geographical Information System, PVGIS 5. http://re.jrc.ec.europa.eu/pvg-tools/en/tools.html [19.023399°N, 72.919568°E]. Last accessed 15 Mar 2019
Draft national electricity plan, Government of India, ministry of power, Central electricity authority, December 2016. http://www.cea.nic.in/reports/committee/nep/nep_dec.pdf. Last accessed 1 August 2019
AEEE. http://aeee.in/wp-content/uploads/2016/12/Delhi-Mumbai-Load-Profile-1024x350.jpg. Last accessed 1 August 2019
Adani Multi-crystalline solar PV modules. https://loopsolar.com/datasheet/adani-solar/datasheet-adani-solar-72-cell-300-330-Wp-India.pdf. Last accessed 1 August 2019
Author information
Authors and Affiliations
Corresponding author
Editor information
Editors and Affiliations
Rights and permissions
Copyright information
© 2021 Springer Nature Singapore Pte Ltd.
About this paper

Cite this paper
Nadella, S., Antony, A., Maheshwari, N.K. (2021). Simulation-Based Economic Optimization of Nuclear Renewable Hybrid Energy Systems with Reliability Constraints. In: Bose, M., Modi, A. (eds) Proceedings of the 7th International Conference on Advances in Energy Research. Springer Proceedings in Energy. Springer, Singapore. https://doi.org/10.1007/978-981-15-5955-6_55
Download citation
DOI: https://doi.org/10.1007/978-981-15-5955-6_55
Published:
Publisher Name: Springer, Singapore
Print ISBN: 978-981-15-5954-9
Online ISBN: 978-981-15-5955-6
eBook Packages: EnergyEnergy (R0)