
Abstract
From a population of 26,303 in 1890 to 102,078 in 1896, to a population of 4.4 million in 2011, Johannesburg located in the Gauteng province, is the largest city in South Africa and is one of the 50 largest urban areas in the world. This has occurred in different paces, times and places in terms of numbers, urban form and structure (density distribution, and compactness). As a megacity, Johannesburg becomes more complex for its planning, design and management compared to a small city. For instance, elements of its urban form and structure as well as elements of transport infrastructures and, recently, elements of Information and Communication Technologies (ICT) will largely determine its accessibility. This accessibility determines to a large extent, the interaction between economic and spatial design strategies. Henceforth, this chapter is divided into six sections. The first section presents the “Conceptual framework of the Smart Metropolitan Regional Development” of the study; The second section reflects on the “Gauteng City region and Johannesburg in Time and Space”; The third section focuses on the “Urban Accessibility and Mobility”; The fourth section looks at “Smart Energy for Economic Development”; The fifth section presents “Urbanization, Economic Growth and Metropolitan Regional Development”; and, The sixth section, based on the development of the previous sections, presents the “Spatial and Economic Design Strategies for a Smart Johannesburg Metropolitan Regional Development”.
Access provided by Autonomous University of Puebla. Download chapter PDF
Keywords
- Smart metropolitan region
- Economic & spatial design strategies
- Urbanization
- Urban system
- Urban form and structure
- Streets and other public spaces
- Human development
- Accessibility
- Sustainable
- Inclusive
- Resilience
- Prosperity
- Apartheid
1 Introduction
The development of large urban agglomerations such as Johannesburg Metropolitan Region as well as city regions such as Gauteng City Region (GRC) provides opportunities for economies of scale and agglomeration, but it will also call for large investments in infrastructures to respond to the increased demand for water, sanitation, solid management, energy, streets and public spaces, and mobility, etc. They will require efficient institutions for the management of social demand and equity on education and health as well as protection of people against violence and insecurity. Economies of scale and agglomeration economies are, for instance, greater in metropolitan areas where accessibility infrastructures are able to provide accessibility to services’ needs with higher access to markets and resources than those where accessibility is impeded by deficient accessibility infrastructures. Without efficient accessibility systems, a metropolitan region losses its economic power and remains just clusters of disconnected settlements. Therefore, efficient accessibility infrastructures will allow large-scale production of goods and services that can be distributed within the metropolitan regions and beyond with time, cost and reliability opportunities [1].
Established in 1886 following the discovery of gold on what had been a farm, the city of Johannesburg was a centre stage of the apartheid regime in South Africa that lasted from 1948 to 1990. Its foundation was historically guided by a segregationist ideology manifested through institutions and laws, urban planning and design, and access to basic services and amenities. During Apartheid, the majority of township areas designated for non-white people were situated between 25 and 30 km away from the central business district of Johannesburg, leading to multiple social and economic deprivations as well as transport challenges. Originally an acronym for “South-Western Townships”, Soweto, one of the townships, originated as a collection of settlements on the outskirts of Johannesburg, populated mostly by native African residents that were forcibly by government removed from their own land.
The dismantling of apartheid in the early 1990s came with calls for inclusive development in South Africa, mostly guided by Nelson Mandela’s ideal of a democratic and free society. The entire city of Johannesburg was then considered as a former apartheid city. Different policies, programmes and projects were adopted to make Johannesburg a more inclusive city. The key policies embraced participatory planning and design; development of inclusive public spaces; improvement in basic infrastructure provision and public transport particularly to the poor neighbourhoods and; development of policies that encourage inclusive human settlement and trade.
Today, Johannesburg is part of the Gauteng City Region (GCR) located in the Gauteng province which is the most densely populated province in South Africa. The GCR is an integrated cluster of cities, towns and urban nodes that together make up the economic heartland of South Africa [2]. It has urban landscapes that reflect the spaces, identities, relationships and encounters of historical divisions, while also embedding the significant and complex generations of difference that are produced by many overlapping economic histories and functions [3]. The GCR consists of the cities of Johannesburg and Ekurhuleni, the district municipalities of Sedibeng and West Rand, and the City of Tshwane (Pretoria) (Map 16.1). Although the area of Gauteng is the smallest of the nine provinces of South Africa with only 1.4% of the country’s surface area, it contributes 50% of South Africa’s economic output, 42% of SA’s industrial output, 34% of the country’s GDP and 10% of the Africa’s GDP. The size of the Gauteng economy is 1.07 Trillion Rands, based on mining, manufacturing, financial and business services, innovation or trade [4]. Johannesburg alone contributes 17% of the national GDP and approximately 47% of Gauteng’s economy [5].

Source Gauteng City Region Observatory. www.GCRO.ac.za
Gauteng City region.
The Gauteng City Region had 13.4 million people living within the radius of 100 km from the Johannesburg city centre in 2011. The population of the City of Johannesburg Metropolitan municipality was 4.4 million in 2011 [6]. According to the United Nations Population Division estimates, the Population of Johannesburg urban agglomeration was 8 million in 2015 and projected to surpass the 10 million mark in 2030 [7].
For this study, the unit of analysis will be always indicated to ease interpretation and trends analysis. However, for a meaningful analysis that can be linked to policies, the Johannesburg Metropolitan Municipality under the authority of a mayor as well as the Gauteng City Region head by a Premier are centred on and linked to Johannesburg and the other cluster of cities. For the study of the Johannesburg greater metropolitan region, it is more pragmatic to make it through the Gauteng City region for the following reasons: (1) Johannesburg is geographically and economically linked to all other cities or municipal districts of the city region; (2) the city region has an autonomous administration under the leadership of the Gauteng Premier that defines coordinated policies, programmes and projects including all municipalities of the city region; and (3) the Johannesburg Growth Development Strategy goes beyond the Metropolitan Region to embrace the entire Gauteng province as it is indicated in its the Gauteng Development Strategy outcome 4 stating, “A high performing metropolitan government that pro-actively contributes to and builds a sustainable, socially inclusive, locally integrated and globally competitive Gauteng City Region” [8]. Urban Policies and Programmes for the Greater Johannesburg Metropolitan are indeed, developed at the provincial level and trickle down to the city level.
The Johannesburg case study also consists of analysing the economic and spatial strategies undertaken by the City of Johannesburg authorities and the Gauteng City Region authorities in order to turn the city and the region into smart development in the context of the historical transformation of the metropolitan region in time and space. This is explored under six sections.
The first section “Conceptual framework of the Smart Metropolitan Regional Development” is based on its City Foundation (urban planning, basic infrastructures and land tenure) and Institutions as well as on the Economic Development, Infrastructure Development, Environmental Sustainability, Social Development, Social Inclusion, Disaster Risk Exposure and Resilience, and Peace and Security. One element of the City Foundation, is the spatial design and the element of Economic Development which plays the role of interface vis-à-vis the other elements of the conceptual framework. Economic and Spatial Design Strategies alone cannot make a regional metropolitan region smart, the way they interplay with the other dimensions are crucial.
The second section presents “Gauteng City region and Johannesburg in Time and Space”.
The third section focuses on the Urban Accessibility and Mobility in the City of Johannesburg: Streets as drivers of urban accessibility; Transport modes and infrastructures, and traditional focus of urban mobility studies. Though streets constitute a fundamental issue of the City Foundation as determinant of the urban form and structure, the analysis gives preference to the prominent role they play in urban accessibility along with transport modes and infrastructures.
The fourth section presents “Smart Energy for Economic Development”.
The fifth section presents “Urbanization, Economic Growth and Metropolitan Regional Development” including economic growth, human development, city prosperity and smart metropolitan regional development. Lastly,
The sixth section, based on the development of the previous sections, presents the “Spatial and Economic Design Strategies for a Smart Johannesburg Metropolitan Regional Development” as implemented through the urban policies and programmes of the city of Johannesburg and the Gauteng City Region.
2 Conceptual Framework, Methodology and Data
2.1 Smart Metropolitan Regional Development: Concepts and Components
In our study, a smart metropolitan regional development is viewed as a sustainable, inclusive and prosperous metropolitan regional development that promotes a people-centric approach based on three core components: Smart Metropolitan Region Foundation, Information and Communications Technology (ICT) and Smart Institutions and Laws. Here, the Metropolitan Region Foundation goes beyond the city foundation and includes elements of mobility across urban centres that form the metropolitan region. First each urban centre must have a smart city foundation and be smartly connected to the other urban centres. Smart Metropolitan regional foundation, institutions and laws, and ICT are the pillars of the seven other dimensions of a smart metropolitan region: Infrastructure Development, Environmental Sustainability, Social Development, Social Inclusion, Disasters Exposure, Resilience, and Peace and Security. Infrastructure Development complements the basic infrastructure services under each smart metropolitan foundation and extends to actual investment and advancement of services such as transport, ICT, industrial energy, education, health, etc. Environment Sustainability is comprised of elements of climate change, biodiversity, waste management, energy, transport, building and pollution. Social Inclusion includes aspects of participation in decision-makings as well as equal opportunities for growth and prosperity. Social Development encompasses elements of education, health, public space, social inclusion and social capital. Disaster Exposure incorporates elements of mitigation and adaptation to various disasters such as flooding, droughts, storms and earthquakes. City Resilience is composed of elements of city foundation, environment, social capital, and social development. Peace & security includes the elimination of all forms of discrimination violence and conflicts, such as: domestic violence, violence in public places, crime, armed conflicts, terrorism, etc. An insecure metropolitan region limits opportunities for investment and economic growth and cannot be a smart metropolitan region (Fig. 16.1).

Source adapted from Mboup, G. et al., 2016. Smart City Foundation—Drivers of Smart Cities. In Vinod et al., 2016. Smart Economy in Smart Cities, Springer
Smart Johannesburg Metropolitan Regional Development conceptual framework.
The opportunities for ICT to support the overall urban challenges and opportunities are enormous, and the Johannesburg Metropolitan Region as well as the Gauteng City Region must integrate and use ICT solutions to facilitate the greater provisioning of urban services. Following the exigency of the city of the 21st century that calls for sustainability, inclusion, resilience and prosperity, the planning and management of human settlements must take into consideration the gain in knowledge on various conditions that make cities smart, green, ecological, liveable and healthy. Through increased efficiency and innovation, ICT increases economies of scale and agglomeration, and promote diffusion of knowledge, even at the smaller human settlements. Small settlements and small firms are benefiting from ICT in making available their goods and services beyond their territories. Virtual offices, virtual networks, teleconferences are increasing large public participation and inclusion. Digital firms can start and scale up quickly with relatively little staffing or capital investment. ICTs harness the benefits of agglomeration economies in easing circulation of goods and services and encouraging polycentric urban development and allowing synergies between centres and sub-centres. They intensify urban nodes and corridors to maximize the benefits of concentration.
Numerous societal problems are explored and addressed in urban and regional planning agencies, including urban growth, unemployment and economic revitalization, transportation, environmental degradation and protection, neighbourhood decay and redevelopment, conservation of land and natural resources, provision of open space, parks and recreational facilities, etc. New urban planning instruments are becoming available with the worldwide spread of ICTs. They make it possible to adopt innovative e-planning approaches, strengthen communication between urban stakeholders, and make communication available at various stages of the planning process. Local governments can engage their citizens with real-time information to gain support for policy initiatives, identify unforeseen concerns, and recognize potential conflicts [9].
Cities are dynamic living organisms that are constantly evolving. ICT has begun to turn some places into real-time cities. This rapidly changing society makes the assessment and anticipation of future needs of city dwellers in terms of services, including transport, water, energy, employment, education and health, even more problematic. In addressing the complex problems of city planning, it is not sufficient just to be concerned with the physical structure of the city; the interplay of intangible economic, social and environmental factors needs to be considered as well [10]. Planning procedures make use of models that show historic and present situations and communicate planned situations [11]. The introduction of ICTs allows planners and planning departments to carry out new actions or to implement conventional practices through new tools, such as GIS, virtual reality technologies, e-participation devices, including public participation GIS applications, among other tools, with the aim of improving conventional decision-making processes. The provision of better planning and urban management services, more efficient, with lower costs and, at the same time, a more collaborative and participative, transparent and accountable planning decision-making process are some of the basic objectives usually associated with the move from conventional urban planning to e-planning [12, 13].
ICT plays an important role in the transport sector. It can increase economic productivity and competitiveness through increased smart mobility that reduces traffic congestion and commuting costs. Efficient and fast transport in turn, can increase labour productivity by reducing commuting times, and increasing worker productivity. ICT reduces the use of motorized means and transport and promotes walking and cycling. This will improve the overall health of city residents, thereby reducing economic costs of workers who are absent due to illness. Another important benefit is on consumer expenditure, as less is spent on cars and fuel. Non-motorized means of mobility support specific industries, such as bicycle shops, tourism, retail activity, construction and real estate development that highlight liveability. It can also lead to a drop in the share of the household budget devoted to motorized means of transport, such as cars which are expensive particularly in African countries.
The digital dividends are real and the Johannesburg metropolitan region as well as the Gauteng City Region must take the opportunity to efficiently integrate the use of ICT in all sectors of its development. From the beginning of the 21st century, a digital citizenship particularly the “Millennial” generation has started to emerge in Johannesburg as in many African cities. The rapid adoption of digital technologies in the economy will have huge benefits directly as well as indirectly. However, ICT alone will produce little in the smart metropolitan regional development. ‘Smart’ is not an end in itself; It is the way ICT is integrated in the city development that will determine the city smartness. Maximizing the digital dividends requires better integration of ICTs with the other factors of smart cities such as: city foundation, infrastructure development, environment sustainability, social development, disaster prevention, resilience, peace and security. ICT can be seen as substitution and catalyst factors, but the other factors (or the analogue part) of the operation are crucial in making a smart economy. Those factors include the city foundation, institutions and laws, infrastructure development, social development, social inclusion, environmental sustainability, disasters prevention and resilience (particularly in the context of climate change), peace and security. Most tasks have an aspect that cannot be automated by technologies and that requires human judgment, intuition, and discretion. This is where lies the crucial role of human capital associated with institutions and laws, efficient governance, management and administration. Without improvement on accountability at all levels, ICT alone cannot change the outcome of the economic productivity equation. African countries that are able to swiftly adjust to this evolving digital economy will reap greatest digital dividends, while the rest are likely to fall behind. This is the context where we are introducing economic and spatial design strategies for a smart metropolitan regional development to unlock the potential of Johannesburg metropolitan region as well as the Gauteng City Region to be smart, sustainable, inclusive, resilient and prosperous.
2.2 Methodology and Data
Putting the Dimensions together to Develop the Smart Metropolitan Regional Development Index (SMRDI)
The SMRDI which is built here is meant to serve research as well as policies. For the latter, the SMRDI will be built using existing mechanisms of the production of indicators globally as well as nationally. Building the SMRDI through existing mechanism of development of indicators such as the monitoring of the Africa Agenda 2063, the Sustainable Development Goals (SDGs), the New Urban Agenda, the Sendai Framework, the COP21, the Addis Ababa Declaration on Population and Development as well as the monitoring of national programmes and plans will ease its implementation at the local level for SMRDI policies. As part of the international communities, South Africa has also endorsed all the above global agendas. Box 16.1 provides for each dimension of the SMDR variables, quantitative or qualitative, included for its measurement.
Metropolitan Regional Development Index
Box 16.1 Smart Metropolitan Regional Development Index (SMRDI)
Dimensions | Definitions/variables |
|---|---|
City foundation | Spatial Planning Planned settlements, Streets, Other Open Public Spaces Land Tenure Land: Documentation of perceived eviction Housing: Proportion of urban population living in slums, informal settlements or inadequate housing Basic Infrastructures Connection to piped water, Connection to sewerage system, Connection to electricity, management of solid waste |
Institutions & Laws | Urban Planning Codes, Urban Policies, Urban Plans, Unplanned settlements, Resilient building codes, standards, development permits, land use by-laws and ordinances, and planning regulations |
ICT | Connection to internet, Mobile phone, Computer, Broadband |
Infrastructure development | Transport and road infrastructure, Energy, Knowledge infrastructure, Health infrastructure |
Environmental sustainability | Air quality (PM10), CO2 emissions, energy and indoor pollution Climate Change, Biodiversity, Land degradation |
Economic development | City product, Employment Primary, Secondary and Tertiary sectors |
Social development | Education: literacy, primary, secondary and tertiary enrolment Health: life expectancy, under-five mortality rates, HIV/AIDS, morbidity and nutrition: Social capital, Public space |
Social inclusion | Income/consumption Inequalities: Gini coefficient, Health, Education, Access to basic services |
Disaster Risk Reduction/Resilience Strengthen resilience and adaptive capacity to climate-related hazards and natural disasters in all countries | Number of deaths, missing persons and directly affected persons attributed to disasters per 100,000 population Adoption and Implementation of national disaster risk reduction strategies in line with the Sendai Framework for Disaster Risk Reduction 2015–2030 Proportion of local governments that adopt and implement local disaster risk reduction strategies in line with national disaster risk reduction strategies |
Peace and Security | Proportion of population that feel safe walking alone around the area they live; Proportion of women and girls aged 15 years and older subjected to sexual violence by persons other than an intimate partner in the previous 12 months, by age and place of occurrence; Proportion of ever-partnered women and girls aged 15 years and older subjected to physical, sexual or psychological violence by a current or former intimate partner in the previous 12 months, by form of violence and by age; Average share of the built-up area of cities that is open space for public use for all, by sex, age and persons with disabilities; Proportion of population that feel safe walking alone around the area they live |
3 Gauteng City Region and Johannesburg in Time and Space
3.1 Gauteng City Region and Johannesburg Post Apartheid
The apartheid government reinforced the spatial segregation of South Africa by establishing laws including Group Area Act, Prohibition of Mixed Marriages, Native Settlement Act and Native Act, which controlled people’ movement and place of settlement per race. The city foundation of Johannesburg has historically been guided by a segregationist ideology manifested through institutions and laws, urban planning and design, and access to basic services and amenities. During the Apartheid, the majority of township areas designated for non-white people were situated between 25 and 30 km away from the central business district, leading to significant transport challenges. Originally an acronym for “South-Western Townships”, Soweto, one of the townships, originated as a collection of settlements on the outskirts of Johannesburg, populated mostly by native African workers from the gold mining industry.
The long march to freedom and social inclusion—Transforming Johannesburg to an inclusive, vibrant, sustainable and smart metropolitan region within the Gauteng City Region
With an apartheid city foundation characterized by apartheid institutions and laws, apartheid urban planning and design, and apartheid access to basic infrastructure and services, the excluded people of Johannesburg as most parts of South Africa, had to fight for their social freedom. Both peaceful and violent protests were held in the city between 1950s and 1990 when apartheid was officially abolished, each with varied outcomes. Protests held during the 1950s to push for social inclusion in aspects such as voting were generally unsuccessful both as a result of non-unified campaigns and also as a result of draconian laws aimed at suppressing any opposition to the government. Large scale anti-pass demonstrations held in the 1960s were countered with suppressive measures such as declaration of a state of emergency, banning of social movements, imprisonment and exiling of leaders, and empowerment of the police, which made it impossible to legally protest against the system. With mounting economic hardships, international pressure, and increased local protests throughout the 1980s, the government secretly began negotiations with Nelson Mandela, who had been jailed since 1964 leading tothe release of Nelson Mandela in 1990 and the subsequent repealing of segregationist laws. The first multi-racial democratic elections in 1994 won by the African National Congress and the enactment of South Africa’s new constitution, which enfranchised blacks and other racial groups, marked the official end of the apartheid system [14]. Major strides have been made especially in the areas of policy and opening up of the physical space to promote social integration in the living and public settings of South Africa, particularly in the Gauteng Province and Johannesburg.
Some of the major policies developed are revitalizing South African cities through inclusive urban planning, inclusive provision of basic services, inclusive access to land.
From an Apartheid City to an Sustainable, Inclusive, Resilient and Prosperous Johannesburg City
Urban development was marked by City Improvement Districts (CIDs) and Urban Development Zones (UDZ) as well as through the creation of themed spaces that influenced the revitalisation of inner city Johannesburg. The establishment of the Urban Development Zone Tax Incentive brought leveraging influence to inner city redevelopment and attracted investment to the inner city. The Johannesburg Development Agency (JDA) facilitated the revitalising of Constitution Hill, Newtown, and Faraday Station, upgraded Main Street to make it more pedestrian-friendly, reconstructed and renovated the Drill Hall, and developed the Fashion District. At the launch of the inner city Urban Renewal Strategy in 1997, the city was positioned as the “Golden Heartbeat of Africa” [15]. Johannesburg inner also features an array of cultural venues and a wide range of creative and cultural industries as the cultural capital of the country. However the inner city also features a tale of the northern suburbs such as, Rosebank, Sandton and Midrand which have significant residential investments along with restaurant and shop-lined avenues. In contrast, the inner city environments are resulting from influx of migrants from the Gauteng province and other provinces as well as other African countries and creates a huge informal sector. Though there is increase in the number of formal dwellings in the city of Johannesburg by over 220,000 units, estimates from the World Bank indicate that, during the period 1996–2001, the informal shacks increased by 42% to reach a quarter million [16].
In 2001, the Gauteng Provincial Government (GPG) officially launched the Blue IQ initiative and embarked on an energetic drive to get an initial group of eleven mega projects off the ground. These included the development of City Deep Transport Logistics Hub, Constitution Hill, Cradle of Humankind, Dinokeng, the Gautrain, Johannesburg International Airport, the Innovation Hub, Newtown Regeneration, Wadeville–Alrode Industrial Corridor, Kliptown Regeneration, and Gauteng Automotive Quarter. Blue IQ sought to “develop world-class infrastructure, implement marketing and investment strategies, reduce bureaucratic red tape for investors and suppliers, and encourage skills training and resource building in the areas of technology.” The Expanded Public Works Programme (EPWP), launched in May 2004, was central to creating employment opportunities for the poor. Nationally, the number of employed people grew from 2.7 million in 1995 to 4.9 million people in 2014. There was also a sharp rise in the ratio of household to disposable income, from approximately 54% in 2004 to almost 80% in 2007 [17]. However, a large portion of household spending was financed by credit.
The Post-apartheid was also Marked by the Suburbanization of Johannesburg
The suburbanization of Johannesburg has been recorded at several levels, notably with businesses as well as government housing programme located at the outskirts of the city. Decentralised nodes in well-established suburban areas such as Sandton, Randburg and Midrand expanded to create what can be called ‘edge cities’ grew up along the post-apartheid towards polycentric cities [18]. The suburbanization was also politically motivated with the RDP housing programmes at the outskirts of cities where land is relatively affordable [19]. The RDP housing programmes might have various social and economic advantages including access to the financial and economic market as illustrated in de Soto publication (2000). De Soto argued that granting titles to the poor would liberate the plots they occupy and transform them into capital. This in turn, could be used as collateral for loans to jumpstart their businesses, or improve their houses, among other gains that increase their quality of life. At the community level, regularization of land tenure will help the municipality to legally collect various taxes that can be used to improve basic infrastructures such as connection to water, sewerage facilities, energy sources and waste management facilities. This would also allow people to fully participate in the development of their communities at the policy as well as the implementation level instead of seeing proprieties as dead investments serving only for shelter [20].
However, there is an argument that supports that having title deeds at the outskirts of cities also created some form of exclusion from jobs and amenities [21]. The RDP model delivered housing to communities far from commercial centres where work opportunities could not be found, and sometimes also far away from the existing major townships, so these locations produced inflexible and unsustainable environments, rather than vibrant places where people can access the opportunities and amenities they require to thrive. These spatial patterns have perpetuated, or at worst, increased, the large distances for most people between work and home. The costs of mobility for the low-income people are extremely high and transport constitutes a major component of the budget for them—and the levels of congestion associated with public transport are growing, as are its consequent damaging environmental impacts. Suburbanization, either through middle class and wealthy investors’ decision to locate at the outskirts of cities or through the RDP housing programmes has contributed considerably to urban sprawl in the region, which has seen its morphological footprint extent southwards to areas like Evaton, Sebokeng, and Sharpeville; northwards to Ga-Rankuwa and Hammanskraal, for example; and eastwards to areas such as Benoni, Daveyton, and Springs [22].
Upgrading the Townships
Therefore, the post-apartheid was marked by inclusion policies contributing towards exclusion particularly those geographically located in townships such as Soweto. Some projects targeted townships that had been particularly affected by violence, such as Kathorus [26]. However, these projects were featured as socio-political interventions rather than urban development projects supported by official urban plans [22]. Due to lack of job opportunities in townships, most of the township residents were forced to seek employment in other areas such as Johannesburg CBD. The townships in the south and pockets in the northern parts of the province, are still marginal spaces, economically. They have large populations and little or no industrial activities, and some are isolated and burdened with informal settlements. Some continue to grow and expand the township footprint away from the core areas of the city. Distortions of the urban footprint have been exacerbated by poor state-led housing projects and weak strategic spatial planning of the public sector that has allowed the private development of space in unsustainable forms on the urban periphery. A fragmented public transport system and the shift of jobs away from mining and industry to tertiary activities have also been significant. Therefore, the urban built-up area has increased in the region, but as an unsustainable, inequitable and inefficient spatial development trend [19].
Box 16.2 is an illustration of the Urban Landscape of the Gauteng City Region by Sihlongonyane, 2018.
Box 16.2 The Urban Landscapes of the Gauteng City Region
The urban landscapes can be loosely divided into nine historical formations:
Old small towns landscape grew from the availability of agricultural land or the discovery of mineral resources to accommodate white settlers in the 1800. These landscapes have both colonial and apartheid beginnings and tend to have an old industrial plant and/or railway lines. They contributed significantly to the proliferation of dysfunctional settlements, dysfunctional space economies and, to the terrible trio of poverty, inequality and unemployment. They have declined since the slump in mineral prices and with the shift towards post-industrial production.
Metropolitan landscapes are large cities such as Johannesburg and Pretoria with large populations and social and economic relations with satellite towns of the region. These landscapes developed from old small town landscapes, of which they still have the vestiges, through trade and diversification. They contribute the highest earnings to the GDP of the province, but are characterised by remarkable economic, income, and social inequalities, and spatial fragmentation. They are responsible for unprecedented urban sprawl, new slums, and unbalanced development.
Suburban landscapes are part of metropolitan landscapes. They are places of privilege providing comfortable neighbourhoods for the middle and upper classes. They are produced largely through decentralisation urban growth away from the inner city. These are characterised by the post-industrial urban dynamics of office parks, residential estates (gated communities) and shopping complexes, which propagates fragmentation.
Gated community landscapes, developed over the last 15–20 years, are walled, residential communities or housing estates with strictly controlled access to “prevent penetration by non-residents” [23], and public spaces that are privatized.
Black township landscapes are areas created originally by the apartheid regime for ‘non-white’ residents—blacks (Africans), Indians and ‘Coloureds’, on the periphery of towns and cities, usually 20–30 km away from the CBD. These areas often have limited formal economic development apart from retail, and conflicting interests about peripheral land-use. Services such as electricity, water and heating are inadequate or unreliable.
Informal settlement landscapes are urban or peri-urban locations where houses and ‘shacks’ have been constructed on land that the occupants occupy illegally, without official approval. Many informal settlements are located on the outskirts of the city adjacent to black townships.
RDP (Reconstruction and Development Programme) landscapes were established through the massive government housing capital subsidy scheme. They are sprawls of formal low-cost mass housing, largely at the edge of the cities where land is cheaper, far from job opportunities. Despite the government’s good intentions, they perpetuate the apartheid urban form [24].
Peri-urban Landscapes are located on the periphery of the major cities. They contain a variety of restaurants, retail shops, conference facilities, a spa, and hotels. These are strategically located to provide touristic leisure and entertainment. They are thriving economically. While not intense, they provide a lot of jobs to the lowly skilled. They include: Shell Ultra cities, cultural villages, botanical gardens, nature reserves, airports, and waterfronts. They often carry a mix of these activities. Such areas include: Muldersdrift, Walter Sisulu National Botanical Garden, Lanseria International Airport, Hartbeespoort Dam, Nature Reserves, Maropeng, and Lesedi Cultural Village.
One of the primary trends in the growth of tourism is the proliferation of African cultural villages within the Gauteng region. African cultural villages landscapes are defined as complexes that are purposely built with the help of ‘cultural workers,’ to aspects of cultural life for a group as it was at a specific period (or over several periods) of time [25]. The ‘cultural workers’ are employed to perform and demonstrate a purportedly ‘traditional’ way of life for visitors. These landscapes are therefore purposely-constructed tourist attractions by people recruited (sometimes as families) from the relevant ‘ethno’-linguistic groups to live and work in the villages. They are tourist villages which celebrate the cultural traditions of several different people of Southern Africa.
Source Mfaniseni F. Sihlongonyane, 2018. Chapter 2—The Economic Drivers of Urban Change in the Gauteng City-Region: Past, Present and Future. In K. Cheruiyot (ed.), The Changing Space Economy of City-Regions, Springer AG 2018
Current Urban Policies and Programmes at the Gauteng Provincial Level
Under the cluster of cities of the Gauteng city region, the city of Johannesburg is the Financial Hub; the Ekurhuleni Metro is the Manufacturing Hub; the West Rand District is the agribusiness/agro-processing and green and blue economy; Sedibeng District Municipality with the New economy to be anchored on steel; the Vaal river, tourism, agriculture linked to Sasolburg; and, the City of Tshwane being the Administrative Capital has become a key driver of knowledge, innovation and automotive industry development. The GCR has features of a polycentric city-region (one that has multiple centres), and is anchored by its three large metros: Johannesburg; Tshwane; and Ekurhuleni. Johannesburg’s development is an integral part of the region in which it finds itself [8]. The Gauteng province has also developed a GCR Integ-rated Infrastructure Master Plan (GCR IIMP 2030) that promotes sustainability through the efficient use of resources and the adoption of transformative technologies [27]. It has also put in place a National Development Plan Vision 2030 to set goals for infrastructure development to enable socio-economic transformation. The ambitious GCR’s programme of Transformation, Modernisation and Reindustrialisation aims to: develop economic potential in individual corridors; ensure growth and opportunities are equitably distributed across the GCR; deliver housing and economic opportunities where most needed to realise radical spatial and economic transformation; ensure infrastructure efficiency through coordinated planning, prioritisation and timing of delivery; and unlock human capital in a dynamic, innovative, competitive and connected city region (Fig. 16.2).

Source Gauteng Province Government, 30 January 2015, Transformation, Modernisation and Reindustrialisation of the Gauteng City Region: 2015–2030
Gauteng City Region—Cluster of Cities.
Current Urban Policies and Programmes at the Johannesburg Level
Recognizing the unbalanced Johannesburg metropolitan regional development, in one hand, and the multiple problems associated to lack of basic services, the Johannesburg authorities have taken bold actions to decongest the Johannesburg urban agglomeration. This new spatial re-organization is accompanied with economic transformation through the ambitious economic development. This is under the vision:
Johannesburg – a World Class African City of the Future – a vibrant, equitable African city, strengthened through its diversity; a city that provides real quality of life; a city that provides sustainability for all its citizens; a resilient and adaptive society. (Mayor of Johannesburg, 2017)
Today according to the Integrated Development Plan, Johannesburg has been divided in seven regions (A, B, C, D, E, E, G) as shown in Fig. 16.3.

Source City of Johannesburg, 2017–18 Draft Integrated Development Plan Review
Regions of Johannesburg.
The Johannesburg 2040 Growth Development Strategy (GDS) is an aspirational strategy that defines the type of society the city aspires to achieve by 2040. The City of Johannesburg developed its first Growth and Development Strategy (GDS) in 2006, as a long-term strategy—an articulation of Johannesburg’s future development path. At that time, there were numerous sectoral strategies, including amongst others: ‘Joburg 2030’, the Human Development Strategy (HDS), the Integrated Transport Plan and the City Safety Strategy. Each addressed a different angle of the city’s development. Johannesburg has also embarked in a holistic approach of Smart City Programme.
3.2 The Urban Numbers of the Johannesburg and the Gauteng City Region Post Apartheid
The Gauteng City-Region
The population of Gauteng grew from 7.6 million people in 1996 to 9.2 million in 2001, and is currently estimated at 12.2 million people (GPG 2014). The population of the region is projected to reach 15.2 million in 2021 and 21.3 million in 2041. This significant increase can be attributed primarily to labour migration. Today, the region is a global city-region as an important node in the global economic system, where the linkages that bind the city have a direct and tangible effect on global affairs through socio-economic means [28]. However, the population of the GCR is not evenly distributed across cities, municipalities and districts. It is, indeed, concentrated in three cities that represent 85% of the province total population: Johannesburg (37%), Ekurhuleni (26%) and Tshwane (22%). Johannesburg remained the most urbanised municipality with 56% built-up area in 2009, followed by Ekurhuleni and Tshwane with built-up areas of 44% and 35%, respectively. Overall, the region experienced urban growth, especially in the main metropolitan centres while there is population decline among old small towns and industrial sites of larger cities, associated to decline in job opportunities. Job opportunities develop notably post-industrial centres such as shopping complexes, office parks, and science parks, etc. [22].
When the urban agglomeration is the measurement unit, statistics from the UNDESA’s Urbanization Prospects 2014 Revision shows that the population of the Johannesburg urban agglomeration was nearly 10 million in 2015 (9.4 million). These statistics put Johannesburg among the four African megacities along with Cairo, Lagos and Kinshasa (Fig. 16.4).

Source Data From United Nations (2015) World Urbanization Prospects: The 2014 Revision, UNDESA, Population Division, New York, NY, http://esa.un.org/unpd/wup/index.htm
Johannesburg Urban Agglomeration, 1950–2015.
The population growth of the Johannesburg urban agglomeration was stable until 1970 with an annual growth rate averaging 2.5%. From 1970 to 1985, it declined to reach 1.5%, and the level was maintained until 1990, a year marking the end of Apartheid. From 1990 to 2000, it increased above 4% before decreasing to reach a level, which has remained high, above 3% in 2015 (Fig. 16.5).

Source Data from United Nations (2015) World Urbanization Prospects: The 2014 Revision, UNDESA, Population Division, New York, NY, http://esa.un.org/unpd/wup/index.htm
Johannesburg Urban Agglomeration Population Growth rates (1950–2015).
The same statistics show that at the national level, Johannesburg and Tshwane (Pretoria) are among the four most populated urban agglomerations in South Africa with Johannesburg leading the group with 27.1% of share on the country’s total urban population, followed by Cape Town (11%), Durban (8.4%) and Tshwane (6%) (Fig. 16.6).

Source Data from United Nations (2015) World Urbanization Prospects: The 2014 Revision, UNDESA, Population Division, New York, NY, http://esa.un.org/unpd/wup/index.htm
Percentage of urban population residing in each urban agglomeration (1950–2015).
According to 2016 Community Survey, about 37% of Gauteng’s population is aged less than 25 years. The age pyramid with high proportion of young people age 20–29 years old shows clearly that migrant population for both sex from other provinces contribute substantially to the rapid growth of the Gauteng (Fig. 16.7).

Source Census 2011 Municipal report, Gauteng, Report 03-01-52
Age Pyramid, Gauteng City Region.
Johannesburg city alone constitutes an important demographic dividend with an age-pyramid marked by a demographic regime of a decline in fertility combined with an important migration flux, particularly from young people aged from 20 to 35 years olds. The net migration into Gauteng accounted for 31% of the population increase between 1991 and 1996, and 20% between 1996 and 2001. Between 2001 and 2007, 40% of the population increase in the region was made up of net migration. A total of 781,701 immigrants came into the region: 42,385 to Sedibeng; 18,073 to Motsweding; 43,246 to the West Rand; 177,107 to Ekurhuleni; 275,027 to Johannesburg; and 225,863 to Tshwane [29]. Johannesburg offers opportunities for employment and high quality of living conditions and remains a city of migrants. Over the last 15 years, Johannesburg has become the main destination for migrants from other South African provinces as well as from the southern African region and the African continent in general. According to 2016 community survey only 65% of people living in Gauteng were born in the province. One third was born either in other provinces (29%) or in other countries (6%).
The Fig. 16.8 “Spatial distribution cities, towns and settlement” provides the spatial distribution of the settlement types and the proportion of population density. Cities, towns and dense settlements play a significant role within South Africa’s development settlement patterns. They can be divided in nodes and clusters on the one hand and sparsely populated areas on the other. Human Settlements are the nodes and clusters categories. Nodes are distinguished according to numbers and densities of population, levels of economic activity, as well as levels of social and economic services. They include City regions; Cities; Regional service centres (large and medium sized towns); Service towns; as well as Local & niche nodes. Clusters are largely described as densely clustered rural service centres and settlements, distinguished by high levels and densities of population distribution and relatively lower levels of economic activity.

Source Spatial distribution cities, towns and settlements
Spatial distribution cities, towns and settlement.
3.3 Urban Densities as Factor of Economies of Scale and Agglomeration
The population size is an important component of urbanization, but to address various questions in urban economics, environment and infrastructure development, information on density of the population is valuable [30]. Positive production or residential externalities, as well as negative externalities such as congestion, are function of density among others [31]. Various policy responses as well as programmes and projects such as for transport and infrastructure are subject to how population is distributed across a city. Important factors of land use such as land prices should be considered in this exercise as part of elements that can feed the land legislation and investment in infrastructure [32]. From an economic point of view, the higher the density of an urban agglomeration is, the lower are the costs of transactions, and the more prosperous is the economy. A deficient spatial structure fragments labour and consumer markets into smaller less efficient markets. It contributes to higher transactions costs by unnecessarily increasing distances between people and places. It increases the length of the city infrastructure network and therefore increases its capital and operating costs. Lower densities and segregated land uses increase economic costs in terms of average commuting distances, public utility provision, and energy consumption. From an environmental point of view, a deficient spatial structure can decrease the quality of life by increasing the time spent on transport, by increasing air pollution, and contributing to the unnecessary expansion of urbanized areas in natural sites. Poor environmental quality can also lower a city’s productivity.
In the African context where many cities are of density higher than 10,000 persons per km2, South African cities are particularly the exception withlow density. In the case of Johannesburg, the population density is only 3300 persons per km2 in 2016. The case of Johannesburg is common to South African cities as illustrated by the low population density also observed in Cape Town (4700 persons per km2), Durban (3200 persons per km2) and Pretoria (2500 persons per km2), all being cities of 3 million or more [33].
Gauteng is the most densely populated province in South Africa and the fastest growing province with 33% population increase between 2001 and 2011. The population density is 680/km2. The highest population density is in Johannesburg CBD, followed by Tshwane CBD. Townships and informal settlements have density of between 7476 and 22,371 per km2 [34
However, as illustrated in the Fig. 16.9, the low level of population density in South African cities compared to other African cities hides huge disparities in the cities such as Johannesburg where in townships and informal settlements densities are more than ten times the city average. In fact the average population density of 3050 inhabitants per km2 of the city of Johannesburg masks densities as high as 40,000 inhabitants per km2 observed in certain neighbourhoods of the city. These numbers are indicative of a segregated city and point despite huge efforts deployed by the city authorities since the end of the Apartheid regime to bridge the huge urban divide inherited from the cruel Apartheid regime (Fig. 16.10).

Source Angel et al., 2016. Atlas of Urban Expansion 2016, First Edition
Population, and density of Greater Johannesburg Metropolitan Areas, in 1990, 1998, and 2013.

Source CGRO population density per km2 derived from census 2011
Gauteng Population Density Map, 2015.
The pattern of spatial development in the Gauteng province features huge urban divides inherited from the Apartheid. While economic activities are concentrated in Johannesburg, Pretoria and the Vaal region, the population is concentrated in black townships such as Soweto, Alexandra, Tembisa, Mamelodi, Saulsville, Chris Hani, Thokoza, and Vosloorus, far away from job opportunities.
3.4 The Johannesburg City Foundation
3.4.1 Spatial Planning and Land Tenure
Access to adequate housing is one of the most important components of the South African urban development programmes. The implementation of housing development projects and other infrastructure development projects are aimed building non-racial towns and cities to fulfil the principle of a united people in non-racial residential areas. Since 1994, more than 4.3 million houses benefiting more than 10 million people had benefited from the housing programme delivered through development of low cost housing units, rental and bond subsidies. There developments were done in situ or green fields. Through Public-Private Partnership (PPP, numerous integrated projects, including residential units, business units, hospitals or social units were developed to promote social inclusion [35]. In addition, the South African government has enacted Spatial Planning and Land Use Management Act (SPLUMA) in 2013 for inclusive, equitable and efficient spatial planning at the different levels. In 2011, The Gauteng province also developed the Gauteng Spatial Development Framework (GSDF) 2030 to guide infrastructure investment and the management of activity patterns towards integration of the apartheid fragments, sustainable public transport, improved quality of life, sustainable and inclusive economic growth, protection of the natural environment, promote innovation and creativity and increased community participation in policies for development [36]. The GSDF has been aligned with the National Development Plan 2030, SPLUMA as well as with provincial and sector plans. The municipalities within Gauteng have also developed their Municipal Spatial Development Framework to address priorities within their municipalities. For instance, the city of Johannesburg Spatial Development Framework (SDF) was developed to addressing issues faced by the municipalities including inequality, urban sprawl, disconnected street networks, inefficient residential densities and land use diversity [36].
A number of programmes are in place to support the National Development Plan 2030 vision to transform settlements into sustainable spaces, where cities are self-sufficient and able to satisfy housing, economic and social needs of their communities. These future cities, through adequate planning and sufficient and timely provision of basic infrastructure such as water, sanitation, electricity, energy, roads and social amenities, will create sustainable human settlements. The concept of Mega Cities, which is embedded in these cities, “reinforces the key principles and considerations of spatial reconfiguration, township economy revitalisation and massive infrastructure investment as a means of transforming settlements and cities into productive cities that are inclusive, sustainable and founded on principles of good governance”. These developmental corridors are categories into Northern, Eastern, Western, Southern and Central. Through the Mega Cities programme in the five corridors, the Gauteng Department of Human Settlements targets to build 520,000 housing units allocated into 140,000 housing units in the Central Corridor; more than 100,000 in the Eastern Corridor; more than 160,000 units each in the Northern and the Western Corridors and more than 120,000 units in the Southern Corridor by the end of the current term in 2019 [37].
Despite huge efforts taken by the Gauteng authorities to create an inclusive, prosperous society, the province is still haunted in all aspects by the Apartheid regime that excluded for over a century millions of black people from accessing basic services. Even though the province has made great progress on eradicating informal settlements the number of people living in informal settlements remains high. There are still over 1.2 million households and 4.4 million people living in informal settlements in Gauteng and the province is estimated to have the country’s largest number of people living in informal settlements as illustrated in Fig. 16.11 [38].

Distribution of house in formal informal [16]
3.4.2 Basic Infrastructures
Water and Sanitation
The 2014 release shows that 13,2 million (85,9%) households had access to piped water in 2014 compared to 9.4 million (79.9%) in 2005. Households however, seem to grow less satisfied with the service as only 61.4% of households in 2014 indicated that they experienced ‘good’ quality service, compared to 76.4% of households in 2005. The percentage of households that indicated that they would pay for the water they received declined from 61.9% in 2005 to 43.7% in 2014 (Fig. 16.12).

Percentage of households that have access to piped water, Census 2011
The percentage of households in South Africa without access to an improved source of sanitation has decreased consistently over the past decade. The latest General Household Survey (GHS) found that the percentage of households with access to improved sanitation, that is flush toilets or pit toilets with ventilation pipes, has increased consistently from 62.3% in 2002 to 79.5% in 2014. The percentage of households without access to any sanitation facilities, or who were still using a bucket, at the same time declined from 12.3% in 2002 to 4.9% in 2014. The study found that households that shared sanitation facilities considered poor lighting (25.9%) and poor hygiene (23.7%) as the main problems followed by physical safety (19.5%) (Fig. 16.13).

Percentage of households that have access to flush/chemical toilet, census 2011
Energy Domestic Use
Having access to energy for cooking, heating and lighting is crucial to households. The survey found that the percentage of households connected to an electricity supply from the mains has increased consistently from 77.1% in 2002 to 86% in 2014. Percentage of households in Gauteng with access to electricity for ligthing increased from 85.9% in 1996 to 90.8% in 2011, while percentage of households with access to electricity increased from 80.9% to 84.2% in the same period (Fig. 16.14).

Percentage of households that have access to electricity, census 2011
Management of Solid Waste
In terms of refuse removal, while the percentage of households whose refuse is removed at least once per week has increased from 56.7% in 2002 to 63.8% in 2014, large differences exist between urban and rural areas. Whereas 88.6% of households in metros, and 84.1% of households in urban areas have their trash removed once per week, 90% of rural households either have no refuse dumps or have to create their own (Fig. 16.15).

Percentage of households that have access to waste disposal, census 2011
3.4.3 The City Foundation Index: Spatial Planning, Land Tenure and Basic Infrastructures
A smart city foundation is composed of three elements: Urban Planning and Design, Land Policies and Basic Infrastructure. For a city foundation to be smart, it must be inclusive at the onset of the urban planning and promotes mixed neighbourhoods where social clustering is discouraged. Having all the poor living together creates slums and fuels instability and insecurity. Inclusive urban planning eases access to basic services (water, sanitation, housing, education and health) and to decent employment for all. A key element of smart urban planning is a smart street network that reduces travel time and encourages walking and social interactions. Smart urban planning enhances infrastructure development, environmental sustainability, economic and social development; makes cities resilient and prepared to overcome natural disasters; and promotes mixed neighbourhoods where services are walking distances from people’s residences. Overall the metropolitan region is not smart; disaggregated data reveal huge disparities across districts in favour of the city of Johannesburg (Fig. 16.16).

Source Mboup, G. et al., 2016. Smart City Foundation—Drivers of Smart Cities. In Vinod et al., 2016. Smart Economy in Smart Cities, Springer
City Foundation.
Using the three main components of the city foundation, we have computed a composite index that represents the overall city foundation, the City Foundation Index (CFI) with values varying from 0 to 1. A value closes to 0 means that a city lacks most of the elements of the city foundation elements, and a value closes to 1 means that a city enjoys most of the elements of the city foundation. In the Gauteng City Region, the CFI is quite high in all cities and municipalities ranging from 0.891 in Johannesburg to 0.807 in West Rand. However, due the huge urban divide inherited from the Apartheid regime, this average hides numerous social inequalities experienced particularly in the townships such as Soweto (Fig. 16.17).

Components of the City Foundation Index, Gauteng City Region
4 Urban Accessibility and Mobility
Development of large metropolitan regions like Johannesburg constitutes economic and social opportunities as well as challenges depending on how the urban growth was planned and managed. It provides opportunities for economies of scale and agglomeration as well as for diffusion of ideas and innovations, but it will also call for large investments in infrastructures to respond to the increased demand for water, sanitation, solid management, energy and mobility, etc. It will particularly come with increased demand on mobility that must be satisfied with an efficient public transit accompanied with increased spaces for pedestrians and cyclists in order to safeguard the environment while creating economic growth. Economies of scale and agglomeration economies are greater in metropolitan areas where transportation infrastructures are able to answer mobility needs with higher access to markets and resources than those where people mobility is impeded by deficient transportation infrastructures. Efficient mobility will allow large-scale production of goods and services that can be distributed within the metropolitan regions and beyond with time, cost and reliability opportunities [1]. Without efficient mobility, a metropolitan region losses its economic power and remains just clusters of disconnected settlements.
4.1 Streets as Drivers of Urban Accessibility
One key element of urban planning is the street, which defines the form and structure of city. In recent years streets have been recognized as an integral factor in the achievement of sustainable urban mobility. A connected street network reduces travel time and encourages walking and social interactions. One fundamental feature of sustainable streets is their connectivity in terms of planning as well as design. With regard to planning, sufficient land should be allocated to streets (at least 25% city’s area) and the street network should be sufficiently long to cover all areas. There must be sufficient intersections available (at 100 intersection per km2) to facilitate shorter distances and reduce travel times, and encourage walking and social interactions [39]. A connected street network expands multimodal mobility systems with sidewalks and bicycle paths, ensures eco-efficiency of infrastructural systems, and supports density through integrated infrastructure development, thereby enhancing efficiency and access. In addition to accommodating all kinds of users (pedestrians, cyclists, motorists), sufficient land allocated to streets promotes connections to services that contribute to good health and productivity, such as clean water, sewerage facilities, drainage systems, power supply, and information and communication technologies. It enhances infrastructure development, environmental sustainability, and economic and social development. Streets that provide space only to motorists are characterized by congestion and high CO2 emissions [40].
The Johannesburg metropolitan region is not benefiting from all the multiple advantages associated with well-connected streets. With only 10–15% of its land allocated to streets in their CBDs, and less than 5% of land in their suburbs, it needs enhancement.
Composite Street Connectivity Index
Street connectivity is determined by the amount of land allocated to streets, the length of the street network and the number of intersections along the network. The proportion of land allocated to streets and the length of the street network is not sufficient to assess street connectivity. A city with wide streets within a very limited street network and low intersection density is considered a city with low street connectivity because the width of the streets is not complemented by a larger street network and higher street density. Similarly, a city with a lengthy street network and dense intersections may not quality as a city with high connectivity if the streets are very narrow. The Composite Street Connectivity Index (CSCI) aims to assess the connectivity of a street considering its width, its length and the number of intersections, all in relation to the total land area of a city. Interestingly, some cities in this group have low levels of land allocated to streets, but higher intersection density (ID) increases the value of their CSCI. For instance, Johannesburg city core has a LAS index moderately low (15%), but due to its high ID, it has a CSCI similar to the other cities with higher LAS but insufficient ID. The city core of Johannesburg is planned in grid pattern that favours good connectivity. However, the Johannesburg suburbs suffer from low LAS, limited street density with few intersections. Cities in this group have very poor street connectivity due to low levels of land allocated to streets, low street density and low intersection density. Their CSCI is less than half the highest level of the CSCI, which is 1. In these suburbs, which are mainly unplanned, provisions of basic services as well as means of transport remain challenges. Comprehensive city planning programmes are needed in these suburbs to improve the lives of urban dwellers (Fig. 16.18).

Source figure prepared from Mboup, G. et al., 2016. Smart City Foundation—Drivers of Smart Cities. In Vinod et al., 2016. Smart Economy in Smart Cities, Springer
Land allocated to street (LAS) in African cities.
Johannesburg is among the five African cities (Cairo, Alexandria, Casablanca and Dakar) with a CSCI of between 0.500 and 0.650. Their level of connectivity in the city core is sufficient to promote infrastructure development and to ease connections to basic services, such water, sanitation facilities as well as drainage systems. However, their suburban areas are very poorly connectivity, with a CSCI of below 0.300. Only one African city, Cape Town, features in the group with Cities with a CSCI equal to or above 0.800 along with cities in developed countries. It has streets sufficiently wide to accommodate all types of users, sufficient to reach most neighbourhoods, and sufficient intersections to accommodate all users (Fig. 16.19).

Composite Street Connectivity Index (CSCI)
4.2 Transport Modes and Infrastructures Are Key for Urban Mobility
Cities are locations having a high level of accumulation and concentration of economic activities and are complex spatial structures that are supported by transport systems. The larger the city, the greater is its complexity and the potential for disruptions, particularly when this complexity is not effectively managed. The most important transport problems are often related to urban areas and take place when transport systems, for a variety of reasons, cannot satisfy the numerous requirements of urban mobility. The Sustainable Development Goals (SDGs) recognize that sustainable transport is crucial for urban economic development. With Goal 11 of the SDGs “Make cities and human settlements inclusive, safe, resilient and sustainable”, member states have committed themselves to “enhance inclusive and sustainable urbanization and capacity for participatory, integrated and sustainable human settlement planning and management in all countries. Member States have further committed to support positive economic, social and environmental links between urban, peri-urban and rural areas by strengthening national and regional development planning, and by 2020, substantially increase the number of cities and human settlements adopting and implementing integrated policies and plans towards inclusion, resource efficiency, mitigation and adaptation to climate change, resilience to disasters, by 2030, …” [41].
4.2.1 State of Urban Mobility in Johannesburg Metropolitan Region
With their large population, megacities offer potential economies of scale and agglomeration. But they also call for large investments in transport infrastructures to respond to the increased demand in mobility. BRT, alone, will be insufficient to move daily millions of people. To respond to this demand, these megacities must put in place various combinations of high-capacity transport public modes, which are metro, light rail, BRT and buses. Though Johannesburg is pioneer in the development of BRT in the African continent, it is still facing huge mobility challenges associated to the diversity of their urban form as well as to the high unemployment rates. There are many settlements in the outskirts of the city that are left out from the BRTs. It may require a multimodal transport systems including, such a metro, that can accommodate a very large number of passengers. These high-capacity transport modes must also be integrated with other means of movement such walking, cycling and other private means that will serve as “feeders” [42]. These “feeders” are crucial particularly in Johannesburg where many informal townships unplanned and lack street network that can accommodate high-capacity transport modes.
Inter-city Public Transportation to Make the Gauteng City Region Works
To create economies of scale and agglomeration within the Gauteng City Region, an efficient, timely transport system is needed. Without efficient public transport, economies and scale and agglomeration that can generate the GRC with its 13 million will be jeopardized. The Gauteng province introduced, indeed, the Gautrain in 2002, a Rapid Rail Link connecting Pretoria, Johannesburg, and Johannesburg International Airport (JIA, now OR Tambo International Airport) as one of eleven Spatial Development Initiatives (SDIs). Two spines were also built: the west–east spine has a commuter service linking Sandton to the East Rand (through Rhodesfield, in Kempton Park) as well as an airline passenger service between Sandton and the city’s international airport. The south–north spine links the Johannesburg and Pretoria CBDs [43]. In 2007, the province launched the Gauteng Freeway Improvement Project (GFIP), the country’s largest road scheme, which aimed “to upgrade and expand the provincial road network through freeway widening, building new roads, upgrading interchanges, installing traffic-management systems (cameras and electronic signs) and an automated toll system” [19]. In addition to easing economies of scale and agglomeration, these inter-city public transports were supposed to reduce traffic congestion and reduce the commuter time. Other elements such as traffic accidents and pollution associated to private cars and minibuses were also expected to reduce.
In 2007, the National Cabinet also approved the Bus Rapid Transit (BRT) scheme as a road-based component of the Public Transport Strategy (SACN2011). This was to be funded by national government, but delivered by the metros. It was designed to be more transformative and scale-able. It had modern buses running on dedicated lanes along the middle of main roads [44]. The City of Johannesburg’s BRT system, named Rea Vaya, was operational from October 2013. The buses provide residents of Soweto and the southern parts of Johannesburg with direct access to the inner city and surrounding areas. The routes run from Soweto through Noordgesig, New Canada, Pennyville, Bosmont, Coronationville, Newclare, Westbury, Westdene, Melville, Auckland Park and Parktown, to the CBD. The Tshwane BRT system, named A Re Yeng, started operating in 2014 (SA Yearbook 2014). The R2.6-billion project, part of the city’s revitalisation project, consists of 80 km of bus lines and about 340 buses, some of which are powered by gas, serving 62 bus stops. It runs from Mabopane through Pretoria CBD, past Menlyn, and on to Mamelodi (City of Tshwane 2014).
However due to poor spatial planning in the apartheid days, Johannesburg still faces a huge transport problem, particularly: moving people from outlying areas such as Soweto into working hubs such as Joburg CBD and Sandton City. The city’s Comprehensive Integrated Transport Plan (ITP) is a very important document to guide how Johannesburg will provide, integrate and support public transport. The last plan expired in 2008 and a new plan went under review in 2011 (ITPs last five years), which considers affordable public transport, convenient and accessible transport, and a transport system with reduced crime, collisions, injuries and fatalities. Another consequence of the lack of efficient public transport systems, comes congestion, and the poorly maintained taxi ranks and train stations add to this problem. Ultimately, there are too many cars on Johannesburg’s roads and a comprehensive plan, such as the ITP, is needed to ease the gridlock [45].
In South Africa, the Public Transport Strategy aims to improve public transport by establishing an integrated rapid public transport network that comprises of an integrated package of rapid rail and road corridors. Through BRT, the government aims to link different parts of a city into a network and ensure that by 2020, most city residents are no more than 500 metres away from a BRT station [42]. The BRT systems are being implemented through public–private partnerships, whereby cities build and maintain the infrastructure for the operation of the buses, stations, depots, control centres and a fare collection system. Private operators, by contrast, own and manage the buses, hire staff and provide services on a long-term contract. Johannesburg is the pioneer in BRT in the African continent. “As soon as the BRT was introduced and operational in 2010, a robust but affordable bus management system was required, as there are many financial gains that can be made with the successful implementation of such a system. Today four other South African cities—Cape Town, Durban, Tshwane and in Rustenburg have adopted the BRT and have also introduced the ITS for transport planning, management and monitoring. Eight other South African cities are planned to adopt BRT or alike for efficient pubic mobility. All buses are equipped with free Wi-Fi on the trunk route, full air conditioning, low-floor technology which supports Euro V emission levels, vehicle stability and a cashless automated electronic system that is fully monitored by camera and censors [46].
State of Mobility in the Gauteng Province
As shown in Fig. 16.20, in the three large cities of the province—Ekurhuleni, Johannesburg and Tshwane—half or more can access a public transport within 10 min walk. In All three cities, more than three-quarters of the population can access public transport within 30 min walk (87, 77 and 77% respectively). These figures indicate the efficiency of public transport in the Gauteng province compared to many African cities where formal public transport is quasi-inexistent.

Source Gauteng Province Office of the Premier
Transport Profile, Gauteng City Region.
Turning Informal Transport Sector Challenges into Opportunities
Despite enormous efforts made to boost the public transport, the mobility demands have not been fully satisfied, informal public motorized means as well as use of private cars for those they can afford them are still significant mobility means. While playing a critical role in the public transport sector in the Gauteng province and in cities, the informal motorized means of transport face a number of constraints, ranging from administration and managerial issues to financial obstacles. Efforts should be made to interlink them with the formal transport systems. Rather than discouraging informal operators, national and local governments can set incentives and regulations that capture the benefits they may bring while mitigating negative factors, such as road safety and pollution. Some actions already taken by some countries and cities must be reinforced. The formalization of minibuses’ activities includes a renewal programme of the fleet minibuses as well as their administration. This also includes assisting in creating better conditions for loans to transport operator such as creating financial structures that can make car loan possible to operators. Subsequent formalization occasionally occurs through aid-financing arrangements, for instance through trust funds guaranteeing credit lines for vehicle purchase [42].
Walkability
Over the last few years, Johannesburg has been developing ‘walkable’ cities such as the infrastructure in Ivory Park, consisting of new pavements, benches, landscaping, public art, designated taxi park lanes, kerbs and stormwater drainage. According to Rehana Moosajee, member of the mayoral committee for transport in Johannesburg, transport is not only about the motorised kind, but people too. The Ivory Park project focused on infrastructure that would enable walking or cycling—the most sustainable way of getting around [47]. Overall, the future transport system in Johannesburg is dependent on a shift in transport modes from motorised to non-motorised; private to public transport; and road to rail (Fig. 16.21).

Source GCRO; City of Johannesburg Draft Spatial development Framework
Draft Spatial Development Framework Map of City of Johannesburg, 2016.
The city of Johannesburg Spatial Development Framework is aimed at developing sustainable and integrated residential areas, improved public transport and connectivity to the CBD and areas of economic activities and improving service delivery and promoting green economy.
4.3 ICT and Mobility in Johannesburg
“As soon as the BRT was introduced and operational in 2010, a robust but affordable bus management system was required, as there are many financial gains that can be made with the successful implementation of such a system. The Automatic Public Transport Management System (APTMS) was developed by a private consortium to deliver an ambitious range of information and services, including dynamic passenger information. The whole system was managed by a centralized control centre with CCTV monitoring on vehicles and in stations allowing headways to be monitored and provide direct voice communication with station staff and drivers” [48].
The Gauteng Open Road Tolling Project was commissioned by the South African Roads Agency Ltd in order to finance the upgrading of a network of approximately 185 km of freeway in Gauteng. This project uses electronic and automated methods of levying and collecting toll charges using 42 Tolling Points and is estimated to generate in excess of 2 million Tolling Point vehicle passages per day. The project comprises of the following sub-systems: Road Side Systems (overhead gantries), Open Road Tolling System Back Office, Transaction Clearing House and Violations Processing Centre. This project entailed the design, supply, installation and commissioning of remote traffic monitoring systems (RTMS) and equipment at 22 sites along the N2 between the Airport and City Centre. Aspects of the remote monitoring of traffic covered include the detailed recording of traffic volumes, vehicle types and vehicle speeds during all traffic conditions. The roadside sensors are capable of recording multi-lane data up to 10 lanes separately.
5 Smart Energy for Economic Development
South Africa is among the world’s least energy efficient countries with the country’s economy very energy intensive and accounting for approximately 40% of Africa’s total electricity usage. Unfortunately more than 90% of electricity generated in South Africa is based on coal. This puts South Africa as one of the highest emitter of greenhouse gasses in the world. To respond to the energy challenge, the Department of Energy has enacted a number of strategies, projects and programmes that are aimed at increased targets on the reduction in the national energy consumption, promotion of renewable energy and introduction of Independent Power Partnership (IPP) among others and development of Smart Grid. The adoption of the Constitution (1996) and Bill of Rights created the foundation for South Africa’s Renewable Energy (RE) programme. The energy policies in South Africa policies include the 1998 White Paper on Energy Policy (WPEP), the 2003 White Paper on Renewable Energy (WPRE) and the 2011 National Climate Change Response White Paper Policy. The 2003 white paper seeks to ensure that renewable energy is part of the energy mix in the country. The National Development Plan (NDP) sets the overarching long- term vision for South Africa’s growth and development. On the National Climate Change response 2011 white paper, South Africa commits to make a fair contribution to the global effort to stabilise greenhouse gas concentrations in the atmosphere within a time frame that is compatible with sustainable development.
The major fuels consumed in metros are electricity, which is used predominantly for lighting, heating, cooling and cooking, and petrol/diesel, which is mostly used for transport. Diesel is used for freight and passenger transport, as well as for industrial applications. Petrol is used almost exclusively for passenger transport largely for private passenger transport. Most energy is consumed by the transport sector than residential areas. This is attributed to the fact that South African cities have lower densities, which results in expanded transport network. Even though the transport sector consumes more energy, residential areas emit higher carbon emissions.
In 2012, South Africa was amongst the top investors in renewable energy. South Africa is fortunate in that, over and above its rich coal resources, it is also well endowed with non-delectable renewable energy sources, notably solar and wind. The country has an average of more than 2500 h of sunshine per year and average direct solar radiation levels range between 4.5 and 6.5 kWh/m2 per day, placing it in the top-3 in the world. The Department of Energy has developed a Wind Atlas, which showed greater potential of wind energy along the coastal areas. Potential of small-scale hydro energy has been identified in some part of the country. With few hydro power stations, the potential of hydro energy is yet to be exploited. The country also recognised the potential of biomass resources and has developed the Biomass Action Plan, which assesses biomass resources in the country. The local municipalities are mandated to play a large role in improving energy efficiency by ensuring the existence of applicable laws, education Programme and policies. As such municipalities are expected to develop and implement energy efficiency and renewable energy strategies and projects.
Smart Grid
A smart grid is an electrical grid that uses modem technology (digital or analogue) to collect and communicate electricity related information of both the suppliers and consumers. Installation of smart grids improves the overall efficiency of the system by contributing in the efficient transmission and distribution of the electricity. Smart meters are the key component in smart cities. City power, an independent municipal entity wholly owned by City of Johannesburg, was established in 2001 to provide electricity and energy solution to CoJ. City Power contributes to smart city initiatives through development of smart grid. The metropolitan municipalities are also responsible for the implementation of smart grid, renewable energy and energy strategies.
Smart Meter
A smart meter is an electronic device that records consumption of electric energy in intervals of an hour or less and communicates that information at least daily back to the utility for monitoring and billing. Smart meters enable two-way communication between the meter and the central system Smart meters are the key component in smart cities. As part of smart grid initiative, in Johannesburg, City Power started installing smart meters (Advanced Metering Infrastructure (AMI)) in 2011 to reduce energy loss due to levels of vandalism and meter by passing to improve safety of people and energy efficiency. AMI is an integrated system of smart meters, communications networks, and data management systems that enables two-way communication between utilities and customers. The installation of smart meters resulted in increased revenue and reduced our operational costs. The use of smart meters also enables the city to communicate with the residents through sms to reduce power consumption at a particular time to reduce the demand of electricity or remind them to pay an outstanding bill. Another advantage of using smart meters is that City Power will be notified immediately when there is fault on the line. In 2016, about 75,000 smart meters were installed in Johannesburg suburbs, business areas and townships.
Renewable Energy
City of Johannesburg in line with Kyoto Protocol and the summit is determined to create a green city, in keeping with the movement to prevent climate change and improve the environment. Any of the City’s development decisions are taken with the need for a green planet in mind: from greening and cleaning the environment, to reducing the energy load in buildings, to cutting carbon emissions. City of Johannesburg has a policy in place that emphasises energy efficiency and resource sustainability in urban development. Its own buildings set the trend for energy cuts, and the City has received much acclaim internationally. Most areas in South Africa average more than 2500 h of sunshine per year, and average solar-radiation levels range between 4.5 and 6.5 kWh/m2 in one day. This makes solar the most accessible resource in the country. In 2010, the city of Johannesburg launched a solar heating programme to reduce electricity consumption which special focus to poor and low-income areas. The programme is part of the City’s 2040 Vision to save energy and create employment through a low carbon infrastructure. In 2014, around 43,000 solar water heaters which generate 22.5 GW of electricity per hour were installed in the city. By-laws regarding solar water heaters were recently approved City of Johannesburg Council, and the city enforces the use of solar heaters in all newly built houses and in new building additions. Areas that have benefited from the solar heater programme include government building, townships and informal settlements. These areas include Devland, Lawley, Vlakfontein, Eldorado Park, Lenasia, Alexandra and Leha as illustrated in the figure (Fig. 16.22).

Solar geysers installation project
Waste to Energy Project
Johannesburg water utility made the decision to investigate biogas to electrical energy options following the realisation that continued electricity tariff increases by Eskom would have a direct effect on the operational costs of wastewater treatment in Johannesburg. In 2013, the first City of Johannesburg water utility, Johannesburg Water (JW), officially launched its pilot Biogas Project at the Northern Works Waste Water Treatment Plant. The electricity produced is for own-use within the wastewater treatment works and runs in parallel with the incoming Eskom grid. It is capable of producing approximately 10% of the plant’s power requirement. This project will be incorporated into other 6 of JW’s treatment works into the programme eventually.
Biogas to Energy
Biogas is produced when any type of organic matter decomposes in the absence of oxygen. The City of Johannesburg (COJ) identified that methane emissions at some of their landfill sites were in excess of the prescribed air quality licensing thresholds. They embarked on consultations with industry and identified that harvesting the landfill gas to produce electricity would solve their air quality problem. An ambitious landfill gas to electricity project has been initiated. South Africa’s first independent landfill gas-to-power project has begun generation at Robinson Deep landfill in Johannesburg in 2016, providing 3 megawatts (MW) of renewable electricity, enough to supply more than 5500 homes. This project was a partnership between the city and private companies (Independent Power producers, IPP) and it will be expanded to other landfill sites.
6 Urbanization, Economic Growth and Metropolitan Regional Development
Towards the end of 2010, a New Growth Path (NGP) was introduced. The priority in the NGP was the identification of ‘job drivers’ for the creation of ‘decent’ jobs. Public investments were directed at infrastructure development, improving value chains in agriculture and mining, investing in a green economy, and encouraging light manufacturing sectors, tourism and other high level services. The government planned to expand employment to the tune of five million jobs by 2020 through high GDP growth rates, and improve the employment intensity of growth, which had decline significantly over the preceding decade from 0.8 to 0.67 [49]. The South Africa government also operated a paradigm shift considering that the concept of human settlements is not just about building houses. Changing the apartheid spatial patterns, it calls for a holistic approach that allows low income households in rural or urban areas to have easy access to economic centres, social amenities and basic services such as water, electricity, recreational facilities, schools, clinics and a host of others [3].
The spatial structure of the province reveal contrasted pictures with the development of Eco-Tourism/Protected Areas (light green) in several parts of the province, but most importantly in Tshwane and Johannesburg. Major Economic Areas are mostly located in Johannesburg while the Mining activities are located in Ekurhuleni (Fig. 16.23).

Source Gauteng Spatial Development Framework 2030, http://www.gauteng.gov.za/government/departments/office-of-the-premier/Documents/GSDF%202030
Overall provincial spatial structure.
6.1 Urbanization and Economic Growth
Contrary to most African countries, urbanization and economy growth in South Africa are closely associated above the average. The relationship between urbanization and economic development had been uneven in most African countries, and urbanization has not led to economy growth as shown in 16.24. As countries in Asia such as China, Indonesia, Malaysia, Thailand and Vietnam and in LAC such as Mexico, Costa Rica and Argentina, South Africa displays an increase in GDP per capita associated to high urbanization rates; a similar association between GDP per capita and urbanization was not observed in most sub-Saharan African countries among them Senegal, Guinea, Togo, Liberia and Burundi. In most of African countries, capital cities were not able to produce and distribute wealth nation-wide (Fig. 16.25).

Source % urban (UNDESA), GDP per Capita (World Bank)
GDP per capita by Urbanization level (%), Country with GDP below US$15,000.

Source Gauteng Spatial Development Framework 2030
Gauteng Economic Activities.
The economic sectors within GRC include agriculture and forestry, mining, manufacturing, electricity, gas and water, wholesale and retail, transport and communication, finance and business services, community and social services. Estimates of income disparities in 1995 suggest that average white monthly household incomes were four and a half times larger than those of black households (Gauteng Provincial Government 1995).
6.2 Towards a Smart Metropolitan Regional Development
Most of the components of a Smart Metropolitan Regional Development (SMRD) are composed of several simple sub-components. To put them together to track progress on the overall objective of the SMRD will require the development of composite indices using sophisticated multi-level statistical analysis including Principal Component Analysis. The complexity of a composite index is the fact that it is strongly influenced by several factors including: the normalization, the standardization and the degree of association between variables and the number of variables that compose the index. An index can also be conceptualised differently using different variables. This calls for caution when interpreting a composite index. For instance, the Quality of Life is conceptualised and measured in different ways across studies. The Human Development Index includes indicators of health and education, alongside an economic component (Gross Domestic Product or GDP); the Legatum Prosperity Index considers quality of life to be multidimensional, including both wealth and wellbeing. The Economist Intelligence Unit’s Quality of Life Index links life satisfaction to health, family life and community life; and the OECD’s Well-being Initiative has two dimensions: ‘material living conditions’ and ‘quality of Life’ [50].
The city of Johannesburg was included in the development of three indices published by the UN-Habitat and conceptualized and further developed by Mboup G. (2012, 2013 and 2014). Those indices include: the City Human Development Index, the City Prosperity Index and the urban form-based City Prosperity Index integrating the Composite Street Connectivity Index. This section will take it further for the development of the Smart Metropolitan Regional Development Index.
6.2.1 Urbanization and Human Development
The human development is made from element of economic development (GDP per capita) and elements of Social Development (Education and Health). All three elements are components of a smart metropolitan regional development. Johannesburg is still engine of South Africa Economy as illustrated in Fig. 16.26 with the Johannesburg HDI much higher (0.823) than national HDI (0.658); it has better economy outcomes as well as better health status than the national average. It occupies a pivotal place in the trade sector both nationally and internationally. Important progress has been made on education, which is critical to meeting the challenges of smart metropolitan regional development, as it connects people to new approaches, solutions and technologies that enable them to identify, clarify and tackle local and global problems. Similarly, important progress has been made on health, which is critical to realizing economic growth through increased productivity. Healthy workers are more productive, bringing greater income to families and higher levels of economic growth for nations, and then enhance smart economy.

Source City HDI computed by the authors, and National HDI from UNDP, 2014, Human Development Report 2014
City Human Development Index (HDI) and Country HDI, 2014.
6.2.2 Urbanization and City Prosperity
The City Prosperity Index (CPI) published by UN-Habitat in 2012 under the coordination of Mboup G includes various indices and indicators that are relevant to urban areas, and important for prosperity-oriented public policy-making. The first version of CPI published in 2012 was based on five dimensions: Productivity, Quality of Life, Infrastructure Development, Environmental Sustainability, and Equity and Social Inclusion [51]. In 2013, the CPI was revised to include the urban form dimension measure of street connectivity [52].
Among the 20 African cities included in UN-Habitat’s CPI sample, Cape Town, Johannesburg, Cairo and Casablanca are the only ones featuring solid prosperity factors (CPI of between 0.700 and 0.799). This group is heterogeneous, with some cities showing a ‘less coordinated’, ill-balanced development in the ‘spokes’. This comes as the result of institutions, legal and regulatory frameworks and urban management practices that are being consolidated and because of this; they cannot hold together all the elements of the ‘wheel’ to operate with stability. Heterogeneity is also related to the stage of development of the relevant countries. However, it is important to note that inequality is inconsistent with prosperity as understood in this Report. When the equity index is included in the CPI, Cape Town and Johannesburg (which both feature very high Gini coefficients), drop from the bracket of cities with ‘solid’ prosperity factors and join the group with ‘weak’ or even ‘very weak’ prosperity factors, with CPI values of 0.590 and 0.479 respectively. Johannesburg like most South African cities has experienced significant economic growth, but in the past two decades life expectancy has declined substantially, affecting quality of life. Cities in emerging economies such as South Africa combine high economic growth and strong infrastructure, and are expected to move faster along the path of prosperity—but then, for the sake of balanced development, they must tackle inequalities and environmental degradation. They must also look to improving quality of life through more ample provision of public goods (Fig. 16.27a).

a Components of City Prosperity
6.2.3 Towards a Smart Metropolitan Regional Development
Among the components of the Smart Metropolitan regional Development, five have been part of the City Prosperity Index (CPI): Productivity, Infrastructure development, Environmental Sustainability, Quality of Life and Social Inclusion. The SMRD index introduces other components relevant for sustainable urban development: Disaster Risk Reduction and Resilience, Peace and Security, Institutions and Laws. It expands productivity to Economic Development, Quality of Life to Social Development, and makes the distinction between Infrastructure Development and Basic Infrastructure. It introduced the concept of city foundation built upon three dimensions: urban planning, land policies and basic infrastructure. It also introduces ICT at the centre of the SMRD along with the City Foundation and Institutions and Law. Considering that the CFI and the CPI was already measured in previous sections, the measurement of the SMRD is incremental and built upon those indices with the inclusion of Peace and Security as well as Disaster Risk Reduction and Resilience (Fig. 16.27b).

Source Provisional results from Mboup G. (ed.), 2018 Forthcoming Publication “Smart Economy in Smart African Cities”, Springer
b Components of the SMRD.
In addition to the urban challenges analysed in previous sections, the population of Johannesburg has been constantly exposed to disasters, particularly to flooding during raining seasons. Apart from habitat degradation, floods have caused considerable economic, social and environmental losses in Johannesburg. Most households in Johannesburg are built in unplanned settlements that lack most basic services, particularly in suburbs, leading to frequent flooding and several other social and economic negative externalities. In addition to disaster exposure, South Africa was classified among the less peaceful countries based on the Global Peace Index (GPI) ranking in 2015. The GPI scores are the aggregates of 23 qualitative and quantitative indicators across three thematic domains: the level of Societal Safety and Security; the extent of Ongoing Domestic and International Conflict; and the degree of Militarisation. Out of 163 countries, South Africa was ranked 136 with a score of 2.376 compared to the lowest score, which is estimated at 1.148 for Iceland and the highest score, which is estimated at 3.645 for Syria. In Africa, only four countries—Senegal, Mauritius, Botswana and Namibia—are among the top 50 peaceful countries globallyFootnote 1. With a high City Foundation, a high Human Development Index and a weak City Prosperity Index due to high inequalities, we have noted that high exposure to disaster coupled with high insecurity will reduce the level of Johannesburg Smart Metropolitan Regional Development Index. Though this a preliminary assessment of the SMRDI since data are not able for some sub-indices, rapid assessment of available data point to the fact Johannesburg SMRDI is low due do to historic structural failure on urban development, chronic inequality of opportunities coupled with high level of insecurity.
7 Spatial and Economic Design Strategies for a Smart Johannesburg Metropolitan Regional Development
This section consists of analysing urban policies and programmes put in place by national and local authorities for the transformation of Johannesburg to a Smart Metropolitan Region. The analysis will be done at two levels: (1) at the Gauteng Provincial level, and (2) at the Johannesburg city level. In addition to urban policies and programmes at the provincial level, each city, district and municipality which developed specific urban policies and programmes relevant for its territory will be looked at.
7.1 Urban Policies and Programmes at the Gauteng Provincial Level
Gauteng City Region Integrated Infrastructure Master Plan [53]
Towards sustainable urban development, the Gauteng has developed several urban policies and programmes including: the GCR Integ-rated Infrastructure Master Plan (GCR IIIM 2030), the National Development Plan Vision 2030, The GCR’s programme of Transformation, Modernisation and Reindustrialisation, etc.
The GCR Integ-rated Infrastructure Master Plan (GCR IIMP 2030), as a comprehensive inter-sectorial plan, promotes sustainability through the efficient use of resources and the adoption of transformative technologies. It provides policy directions to various stakeholders including residents and investors and fosters collaboration across government and with the private sector [27]. This works in relation to broader national plans.
The National Development Plan Vision 2030 sets goals for infrastructure development to enable socio-economic transformation as follow:
-
All South Africans have access to affordable, reliable and safe drinking water;
-
Universal access to hygienic sanitation;
-
At least 90% of South Africans have access to grid electricity, with the remainder accessing electricity from off-grid resources; and
-
Improved productivity of infrastructure and increased levels of public and private investment to a combined 30% of GDP.
The GCR’s programme of Transformation, Modernisation and Reindustrialisation requires infrastructure interventions to:
-
Develop economic potential in individual corridors;
-
Ensure growth and opportunities are equitably distributed across the GCR;
-
Deliver housing and economic opportunities where most needed to realise radical spatial and economic transformation;
-
Ensure infrastructure efficiency through coordinated planning, prioritisation and timing of delivery; and
-
Unlock human capital in a dynamic, innovative, competitive and connected city region.
Realising an inclusive and competitive GCR requires that infrastructure development promotes equitable access, sustainability connectivity, spatial justice and mobility.
Development of Corridors Under the GCR
The GCR’s space and economy are configured along five Development Corridors to drive radical economic transformation, decisive spatial transformation and re-industrialisation. Each corridor has distinct industries and comparative advantages:
-
The Central Development Corridor is developed around the City of Johannesburg as the hub of finance services, ICT and pharmaceutical industries.
-
The Eastern Development Corridor is developed around the economy of the Ekurhuleni Metro as the hub of manufacturing, logistics and transport industries.
-
The Western Development Corridor includes the economy of the current West Rand District and the creation of new industries in support of green technology and manufacturing, new economic nodes and new cities.
-
The Southern Development Corridor embraces the economy of the Sedibeng district and the creation of new industries to support and develop the agricultural sector, new economic nodes and new cities.
-
The Northern Development Corridor encompasses Tshwane as the nation’s administrative capital city and the hub of the automotive sector, research, development, innovation and the knowledge based economy (Fig. 16.28).
Fig. 16.28 
Source Gauteng Provincial Government, Republic of South Africa, Gauteng City Region Integrated Infrastructure Master Plan (GCRIIMP 2030)
Gauteng City Region’s Corridor Projects.

The GCR IIMP identifies the following Apex projects as key to achieving the objectives of radical Transformation, Modernisation and Reindustrialisation, including: Water security; Regional sanitation schemes; New freight and logistics hubs at the international airport; New rail link; BRT; Outer freight link; and Upgrade of 19 railway stations.
It identifies smart projects such as:
-
E-government: Modernising access to government services and rolling out the Gauteng Broadband Network to ensure GCR-wide access by 2019
-
Improving healthcare through the construction of three district hospitals that will employ the latest technology and e-health systems
-
Ensuring that all learners have access to tablet technology, broadband and smart classrooms to develop the skills required for a modern and innovative economy
-
Reconfiguring the City of Johannesburg around high-density transport corridors and improving mobility through extending the Rea Vaya bus rapid transit system
-
Rebuilding the western centre of Tshwane through infrastructure renewal, high density residential development and well-connected communities with access to world-class amenities
-
Revitalising the economy of Sedibeng around a modern and sustainable node along the Vaal River and creating a more cohesive urban form.
The Gauteng’s 25-year Integrated Master Plan also includes the transformation of Johannesburg into a sustainable, active city with accessible public spaces for all. Sustainability, active lifestyles, human interaction, and great public spaces are for improving environment and human health, advance economic development, and boost transportation systems.
Launched on 19 August 2013, the 25-year Integrated Transport Master Plan (ITMP25) is built on the principles of economic beneficiation. The ITMP25 proposes eight key interventions:
-
Subsidised housing provisions;
-
Land use densification in support of public transport;
-
Reinforcing the passenger rail network;
-
Extending the integrated rapid and road-based public transport networks;
-
Strengthening freight hubs;
-
Ensuring effective travel demand management;
-
Mainstreaming non-motorised transport; and
-
Ensuring continued mobility throughout the province;
The Gauteng programme of “Transformation, Modernisation and Reindustrialisation of the Gauteng city region, 2015–2030 includes ten pillar programmes as follow [49]:
-
Radical economic transformation
-
Decisive spatial transformation
-
Accelerating social transformation
-
Transformation of the State and governance
-
Modernisation of the economy
-
Modernisation of the public service
-
Modernisation of human settlements and urban development
-
Modernisation of public transport infrastructure
-
Re-industrialise Gauteng
-
Lead in Africa’s new industrial revolution
Other projects include:
-
Revitalisation of township economies
The GCR adopted a Township Economy Strategy with a detailed action plan to transform townships into vibrant economic centres of opportunity and job creation
-
Aerotropolis
This GCR Project aims at leverage the potential of the three big airports in the GCR as economic engines for sustainable growth and job creation (to be anchored along ORTIA, Lanseria and Wonderboom Airports)
-
Gautrain expansion and extension
This is to increase accessibility and improve mobility by expanding and extending the current network
-
Energy mix and Gauteng green agenda
This is respond to the energy generation and distribution in the GCR. Gauteng Energy Steering Committee has been established, to work towards establishing a GCR energy mix mechanism, work with independent power producers, to generate and distribute energy, including outside of the grid.
-
ICT and Broadband Connectivity for the GCR
This is to establish a hi-speed capacity network across Province in support of effective governance, service delivery and economic growth, and to encourage growth in ICT sector through services and infrastructure
-
Spatial Transport Transformation
-
Metropolitan BRT Systems to increase accessibility by completing metro systems with potential extension
-
Metrorail Upgrade to implement 25 years ITMP specifically moving passenger transport from road to rail
-
Gauteng Freight and Logistics Hubs to o increase economic efficiency by improving the regional flow of goods through the expansion of freight & logistics hubs
-
-
Agritropolis
This is to support the development of the Agri-sector and ensure job creation from increased agri-activity
-
Sustainable Human Settlements
From RDP developments to the development of sustainable human settlements on well located land, with socioeconomic opportunities.
Realising an inclusive and competitive GCR requires that infrastructure development promotes equitable access, sustainability connectivity, spatial justice and mobility.
7.2 Urban Policies and Programmes at the Johannesburg City Level
To ease management of municipalities, the administration of Johannesburg metropolitan region is now organised into seven regions following the creation of the post-apartheid City of Johannesburg Metropolitan Municipality in 2000. “Each region is operationally responsible for the delivery of health care, housing, sports and recreation, libraries, social development, and local community-based services. Each region will develop its own Local Integrated Development Plans (LIDPs). A LIDP guides a region’s future development. For this reason, the LIDP zones closely follow the boundaries of the regions. LIDPs deal with city development, management and growth over a five to 10-year period. While they deal with local issues, they take an integrated approach to issues such as transportation, housing and environmental management. An overall Metropolitan IDP looks at the bigger picture and ensures that LIDPs don’t conflict or lead to wasted resources. LIDPs are revised annually so as to respond to changing conditions both locally and at a city level” [55].
The Johannesburg Smart City Programme
Despite several urban policies and programmes put in place for an inclusive sustainable urban development in Johannesburg, the metropolitan is still facing enormous challenges such as [56]:
-
Slow economic growth marked by: (a) Structural weaknesses in the global economy coupled with a weak Rand; (b) Rising interest rates and inflation; (c) Income inequality and poverty remain prevalent; and, High Unemployment rate, particularly among young people; informal economy;
-
Social exclusion characterised by: (a) exclusion of poor communities from access to housing and land; (b) mobility is still a challenge for the urban poor;
-
Urban violence and insecurity: crime rates are still among the highest in the world;
-
Climate Change: the city is facing climate change with Johannesburg being ranked 13th in the world of Greenhouse Gas (GHG) emitters and largest GHG City in South Africa;
-
Corruption and lack of transparency are still on course.
Considering these multiple challenges, the city of Johannesburg has put in place a holistic smart city programme to be implemented at 85% by 2021. This programme encourages innovation and efficiency; preservation of resources for future generation; resource sustainability with, for instance, 30% diversion in waste disposed by landfill. The programme is extended to natural resources, environment pollution and carbon emissions [56]. For the year 2017/2018, the city of Johannesburg has also elaborated ten points for urban development including: (1) ensuring that the entire city embraces the environment of a new coalition government; (2) Promoting economic development and attract investment towards achieving 5% economic growth; (3) Ensuring pro-poor development that addresses inequality and provides meaningful redress; (4) Creating a culture of enhanced service delivery; (5) Creating a sense of security through improved public safety; (6) Creating an honest and transparent city that fights corruption; (7) Creating a city that responds to the needs of residents; (8) Enhancing financial sustainability; (9) Encouraging innovation and efficiency through programmes such Smart City and; (10) Preserving the city resources for future generation [56].
These ten points will be delivered through the following five pillars:
-
PILLAR 1: Grow the economy and create jobs
-
PILLAR 2: Enhance quality of life by improving services and taking care of the environment
-
PILLAR 3: Advance pro-poor development that provides meaningful redress
-
PILLAR 4: Build caring, safe and secure communities
-
PILLAR 5: Institute an honest, responsive and productive government.
This will also be based on city-wide community based projects as presented in Fig. 16.29 “35 City-Wide Community Based Projects.

Source City of Johannesburg, 2017–18 Draft Integrated Development Plan Review
35 Citywide Community Based Projects.
At the spatial level, the transformation of the city of Johannesburg will consist of:
-
1.
Compact city—combining density, diversity, proximity and accessibility, reducing distances, travel times and costs, bringing jobs and social amenities to single use, marginalised residential areas, reducing energy consumption and infrastructure costs.
-
2.
Inclusive city—ensuring balanced service provision (hard and soft) and opportunities for all by diversifying land uses, promoting social mixing and bridging social, spatial and economic barriers.
-
3.
Connected city—enhancing public transit and ICT infrastructure at provincial and urban scales to re-connect the city, starting from ‘the Corridors of Freedom’ to street and neighbourhood-level connectivity.
-
4.
Resilient city—building a metropolitan open space system as a protection buffer, preserving valuable green infrastructure and areas of high agricultural potential, promoting sustainable energy use, reinforcing the urban development boundary and protecting biodiversity resources.
-
5.
Generative city—focusing investment in transformation areas and nodes towards: achieving positive social, economic and environmental returns on investment; spurring economic growth and job creation and enhancing public space and promoting sustainability (social, environmental and economic) (Fig. 16.30).
Fig. 16.30 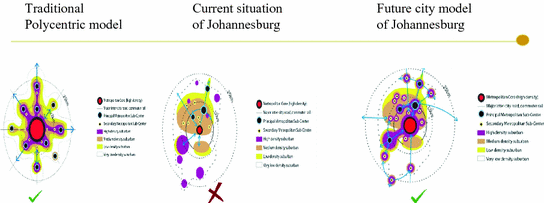
Source City of Johannesburg, 2017–18 Draft Integrated Development Plan Review
Spatial development framework-future outlook.

In response to multiple challenges faced by its citizens, the city of Johannesburg has also developed the 2040 Growth and Development Strategy (GDS) initiated in August-September 2011. The Joburg 2040 GDS lays the foundation for multi-level, multi-scalar and integrated responses to the challenges the city faces. It aims to strengthen the adaptive capacity of the City and its citizens in order to become more resilient to potential and unpredictable futures. The GDS is closely tied to the five-yearly Integrated Development Plan (IDP). The GDS charts the long-term strategic course of the City, and makes some of the bigger, overarching decisions about what to emphasise if Joburg is to accelerate economic growth and human development. The IDP defines where we want to be after five years, and how we intend incrementally achieving long-term goals. The outcomes originate from the 2040 GDS.
Outcome 1: Improved quality of life and development-driven resilience for all
The city envisages a future that presents significantly improved human and social development realities, through targeted focus on poverty reduction, food security, development initiatives that enable self-sustainability, improved health and life expectancy, and real social inclusivity. By 2040, the city aims to achieve substantially enhanced quality of life for all, with this outcome supported by the establishment of development-driven resilience.
Outcome 2: Provide a resilient, liveable, sustainable urban environment—underpinned by infrastructure supportive of a low-carbon economy
The city plans to lead in the establishment of sustainable and eco-efficient infrastructure solutions (e.g. housing, eco-mobility, energy, water, waste, sanitation and information and communications technology), to create a landscape that is liveable, environmentally resilient, sustainable, and supportive of low-carbon economy initiatives.
Outcome 3: An inclusive, job-intensive, resilient and competitive economy that harnesses the potential of citizens
The city of Johannesburg will focus on supporting the creation an even more competitive, ‘smart’ and resilient city economy, when measured in relation to national, continent and global performance. The city will promote economic growth and sustainability through the meaningful mobilisation of all who work and live here, and through collaborating with others to build job-intensive long-term growth and prosperity, from which all can benefit.
Outcome 4: A high performing metropolitan government that pro-actively contributes to and builds a sustainable, socially inclusive, locally integrated and globally competitive Gauteng City Region
The City of Johannesburg finally envisages a future where it will focus on driving a caring, responsive, efficient and progressive service delivery and developmental approach within the GCR and within its own metropolitan space, to enable both to reach their full potential as integrated and vibrant spaces.
8 Conclusion
Since the end of the Apartheid, Johannesburg has become the main destination for migrants from other South African provinces as well as from other African countries. One third (35%) of Gauteng residents were born in other provinces or in other countries. The Greater Johannesburg Metropolitan Area represents 14% of the national population. It is an engine of South Africa with a share of 18% of the national GDP which itself represents 24% of the African GDP. This is the reason Johannesburg is considered a global African city. Johannesburg also scored the Human Development Index in the country.
The City Foundation of Johannesburg has historically been guided by a segregationist ideology manifested through institutions and laws, urban planning and design, and access to basic services and amenities. During the Apartheid, the majority of township areas designated for non-white people were situated between 25 and 30 km away from the central business district, leading to significant transport challenges. The dismantling of apartheid in the early 1990s came with calls for inclusive development in South Africa. Different models have however been adopted to make the city more inclusive post apartheid, the key ones being on participatory planning and design; development of inclusive public spaces; improvement in basic infrastructure provision and public transport particularly to the poor neighbourhoods and; development of policies that encourage inclusive human settlement and trade.
Today Johannesburg is at the heart of the Gauteng province’ cluster of economic activity.. Under the cluster of cities of the Gauteng city region, the city of Johannesburg is the Financial Hub, the Ekurhuleni Metro the Manufacturing Hub, the West Rand District the agribusiness/agroprocessing and green and blue economy, Sedibeng District Municipality with the New economy to be anchored on steel, Vaal river, tourism, agriculture linked to Sasolburg, and the City of Tshwane being the Administrative Capital has become a key driver of knowledge, innovation and automotive industry development. The region promotes spatial transport transformation through Metropolitan BRT Systems, Metrorail Upgrade and Gauteng Freight and Logistics Hubs.
In addition to the city-region projects, cities themselves are also developing their specific sustainable urban development projects and programmes. For instance, to ease management of municipalities, the administration of city Johannesburg is now decentralised into 7 regions following the creation of the post-apartheid City of Johannesburg Metropolitan Municipality in 2000. “Each region is operationally responsible for the delivery of health care, housing, sports and recreation, libraries, social development, and local community-based services. Each region will develop its own Local Integrated Development Plans (LIDPs). A LIDP guides a region’s future development. While they deal with local issues, they take an integrated approach to issues such as transportation, housing and environmental management.
Despite several urban policies and programmes put in place for an inclusive sustainable urban development in Johannesburg, the metropolitan is still facing enormous challenges such as slow economic growth marked by High Unemployment rate, particularly among young people; Exclusion of poor communities from access to housing and land; Mobility is still a challenge for the urban poor; Urban violence and insecurity; and Climate change with Johannesburg being ranked 13th in the world of Greenhouse Gas (GHG) emitters and largest GHG City in South Africa.
Considering these challenges, the City of Johannesburg has put in place a holistic smart city programme to be implemented at 85% by 2021. This programme encourages innovation and efficiency; preservation of resources for future generation; resource sustainability with, for instance, 30% diversion in waste disposed by landfill. For the year 2017/2018, the city of Johannesburg have elaborated ten points for urban development including to: (1) Ensure that the entire City embraces the environment of a new coalition government; (2) Promote economic development and attract investment towards achieving 5% economic growth; (3) Ensure pro-poor development that addresses inequality and provides meaningful redress; (4) Create a culture of enhanced service delivery; (5) Create a sense of security through improved public safety; 6) Create an honest and transparent City that fights corruption; (7) Create a City that responds to the needs of residents; (8) Enhance financial sustainability; (9) Encourage innovation and efficiency through programmes such Smart City and; (10) Preserve our resources for future generation.
The future of the city is driven by many efforts of state intervention towards building a smart city and a smart province. However, the effort for a successful smart future will lie in collaborative and collective function between all stakeholder involved. The government, business and community organisations therefore should come together to build a smart urban future. A new form of networking with technology, with knowledge, action and most importantly in spirit is crucial in the making of a smart future city and a smart province.
Notes
- 1.
https://reliefweb.int/sites/reliefweb.int/files/resources/Global%20Peace%20Index%20Results%20Map_0.pdf. Downloaded 8 March 2018.
References and Notes
Rodrigue et al., 2013. https://people.hofstra.edu/geotrans/eng/ch1en/ch1menu.html
Harrison, 2013. By 1995, the GCR consisted of “metropolitan cities, secondary cities, towns and smaller service centres, well connected by road and rail
Sihlongonyane MF (2018) Chapter 2—The economic drivers of urban change in the Gauteng City-Region: past, present and future. In Cheruiyot K (ed), The changing space economy of City-Regions, Springer AG, Berlin
Gauteng Province Government, 30 January 2015, Transformation, Modernisation and Reindustrialisation of the gauteng city‐region: 2015‐2030
City of Johannesburg: 2012/16 Integrated Development Plan: 2013/14 review
Statistics South Africa, Census 2011
United Nations, Department of Economic and Social Affairs, Population Division (2014). World Urbanization Prospects: The 2014 Revision, Highlights (ST/ESA/SER.A/352)., p. 14
City of Johannesburg, the 2040 GDS
Conroy & Berke, 2004; Conroy & Gordon, 2004; Wild & Marshall, 1999
Chen Y, Hamilton A, Borning A (2010) Modelling & matching and value sensitive design: two methodologies for e-planning systems development
Marcinkowski, 2007
Silva CN (2010) The E-Planning Paradigm –Theory, Methods and Tools: An Overview. In Carlos Nunes Silva, 2010. Handbook of Research on E-Planning: ICTs for Urban Development and Monitoring (http://www.igi-global.com/book/handbook-research-planning/41793) (http://www.igi-global.com/viewtitlesample.aspx?id=43177&ptid=41793&t=the+e-planning+paradigm+%E2%80%93+theory%2c+methods+and+tools%3a+an+overview), dowloaded, 9 April 2017. The Use of Social Media for Urban Planning: Virtual Urban Landscapes Created Using Twitter. Data
Yigitcanlar T (2013). Planning online: a community-based interactive decision-making model (http://www.igi-global.com/viewtitlesample.aspx?id=43178&ptid=41793&t=planning+online%3a+a+community-based+interactive+decision-making+model) downloaded 9 April 2017
Mhangara P, Mudau N, Mboup G, Mwaniki D (2016) Transforming the City of Cape Town from an Apartheid City to an inclusive smart city. In Kumar V, Diyala B (eds), Smart economy in smart cities, Springer, Berlin
President Thabo Mbeki promoted Johannesburg as ‘an African city’
Estimates from the World Bank quoted by Honey 2004 cited by Mfaniseni F. Sihlongonyane, 2018
Hanival S, Maia J (2008) An overview of the performance of the South African economy since 1994. Pretoria: The Presidency, Government of South Africa
Landman 2004 cited by Sihlongonyane, 2018
Turok, 2012, cited by Sihlongonyane, 2018
See Mboup, 2017. Land the Hidden assets in African Cities, World Bank’s Land and Poverty Conference 2017
Turok (2012) Urbanisation and development in South Africa: economic imperatives, spatial distortions and strategic responses. IIED and UNFPA, Urbanization and Emerging Population Issues, Working Paper 8
Sihlongonyane, 2018
Blakely E, Snyder M (1999) Fortress America: Gated Communities in the United States (Washington DC, Brookings Institution)
Horn A (2010) Telling Stories—A history of growth management in the gauteng province (South Africa). Eur Spat Res Policy 17(2):41–54
Van Veuren EJ (2001) Transforming cultural villages in the spatial development initiatives of South Africa. S Afr Geogr J 83(2):137–148
Zack, 2004 cited by Sihlongonyane, 2018
The Gauteng Infrastructure Coordinating Council (GICC) is an intergovernmental GCR Institution tasked with the overall coordination and delivery of infrastructure. Chaired by the Premier, the council oversees and monitors the implementation of the GCR IIMP 2030 and ensures alignment with the Presidential Infrastructure Coordinating Commission (PICC) and Strategic Infrastructure Projects (SIPs)
As defined by Sassen, 2003 regarding New York and London as global cities
Simkins C (2010) Population growth, migration, economic growth and poverty in Gauteng since 1970. A Southern Africa Labour and Development Research Unit Working Paper No. 47. Cape Town: SALDRU, University of Cape Town
see also Kevin A. Bryan, Brian D. Minton, and Pierre-Daniel G. Sarte
Kevin A. Bryan, Brian D. Minton, and Pierre-Daniel G. Sarte, The Evolution of City Population Density in the United States. Economic Quarterly—Volume 93, Number 4—Fall 2007—Pages 341–360; (Chatterjee and Carlino 2001, Lucas and Rossi-Hansberg 2002)
Betraud et al
Demographia, 2016 edition
http://2013.legacy.gcro.unomena.net/spaceandmobility/populationdensity
Gauteng Parternship Fund, Gauteng Infrastructure Funding Summit Mega Projects; 2017
http://www.gauteng.gov.za/government/departments/office-of-the-premier/Documents/GSDF%202030.pdf
Hloni Masego (2017) Plan to build 800 k houses. The New Age, May 23, 2017
Mboup G (2013) Streets as Public Spaces and Drivers of Urban Prosperity, UN-Habitat’s publication, November 2013, Nairobi; Mboup G (2015). Streets as Public Spaces and Drivers of Sustainable, Inclusive and Prosperous Cities in Africa, World Bank’s Land and Poverty Conference, March 2015, Washington DC; Mboup G (2015) City Foundation—Key for Sustainable, Inclusive and Prosperous Cities, World Statistics Congress, July 2015 Rio de Janeiro, Brazil
van Ryneveld P (2010) Assessment of public transport in SA cities. Institute for Transportation and Development Policy, New York
Mboup G (2016) Smart infrastructure development will make smart cities. Promoting Smart Transport and ICT in Dakar, in Smart Economy in Smart Cities, Springer, September 2016
United Nations (2015b) Adoption of the Paris Agreement, Conference of the Parties, twenty first session, Paris, 13 November to 11 December 2015
UN-Habitat, 2013a, Op. Cit
GDPTRW 2002
GCR-IIMP
Heather Allen, 2012, Africa’s First Full Rapid Bus System: the Rea Vaya Bus System in Johannesburg, Republic of South Africa, Case study prepared for the UN-Habitat ‘s Global Report on Human Settlements 2013, Nairobi, Kenya
Republic of South Africa, 2010
Mboup G (2014) Urban quality of life—concepts and measurements. http://deliver2030.org/?wp_blog=urban-quality-of-life-concepts-and-measurements. Accessed 9 November 2017
UN-Habitat, 2012. Prosperity of Cities (Author: Mboup et al.)
Mboup G (2013) Streets as public spaces and drivers of urban prosperity, UN-Habitat
Gauteng Provincial Government, Republic of South Africa, GCR IIMP 2030
Gauteng Province Government, 30 January 2015, Transformation, Modernisation and Reindustrialisation of the Gauteng city region, 2015‐2030. The development of what became Gauteng province in 1994 bears unique industrial and economic features—an urban conurbation and clustering of cities and towns. This is what makes Gauteng a City Region, like the City states such as Singapore
City of Johannesburg, 2017–18 draft Integrated Development Plan Review
City of Johannesburg, Op. cit
Author information
Authors and Affiliations
Corresponding author
Editor information
Editors and Affiliations
Rights and permissions
Copyright information
© 2019 Springer Nature Singapore Pte Ltd.
About this chapter

Cite this chapter
Mudau, N., Mboup, G., Mhangara, P., Sihlongonyane, M. (2019). Towards a Smart Metropolitan Regional Development—Spatial and Economic Design Strategies: Johannesburg. In: Vinod Kumar, T. (eds) Smart Metropolitan Regional Development. Advances in 21st Century Human Settlements. Springer, Singapore. https://doi.org/10.1007/978-981-10-8588-8_16
Download citation
DOI: https://doi.org/10.1007/978-981-10-8588-8_16
Published:
Publisher Name: Springer, Singapore
Print ISBN: 978-981-10-8587-1
Online ISBN: 978-981-10-8588-8
eBook Packages: Earth and Environmental ScienceEarth and Environmental Science (R0)