
Abstract
Vibrational spectroscopies proved extremely useful to study a broad range of molecules, including their structures and interactions. Additional structural sensitivity is provided by polarized techniques measuring different absorption or scattering of left- and right circularly polarized light. The vibrational optical activity (VOA) methods include Raman optical activity (ROA) and vibrational circular dichroism (VCD). Interpretation of the spectra, however, is largely dependent on time-consuming quantum-chemical simulations limited by molecular size. To be able to handle at a reasonable precision large molecules, such as biologically relevant systems, we developed a simplified method of transfer of vibrational atomic properties from smaller fragments to the system of interest. The method found many successful applications in the past, including spectra of proteins and nucleic acids, and appears useful also in connection with the multi-level computational techniques in the foreseeable future. In this chapter, we discuss the theoretical whereabouts of the transfer method and its related computational algorithms and describe typical applications to large molecules.
Access provided by CONRICYT-eBooks. Download chapter PDF
Keywords
- Vibrational optical activity
- Raman optical activity
- Vibrational circular dichroism
- Harmonic approximation
- Density functional theory
- Spectral simulations
- Biopolymer structure
8.1 Fragment Methodology
8.1.1 Introduction
In the last decades, vibrational spectroscopy has continued to find new applications in basic and applied fields of chemistry, biology, and molecular physics. In addition to classical Raman scattering and infrared absorption (IR), new optical technologies gave rise to Raman optical activity (ROA), vibrational circular dichroism (VCD), THz-time domain (THz-TD), and multi-photon vibrational spectroscopy. However, interpretation of the spectra is not straightforward. Quite often, empirical assignment of spectral bands proved to be wrong, e.g., in ROA spectra of proteins and low-frequency vibrational spectra of condensed matter. Therefore, much more reliable quantum mechanical simulations are desirable, allowing one to interpret experimental observations more deeply and to model molecular properties in a more consistent way.
Typically, simulated spectra are compared to the experimental ones. Owing to the developments in the theory, software algorithms, their implementations, and hardware, it is nowadays possible to calculate fairly reliably vibrational spectra of small and medium molecules within a reasonable time. In general, problems start with bigger and flexible molecules, where accurate calculation is difficult because of high calculation cost in terms of processor time and computer memory.
Yet one has to acknowledge that some “direct” spectral simulations of large molecules already appeared, such as the ROA and Raman spectra of a β-domain of metallothionein composed of 31 amino acids. They have been calculated by using a density functional theory (DFT) aided by massively parallelized processors, the BP86/TZVP level of theory with the resolution of the identity density-fitting technique [1]. Still, many much larger proteins exist in nature or better precision in computation might be needed, not currently achievable by the parallelized CPU approach. Even small but flexible or solvated molecular systems, such as sugars and oligopeptides, require extensive calculations due to the need to consider many conformers and/or clusters of solvent and the solute [2,3,4,5,6,7,8]. In this context, we consider the fragment methodology as a useful tool to drastically cut down the computational demands and provide quantum-chemical solution with an accuracy acceptable for the purpose of vibrational spectroscopies, even though it may be one day replaced by more rigorous approaches.
One has to note that some similar fragment-like computational methodologies have been proposed by other researchers, e.g., the fragment molecular orbital method, [9] although they most often partition the electronic energy, not vibrational spectral properties, such as the force field.
8.1.2 Cartesian Coordinate-Based Transfer of Atomic Property Tensors
The transferability concept has been omnipresent in the history of vibrational spectroscopy. Force constants, atomic polarizabilities, etc., are supposed to be similar in similar chemical groups in different molecules. The Cartesian coordinate tensor transfer (CCT) [10] is thus only one of possible ways to overcome the difficulties of the spectral calculations of big molecules. Its advantage lies in the suitability to computer automatic or semi-automatic implementation, as the tensors are usually calculated in the Cartesian coordinates, and the transfer reduces to a rotation, eventually with a correction for origin dependence of electromagnetic tensors. The CCT method can be combined with any level of the electronic theory, although DFT calculations dominate so far, having been applied to VCD, IR, [11,12,13,14] and Raman spectra [4, 15,16,17,18].
In practical terms, an original “big” molecular system is cut into smaller fragments, which are made chemically feasible, e.g., missing bounds are capped by methyl groups (Fig. 8.1). Then their property tensors (force field, Raman, IR, ROA, and VCD intensity tensors) are calculated at the desired level of theory and transferred to the original molecule. Because the tensors comprise derivatives with respect to atomic coordinates, the transfer can proceed atom by atom for the first derivatives, or by atom pairs for the second derivatives, etc. Then, vibrational frequencies and intensities for the original molecule can be generated in the usual way.

Example of the fragmentation of a cyclic peptide (valinomycin), used in a CCT calculation of vibrational spectra. The fragments contain four amino acids; two of them always overlapped with those in the neighboring fragments. Reproduced with permission from Springer [37]
Of course, in order to faithfully model properties of atoms in the original molecules, the fragments should be enough large to eliminate the “end effects.” On the other hand, the fragment size is limited by available computer sources and calculation time. As an example, at this moment fragments with up to ~100 atoms give a reasonable balance between accuracy and computational cost, e.g., if the spectral calculations were done at the CAM-B3LYP/6-31++G** level with 4 parallelized processors for one fragment. The effects of fragment size and the size of their “overlapped” regions have been discussed in papers [15, 17, 19, 20].
A large overlap of the fragments eliminates the end effects, i.e., leads to more accurate simulations. Tensors for atoms in the overlapped regions thus may be taken from more fragments. They can be, for example, calculated as a weighted average, according to the position of the involved atoms with respect to the fragment mass center [10]. Typically, after a geometry optimization, terminal regions of the fragments deviate from the original structure more than the central part, which is just another reason to promote central parts of the fragments in the transfer.
The geometry optimization of the fragments is a tricky process. Ideally, we need to optimize the geometry completely, so that the atoms stay at their equilibrium positions. At the same time, we would like to keep fragment geometries similar to the original structure. The solution is obviously a partial optimization. This can be done with different means, for example, we can fix the torsional angles and similar coordinates not much involved in the vibrations of interest. A much more secure and in a final effect simpler method is the partial optimization in vibrational normal mode coordinates [21, 22]. Vibrational frequencies are directly addressed as the optimization criteria. For any type of optimization, one should be aware that if the fragment geometry significantly deviates from the original structure, the simulated spectra may be wrong.
Applying CCT to a particular class of compounds, e.g., peptides and proteins composed of a limited number of amino acids, it is possible to make a database of the fragments usable for molecules with similar structure [4, 15, 17]. This is also useful for coupling CCT with molecular dynamics. ROA spectra of a sugar aqueous solution [6] were calculated in this way, i.e., averaging over 10,000 conformers using a pre-calculated fragment database. For such systems, taking into account the flexibility of the molecule and its interactions with the solvent is crucial for reliable results.
8.1.3 Geometry Optimization in Vibrational Normal Mode Coordinates
The partial geometry optimization in the normal modes is a quite general method; within CCT it is applied to systems where we more or less know the molecular structure. For example, proteins often retain the (X-ray determined) crystal geometry also in solutions. A full structural optimization by energy minimization may often destroy it, because of the approximations used in the theoretical model. The situation is even worse for the fragments, where stabilizing contacts are lacking. As an another example, we may want to conserve the instantaneous cluster geometry obtained as an MD snapshot, such as fragments of DNA base pairs or water complexes [21]. Then, the partial optimization in normal mode coordinates can ensure minimal structural deviations while improving the geometry enough for the purpose of vibrational spectroscopy [21, 22].
The normal mode optimization (NMO) usually follows the following steps [21].
-
1.
Estimation of the Hessian (second derivatives of the energy with respect to nuclear coordinates) so that initial vibrational normal mode coordinates (“S-matrix”) can be defined. This may be done on a lower level of theory than in the other steps.
-
2.
Calculation of the Cartesian gradient of energy.
-
3.
Update of the Hessian and obtaining new S-matrix based on previous step.
-
4.
Transformation of the Cartesian to normal mode gradient. If the gradient is small enough, stop the optimization.
-
5.
Within the harmonic approximation, estimate the coordinate displacements for each normal mode (Fig. 8.2).
Fig. 8.2 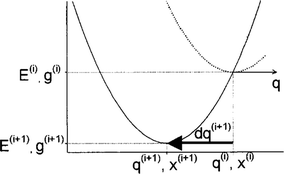
Normal mode optimization. At each point i, a quadratic energy surface is assumed so the next point i + 1 can be estimated as its minimum. Reproduced with permission from the American Institute of Physics [21]
-
6.
Transform the normal mode displacements to new Cartesian coordinates.
-
7.
Go to step 2.

We implemented the normal mode optimization in a Fortran program QGRAD, which deals with energies, gradients, and second derivatives, such as those from output of the Gaussian program. QGRAD takes care about Cartesian–normal mode transformations, diagonalization of the force filed, coordinate update, etc.
Fully relaxed NMO produces the lowest-energy geometry, and its performance is roughly comparable to Cartesian coordinate-based optimization, i.e., it is relatively slow if compared to internal coordinate-based algorithms. But in a constrained NMO some vibrational frequencies can be fixed, e.g., from 300i (imaginary, often treated as negative in computer codes) to 300 cm−1. In this way, the low-frequency vibrational modes defining the global structure (conformation, secondary/tertiary structure) are fixed. At the same time, vibrational modes important in most vibrational spectra are fully relaxed, which is the prerequisite for computation of the spectra within the harmonic approximation. The lower limit (300i cm−1) is introduced to relax very inconvenient geometry arrangements, on the “top” of a potential hill. An important advantage also is that the constrained NMO method avoids guessing which coordinates should be frozen; unlike for internal coordinate-based algorithms, for example, we do not have to define thousands of torsional angles in a protein to be fixed but can use the same criterion (such as 300i–300 cm−1) as for a small molecule. Similarly, in solvent–solute clusters definition of the internal coordinates would be very problematic.
Example of behavior of three optimization algorithms is given in Fig. 8.3, for a water cluster [21]. The NMO method exhibits some unwanted oscillation of energy but is clearly the most stable to lead the lowest-energy geometry.

Convergence of three types of constrained optimizations of a water cluster consisting of 10 water molecules. The constraints were fixed normal modes below 100 cm−1 in the normal mode method, fixed all torsion angles in the redundant internal coordinate method, and fixed torsion and bond angles in an user-defined internal coordinate method. Reproduced with permission from the American Institute of Physics [21]
8.2 Peptides and Proteins
8.2.1 Proteins
We can exemplify application of the CCT procedure on calculations of Raman and ROA spectra of bovine insulin. The protein contains 51 amino acids and has molecular weight of ~5800 [5]. Although the measurement was performed for water solutions, the spectral calculation was based on the X-ray structure. Nevertheless, the calculations did reproduce the main features of the experimental spectra (Fig. 8.4, top and bottom) and could be extended to MD snapshots by CCT (Fig. 8.4, middle spectra).

Calculated ROA (left) and Raman (right) spectra of bovine insulin based on the X-ray determined crystal structure (top), 10,000 MD snapshots (middle), and the experiment in water (bottom). The CCT calculation was based on the B3PW91/6-31++G**/CPCM (water) theory. Reproduced with permission from the American Chemical Society [5]
The computations enabled an approximate decomposition of peak intensities to contributions from molecular parts. This clarified that the amide I ROA couplet at ~1700 cm−1 comes from amide groups with only a slight coupling with motions of the α-carbon. Another interesting observation was that while for smaller molecules there are approximately equal contributions of the electric dipole (α), quadrupole (A), and magnetic dipole (Gʹ) polarizabilities to ROA intensity, in the protein α dominates. By other words, local chirality contributions become less important in the protein and the long-range order induces a new type electric dipole-based chirality.
ROA and Raman spectra can reflect not only the equilibrium structure but also the structural fluctuations and conformer equilibria in solution phase. This was clear after averaging of ROA and Raman spectra of 10,000 MD snapshots of monomer insulin in water (Fig. 8.4, middle). The sharp Raman peaks apparent in the crystal-based spectrum vanished, in particular in the low-frequency region below 800 cm−1. Similar smoothing effect is observed in the MD-averaged ROA spectrum, but here the spectral shapes in the higher frequency region are not conserved, which is not in favor to agreement with the experiment. This also shows that the ROA spectrum is more sensitive to protein fluctuation than the Raman, and that more accurate MD simulation, e.g., with ab initio potentials will be needed for more accurate results.
For larger globular proteins, it is important to automate the fragmentation process as much as possible; a manual definition of the fragments is not realistic anymore. This succeeded lately when Raman and ROA spectra of five globular proteins have been calculated at the B3PW91/6-31++G**/CPCM (water) level of theory, based on protein crystal structures [23]. The proteins consist of over 100 amino acids, bovine α-lactalbumin (M.W. 14178, 123 amino acids), monomer of concanavalin A (M.W. 26500, 235 amino acids), human serum albumin (M.W. 66437, 585 amino acids), hen egg-white lysozyme (M.W. 14307, 129 amino acids), and human lysozyme (M.W. 14700, 130 amino acids). The calculated spectral patterns were very close the experimental ones, both for Raman and ROA, which provided precious information about the relation of the spectral patterns to protein structure, cf. Figure 8.5 for bovine α-lactalbumin. Computations on dominantly α-helical human serum albumin (46% α-helix) and mostly anti-parallel β-sheet concanavalin A (46% β-sheet) reproduced the differences observed experimentally (Fig. 8.6). Even some very tiny spectral differences between hen egg- and human lysozymes having very similar structure appeared both in experiment and calculation. Analysis of the calculations showed that ROA spectra of proteins are dominated by the signal from peptide backbone, whereas Raman spectra can be roughly approximated by a sum of individual amino acid contributions. The automatic fragmentation and CCT methods provided an unprecedented precision in simulated frequencies and intensities of five globular proteins and enabled one to relate fine spectral patterns to local and higher-order structural features.

Comparisons of simulated (black) and experimental (red) ROA (top) and Raman (bottom) spectra of bovine α-lactalbumin. The simulation was based on CCT, the B3PW91/6-31++G**/CPCM (water) level of theory, and crystal structure of the protein. Reproduced with permission from the American Chemical Society [23]

Comparisons of a β-sheet-dominant protein (concanavalin A) and an α-helix-dominant protein (human serum albumin). Calculated spectra with CCT-based DFT at B3PW91/6-31++G**/CPCM (water) fairly reproduced the specific spectral patterns. Reproduced with permission from the American Chemical Society [23]
At present, it is not clear what we would get by direct DFT computations on the whole proteins; these are not possible so far. Nevertheless, the results suggest that the error of the CCT method [24] is not the limiting factor in the simulations, or at least that it is comparable with the error of the underlying DFT approximation and uncertainties stemming from the geometry model including incomplete treatment of the protein dynamics. Also, one has to bear in mind the limits of the harmonic approximation; CCT to anharmonic constants can be applied as well [25] but has not been extensively explored for molecules of this size yet.
Structure and interactions of protein fibrils are important in relation to protein amyloids accompanying some neurodegenerative diseases. Layered β-sheet structures consisting of assembled five-stranded Ala9 peptides were studied using CCT-based VCD, IR, and Raman spectral simulations, changing the number of layers, inter-strand and stacking arrangements [26]. CCT method was also applied to VCD and IR spectra of highly-ordered β-sheet-forming peptide, polyglutamic acid, in a combination with MD simulations [27]. It was confirmed that not only backbone amide chromophores but also the side chains (in particular the COOH groups) can produce distinct VCD spectral pattern.
8.2.2 Conformer Analysis of Peptides
For smaller peptides, the ROA/VCD spectroscopy coupled with computations can reveal their solution conformation. For example, conformer ratios can be estimated when the experimental spectra are compared with the simulated ones of all conformer species [1,2,3, 15,16,17,18, 28,29,30,31,32,33,34,35]. This is quite straightforward, as the measured spectrum (S) is always a sum of individual conformer subspectra S i ,
Note that, this may not be the case for NMR, where a fast conformational exchange often smears the individual signals to an average shift. Typically, we minimize the integrated square deviation between the experiments and the fit in some frequency intervals \(\omega_{1} \ldots \omega_{2}\), \(\int_{{\omega_{1} }}^{{\omega_{2} }} {\left( {S - \sum\nolimits_{i = 1}^{N} {c_{i} S_{i} } } \right)^{2} d\omega \to \hbox{min} }\). Such decomposition is always possible algebraically. In practice, one has to ensure a good physical meaning, i.e., that the coefficients sum up to one, \(\sum\nolimits_{i = 1}^{N} {c_{i} = 1}\), they are all positive, N is not too large, false hits due to experimental noise are not produced, etc. Then, at least in some cases, the accuracy of such spectral decomposition is comparable to the more established NMR analysis [28].
The ROA spectral decomposition has also been demonstrated for conformational analysis of a cyclic twelve-membered peptide, valinomycin [15]. Valinomycin is an antibiotic ionophore and can capture selectively the potassium ion. The peptide makes a cavity for the metal, i.e., changes conformation during the binding. A spectral decomposition into calculated spectra of four conformers of free valinomycin (Fig. 8.7) revealed dominant backbone structures, which are quickly dynamically interconverting into each other in organic solvents. In 1, 4-dioxane, the “asymmetric bracelet” conformer was found to govern, and the “symmetric bracelet” was just minor one, while only two peptide-torsional angles were different from each other by ~30°. Earlier, NMR experiments could only detect the symmetric conformer, but there is no contradiction to the ROA results; NMR just cannot distinguish the fast conformational equilibria. Typical reported relaxation times ranged from 20 to 2 ns; the slowest rate constant corresponds to few μs [36]. In methanol, ROA analysis combined with MD simulations mostly predicted the “propeller” conformer, with a fast bending motion of the side chains.

Most probable conformations of an antibiotic peptide, valinomycin. Reproduced with permission from Springer [37]
The ROA analysis based on the calculations can capture the side chain conformations as well. The potassium valinomycin complex can generate 6579 distinct conformers due to the rotation of the 9 isopropyl groups [17]. Two most stable conformers in methanol were determined by the combination of the ROA spectral decompositions and the energy calculations. The second stable conformer possesses only one torsional angle different from the most stable one. This high sensitivity of ROA would come from the relatively long-range interaction mediated by the ROA polarizability derivatives, as also observed in the other case [16]. The couplings of vibrations in neighboring residue strongly influence ROA intensities.
Yet further improvements of the accuracy of ROA experiment and calculations are desirable, enabling more reliable conformer analyses. To the best of our knowledge, there is no other analytical method as powerful as ROA in providing conformer populations in very fast structural equilibria.
8.3 Nucleic Acid
The CCT methodology has been applied to the simulation of IR and VCD spectra of large nucleic acid as well [12, 13, 38,39,40]. Experimental VCD and IR spectra of a model double-stranded DNA helix, poly(rA)-poly(rU) complex were computed using (rA)8-(rU)8 as a model (Fig. 8.8) [40]. Both the VCD/IR intensities stemming from the nucleobases, in the wavenumber region higher than 1500 cm−1, and those from the sugar-phosphate parts, within 1070–1120 cm−1, were reasonably well reproduced. Similarly, model helical RNA poly(rA) structures, triple-stranded DNA, and poly(rU)-poly(rA)-poly(rU) complex were also simulated with shorter model molecules and good agreements with the experimental spectra brought about better understanding of the link between the structure and the spectra and behavior of these important molecules.

CCT-based VCD (top) and IR (lower–middle) spectra of the double-stranded octamer (rA)8-(rU)8 with the experimental spectra of poly(rA)-poly(rU). Reproduced with permission from the American Chemical Society [40]
Another native conformation of DNA, four-stranded DNA (quadruplex), was characterized by the CCT-based spectroscopic analysis, too [38]. Although vibrational spectroscopic methods have been used to investigate nucleic acid structure, association of particular spectral features with quadruplex structure was rather speculative. This could be done more reliably for experimental spectra of model quadruplex systems, d(G)8 and deoxyguanosine-5’-monophosphate (5’-dGMP). They were compared to the calculated spectra and unambiguously assigned to the quadruplex DNA structure (Fig. 8.9). The VCD spectral pattern in a region from 1500 to 1700 cm−1 is especially sensitive to the DNA backbone structural motif. The calculated pattern for the quadruplex very well agreed with the experiment and other conformers gave much worse agreement. It was concluded that the MD simulations provided realistic geometries and conformer-averaged spectra for multiple snapshots of thermally moving DNA molecules.

IR (left) and VCD (right) spectra of d(G)8 in experiment (bottom) and CCT-based simulations of single-strand (top), duplex (upper–middle), quadruplex (lower–middle). The calculated spectra were MD-averaged and the lowest-energy conformers are shown for each model. Reproduced with permission from the American Chemical Society [38]
8.4 Crystals
8.4.1 Polymorphism of Small Molecular Crystal
Identification of polymorphism in molecular crystals is important for pharmaceutical industry, because the crystal state of many drugs affects physical and biological properties, such as the speed of dissolution in human body. Raman spectroscopy can be useful to monitor the polymorphism which was demonstrated for crystal forms of methacrylamide, Piracetam, and 2-thiobarbituric acid [41]. The case of methacrylamide is shown in Fig. 8.10. Spectra of both crystal forms could be well reproduced by the theory; the type of polymorphism could thus be determined by comparing the experiments and the simulations. The CCT method had to consider all important intermolecular interaction and the crystal symmetry, which was achieved by a careful selection of molecular fragments.

Calculated (top, plane wave) and experimental (bottom, NIR) Raman spectra of the two methacrylamide crystal forms. Reproduced with permission from the American Chemical Society [41]
8.4.2 Low-Frequency Vibrational Spectra of Crystalline Polymers
Polymeric materials continue to govern material industry for the second century. Vibrational spectra often provide useful information about intermolecular forces related to polymer stability, flexibility, biodegradability, etc. But simulations of the low-frequency polymer bands are difficult because of the size of the systems and the need to accurately account for the intermolecular interactions. On the other hand, low-frequency vibrations become experimentally easily accessible owing to the Raman technology development, such as availability of narrow filters enabling to detect light very close (~10 cm−1) to the excitation laser line.
Also here, the CCT method has been applied. Low-frequency vibrational spectra of crystalline polyesters, poly-(R)-3-hydroxybutyrate (PHB) [42] and polyglycolide (PGA, to be published) were simulated and compared to the experiment. The calculations were based on the crystal structure. Unlike for the peptides and proteins, the NMO frequency limit had to be set rather low, to 20 or 40 cm−1. This produced a reasonable agreement between the calculations and experiments, both for the Raman and FIR (THz-TD) spectra, in terms of spectral shapes, frequencies, intensities, and polarization directions.
For example, the low-frequency bands (below ~300 cm−1) were shown to be delocalized and affected by intermolecular interactions between the polymer chains. To include the intermolecular interactions, special “intermolecular” fragments were created including atoms from two neighboring chains, which resulted to a good agreement with the observed Raman and FIR spectra (Fig. 8.11).

Calculated (red lines) and experimental (black lines) Raman and FIR spectra of crystalline PHB. Weak inter-chain H-bond interactions responsible for the 82 cm−1 band are indicated at the right. Reproduced with permission from the American Chemical Society [42]
In the PHB polymer, the Raman-active band at 79 cm−1 was assigned to an intermolecular vibrational mode of the out-of-plane C = O + CH3 vibration. Polarization of a corresponding FIR band at ~82 cm−1, observed as perpendicular to the helical direction of PHB, was reproduced as well, but only when the intermolecular fragments were included. This shows that this polarized band originates from the intermolecular interactions.
8.5 Conclusions
We have shown that the fragment methodology represents a relatively simple means to extend precise ab initio computation of vibrational molecular properties to fairly large molecules. The “CCT” algorithm has already found many successful applications in simulations of vibrational spectra of peptides, proteins, DNA, and crystalline polymers. Currently, such systems are not accessible by more conventional computational procedures, even with massively parallelized codes. An important advantage of the CCT approach is its flexibility and the possibility to combine computational methods, such as molecular dynamics and density functional theory. The technique can also be used to study flexible and polar molecules. Typically, it reduces computational time required during averaging of many conformers or solvent-solute clusters. We see potential of the CCT method also for the future, when improved algorithms provide more accurate simulated spectra, for example via combination of CCT with path integral or ab initio molecular dynamics, inclusion of anharmonic force field corrections, calculations accelerated by parallelization, or usage of more precise electronic theories.
References
S. Luber, M. Reiher, Theoretical Raman optical activity study of the β domain of rat metallothionein. J. Phys. Chem. B 114, 1057–1063 (2010)
J. Kapitán, V. Baumruk, V. Kopecký Jr., P. Bouř, Conformational flexibility of L-Alanine Zwitterion determines shapes of Raman and Raman optical activity spectral bands. J. Phys. Chem. A 110, 4689–4696 (2006)
J. Kapitán, V. Baumruk, V. Kopecký Jr., R. Pohl, P. Bouř, Proline Zwitterion dynamics in solution, glass and crystalline state. J. Am. Chem. Soc. 128(41), 13451–13462 (2006)
J. Kaminský, J. Kapitán, V. Baumruk, L. Bednárová, P. Bouř, Interpretation of Raman and Raman optical activity spectra of a flexible sugar derivative, the gluconic acid anion. J. Phys. Chem. A 113, 3594–3601 (2009)
S. Yamamoto, J. Kaminský, P. Bouř, Structure and vibrational motion of insulin from Raman optical activity spectra. Anal. Chem. 84, 2440–2451 (2012)
J. Kaminský, J. Šebek, P. Bouř, Molecular dynamics with restrictions derived from optical spectra. J. Comput. Chem. 30, 983–991 (2009)
K.H. Hopmann, K. Ruud, M. Pecul, M. Dracinsky, P. Bouř, Explicit versus implicit solvent modeling of Raman optical activity spectra. J. Phys. Chem. B 115, 4128–4137 (2011)
J.R. Cheeseman, M.S. Shaik, P.L.A. Popelier, E.W. Blanch, Calculation of Raman optical activity spectra of methyl-β-D-glucose incorporating a full molecular dynamics simulation of hydration effects. J. Am. Chem. Soc. 133, 4991–4997 (2011)
D.G. Fedorov, T. Nagata, K. Kitaura, Exploring chemistry with the fragment molecular orbital method. Phys. Chem. Chem. Phys. 14, 7562–7577 (2012)
P. Bouř, J. Sopková, L. Bednárová, P. Maloň, T.A. Keiderling, Transfer of molecular property tensors in Cartesian coordinates: a new algorithm for simulation of vibrational spectra. J. Comput. Chem. 18, 646–659 (1997)
V. Andrushchenko, P. Bouř, Circular dichroism enhancement in large DNA aggregates simulated by a generalized oscillator model. J. Comput. Chem. 29, 2693–2703 (2008)
V. Andrushchenko, P. Bouř, DNA oligonucleotide-cis-platin binding: ab initio interpretation of the vibrational spectra. J. Phys. Chem. A 111, 9714–9723 (2007)
V. Andrushchenko, H. Wieser, P. Bouř, B-Z conformational transition of DNA monitored by vibrational circular dichroism. Ab initio interpretation of the experiment. J. Phys. Chem. B 106, 12623–12634 (2002)
J. Kubelka, T.A. Keiderling, Differentiation of β-sheet forming structures: ab initio based simulations of IR absorption and vibrational CD for model peptide and protein β-sheets. J. Am. Chem. Soc. 123, 12048–12058 (2001)
S. Yamamoto, H. Watarai, P. Bouř, Monitoring the backbone conformation of valinomycin by Raman optical activity. Chem. Phys. Chem. 12, 1509–1518 (2011)
J. Hudecová, J. Kapitán, V. Baumruk, R.P. Hammer, T.A. Keiderling, P. Bouř, Side chain and flexibility contributions to the Raman optical activity spectra of a model cyclic hexapeptide. J. Phys. Chem. A 114, 7642–7651 (2010)
S. Yamamoto, M. Straka, H. Watarai, P. Bouř, Formation and structure of the potassium complex of valinomycin in solution studied by Raman optical activity spectroscopy. Phys. Chem. Chem. Phys. 12, 11021–11032 (2010)
J. Kapitán, F. Zhu, L. Hecht, J. Gardiner, D. Seebach, L.D. Barron, Solution structures of β peptides from Raman optical activity. Angew. Chem. 120, 6492–6494 (2008)
S. Yamamoto, P. Bouř, On the limited precision of transfer of molecular optical activity tensors. Collect. Czech. Chem. Commun. 76(5), 567–583 (2011)
N.S. Bieler, M.P. Haag, C.R. Jacob, M. Reiher, Analysis of the Cartesian tensor transfer method for calculating vibrational spectra of polypeptides. J. Chem. Theory Comput. 7, 1867–1881 (2011)
P. Bouř, T.A. Keiderling, Partial optimization of molecular geometry in normal coordinates and use as a tool for simulation of vibrational spectra. J. Chem. Phys. 117, 4126–4132 (2002)
P. Bouř, Convergence properties of the normal mode optimization and its combination with molecular geometry constraints. Collect. Czech. Chem. Commun. 70, 1315–1340 (2005)
J. Kessler, J. Kapitán, P. Bouř, First-principles predictions of vibrational Raman optical activity of globular proteins. J. Phys. Chem. Lett. 6, 3314–3319 (2015)
S. Yamamoto, X. Li, K. Ruud, P. Bouř, Transferability of various molecular property tensors in vibrational spectroscopy. J. Chem. Theory Comput. 8, 977–985 (2012)
P. Bouř, V. Parchaňský, Transferability of anharmonic force fields in simulations of molecular vibrations. J. Chem. Phys. 133, 044117 (2010)
W.R.W. Welch, J. Kubelka, T.A. Keiderling, Infrared, vibrational circular dichroism, and Raman spectral simulations for β‑sheet structures with various isotopic labels interstrand, and stacking arrangements using density functional theory. J. Phys. Chem. B 117, 10343–10358 (2013)
J. Kessler, T.A. Keiderling, P. Bouř, Arrangement of fibril side chains studied by molecular dynamics and simulated infrared and vibrational circular dichroism spectra. J. Phys. Chem. B 118, 6937–6945 (2014)
M. Buděšínský, P. Daněček, L. Bednárová, J. Kapitán, V. Baumruk, P. Bouř, Comparison of quantitative conformer analyses by nuclear magnetic resonance and Raman optical activity spectra for model dipeptides. J. Phys. Chem. A 112, 8633–8640 (2008)
M. Buděšínský, J. Šebestík, L. Bednárová, V. Baumruk, M. Šafařík, P. Bouř, Conformational properties of the Pro-Gly motif in the D-Ala-L-Pro-Gly-D-Ala model peptide explored by a statistical analysis of the NMR, Raman, and Raman optical activity spectra. J. Org. Chem. 73, 1481–1489 (2008)
J. Kapitán, V. Baumruk, V. Kopecký Jr., P. Bouř, Demonstration of the ring conformation in polyproline by the Raman optical activity. J. Am. Chem. Soc. 128, 2438–2443 (2006)
C.R. Jacob, S. Luber, M. Reiher, Calculated Raman optical activity signatures of tryptophan side chains. Chem. Phys. Chem. 9, 2177–2188 (2008)
P. Bouř, J. Kapitán, V. Baumruk, Simulation of the Raman optical activity of L-Alanyl-L-Alanine. J. Phys. Chem. A 105, 6362–6368 (2001)
C.R. Jacob, S. Luber, M. Reiher, Understanding the signatures of secondary-structure elements in proteins with Raman optical activity spectroscopy. Chem. Eur. J. 15, 13491–13508 (2009)
F. Zhu, J. Kapitán, G.E. Tranter, P.D.A. Pudney, N.W. Isaacs, L. Hecht, L.D. Barron, Residual structure in disordered peptides and unfolded proteins from multivariate analysis and ab initio simulation of Raman optical activity data. Proteins 70, 823–833 (2008)
P. Bouř, V. Sychrovský, P. Maloň, J. Hanzlíková, V. Baumruk, J. Pospíšek, M. Buděšínský, Conformation of the dipeptide cyclo (L-Pro-L-Pro) monitored by the nuclear magnetic resonance and Raman optical activity spectra. Experimental and ab initio computational study. J. Phys. Chem. A 106, 7321–7327 (2002)
E. Grell, T. Funck, Dynamic properties and membrane activity of ion specific antibiotics. J. Supramol. Struct. 1, 307–335 (1973)
S. Yamamoto, Conformational analyses of peptides and proteins by vibrational Raman optical activity. Anal. Bioanal. Chem. 403, 2203–2212 (2012)
V. Andrushchenko, D. Tsankov, M. Krasteva, H. Wieser, P. Bouř, Spectroscopic detection of DNA quadruplexes by vibrational circular dichroism. J. Am. Chem. Soc. 133, 15055–15064 (2011)
V. Andrushchenko, P. Bouř, Applications of the Cartesian coordinate tensor transfer technique in the simulations of vibrational circular dichroism spectra of oligonucleotides. Chirality 22, E96–E114 (2010)
V. Andrushchenko, H. Wieser, P. Bouř, RNA structural forms studied by vibrational circular dichroism: ab initio interpretation of the spectra. J. Phys. Chem. B 108, 3899–3911 (2004)
M. Dračínský, E. Procházková, J. Kessler, J. Šebestík, P. Matějka, P. Bouř, Resolution of organic polymorphic crystals by raman spectroscopy. J. Phys. Chem. B 117, 7297–7307 (2013)
S. Yamamoto, Y. Morisawa, H. Sato, H. Hoshina, Y. Ozaki, Quantum mechanical interpretation of intermolecular vibrational modes of crystalline poly-(r)-3-hydroxybutyrate observed in low-frequency Raman and terahertz spectra. J. Phys. Chem. B 117, 2180–2187 (2013)
Acknowledgements
The work was supported by the Grant Agency of the Czech Republic (15-09072S and 16-05935S) to P.B. and JSPS KAKENHI (JP26708017 and JP26246037) to S.Y.
Author information
Authors and Affiliations
Corresponding author
Editor information
Editors and Affiliations
Rights and permissions
Copyright information
© 2018 Springer Nature Singapore Pte Ltd.
About this chapter

Cite this chapter
Yamamoto, S., Bouř, P. (2018). Calculation of Vibrational Spectra of Large Molecules from Their Fragments. In: Wójcik, M., Nakatsuji, H., Kirtman, B., Ozaki, Y. (eds) Frontiers of Quantum Chemistry. Springer, Singapore. https://doi.org/10.1007/978-981-10-5651-2_8
Download citation
DOI: https://doi.org/10.1007/978-981-10-5651-2_8
Published:
Publisher Name: Springer, Singapore
Print ISBN: 978-981-10-5650-5
Online ISBN: 978-981-10-5651-2
eBook Packages: Chemistry and Materials ScienceChemistry and Material Science (R0)