
Abstract
In this chapter, a brief overview of fundamentals in mass spectrometry and some applications are presented. The main concepts in ionization techniques, classical techniques and ambient mass spectrometry are followed by an overview on analyzers.
Particular attention has been paid to high resolution mass spectrometry and accurate mass measurements, highly debating topics in modern mass spectrometry, with some examples and applications. Finally tandem mass spectrometry, collision-induced dissociations (CID), interactions of ions with electrons (ECD, ETD), photons (IRMPD) and with surfaces (SID) are also briefly presented.
Access provided by CONRICYT-eBooks. Download conference paper PDF
5.1 Mass Spectrometry: An Overview
Mass spectrometry (MS) is an important and very powerful methodology for identifying and structurally elucidating unknowns, and for determining their quantity. It is characterized by high specificity, selectivity, sensitivity and speed. Thus it is possible to carry out analyses on compounds at trace level on food, environmental samples, in chemistry, clinics, biosciences, proteomics, metabolomics, homeland security, and in many other branches of science [1,2,3,4,5].
Mass spectrometry is based on production of ions in the gas phase, occurring in the ion source, on their separation according to their mass-to-charge (m/z) ratios, done by the analyzer, and finally on their detection (Fig. 5.1).

The diagram of a mass spectrometer
Modern mass spectrometry offers different tools for obtaining a plethora of information on the sample [5]. Thus it is possible to determine the molecular weight of an analyte; its separation from isobaric species and its chemical formula through high resolution mass spectrometry (HRMS) and accurate mass measurements; its molecular structure and structural information by tandem mass spectrometry, inducing ion decompositions through collision induced dissociations (CID), interactions with electrons (electron capture dissociation (ECD) [6], electron transfer dissociations (ETD) [7], interactions with photons (infrared multiphoton dissociation (IRMPD), ion spectroscopy) or with surface (surface induced dissociations (SID)) [8], mapping the distribution of an analyte on a surface (tissue, leaf, etc.) by mass spectrometry imaging; obtaining information on shape and conformation by using ion mobility mass spectrometry.
5.2 Ionization Techniques
Mass spectrometry can study wide classes of molecules, ranging from small volatile up to polar and very large molecules. As they have different properties, e.g. molecular weight, volatility, polarity, etc., all of them cannot be ionized by just one ionization technique, but a wide range of ionization techniques are nowadays available.
There are classical techniques which ionize volatile molecules in the gas phase (electron and chemical ionization (EI, CI)), desorption techniques (such as matrix assisted laser desorption (MALDI), secondary ion mass spectrometry (SIMS), …) and spray ionization techniques in which sample solutions are sprayed forming small droplets and then ions (electrospray (ESI), atmospheric pressure chemical ionization (APCI) [9], atmospheric pressure photoionization (APPI), …..) [10].
There is a quite new branch of mass spectrometry, called ambient mass spectrometry consisting of direct sampling and ionization of the analytes at ambient conditions with no or minimal effort for sample preparation. Many ionization techniques, and their number is continuously increasing, belong to this group. Some examples are: desorption electrospray ionization (DESI), direct analysis in real time (DART), extractive electrospray ionization (EESI), low temperature plasma probe (LTP), paper spray ionization (PSI), and many others [11,12,13,14,15,16,17,18].
While electron ionization and chemical ionization occur under vacuum, most of all the other ionization techniques operate at atmospheric pressure. In the case of MALDI, the ionization generally occurs under vacuum, but it can be also at atmospheric pressure (atmospheric pressure MALDI (AP-MALDI)) [1,2,3,4,5].
Dependently on the technique used, ionization can occur through one electron removal from the molecule in the gas phase, thus forming a radical cation (the molecular ion), as it occurs in electron ionization, but in most of cases ionization consists of protonation or deprotonation reactions, thus forming even-electron ions [M+H]+or [M-H]–. In the case of electrospray, if the molecule is sufficiently large, multiply charged ions [M+nH]n+ or [M-nH]n– are formed. Adducts formation can also occur yielding species [M+Na]+, [M+K]+, [M+Cl]–, [M+HCOO]– [1,2,3,4,5].
Finally, ionization techniques can be grouped into hard and soft. In the case of hard ionizations, mostly represented by electron ionization, a large amount of energy is deposited onto the molecule, yielding a molecular ion with a high energy excess. This causes its abundant fragmentation and, as a consequence, lot of information on structural characterization of the analyte. In the case of soft ionizations, none or very few fragment ions are formed, so no any structural information can be obtained and tandem mass spectrometry is required for producing fragmentation in the analyzer region [1,2,3,4,5].
5.3 Analyzers
Once the ions are formed in the ion source, they are accelerated towards the mass analyzer where their separation according to their m/z ratios occurs. To fulfil their aim, analyzers use forces which influence ion movement, and in particular (i) a magnetic field; (ii) an electric field; (iii) a radiofrequency. An analyzer can use just one or a combination of two or three of them [1,2,3,4,5].
Analyzers can be divided into two main groups: those based on ion separation in space, sometimes also referred to as beam-type analyzers, and those separating ions in time (Table 5.1).
Double sector instruments, having a magnetic and an electric field, quadrupole and time of flight belong to the first group. In this case ions travel for some centimeters (roughly 30–100 cm in quadrupole) or meters (roughly 2–5 m in sectors or 2–17 m in ToF) and along the way they are submitted to one or two of the forces described above.
Analyzers separating ions in time are trapping devices: ion traps (linear or tridimensional ion trap), Orbitrap, and Fourier Transform Ion Cyclotron Resonance (FT-ICR). In these cases the ion path may be from cm to meters long, depending on trapping time [1,2,3,4,5].
Analyzers can make a scan (sectors, quadrupole, ion trap), measure a flight time (ToF) or measure a frequency (frequency of axial oscillations (Orbitrap), cyclotron frequency (FT-ICR)). In the last case, the Fourier transform mathematical operations are applied for generating mass spectra from time domain transients produced by the image current.
Main topics concerning analyzers are resolving power and resolution, accurate mass measurements and tandem mass spectrometry.
5.4 Resolving Power, Resolution and Accurate Mass Measurements
One of the most important performances of analyzers is their resolving power, i.e. the ability to distinguish between ions differing in the quotient mass/charge by a small increment [19]. A given resolving power yields a given resolution in the mass spectrum. Resolving power and resolution are the most debated terms in mass spectrometry.
Two main definitions can be used for resolution (Fig. 5.2):
-
(a)
Valley definition: it considers two peaks of equal height in a mass spectrum at masses m and (m + Δm) be separated by a valley (generally defined at 5–10%) which, at its lowest point, is at x% of the height of either peaks;
-
(b)
Peak width definition: for a single peak made up of singly charged ions at mass m in a mass spectrum, the resolution may be expressed as m/Δm, where Δm is the width of the peak at a height which is a specified fraction of the maximum peak height. Generally the 50% peak height is considered, so a resolution at full width at half maximum (FWHM) is defined.

Definitions of resolution: valley definition (left) and full width half maximum (FWHM, right)
From above it results that resolution and peak width are strictly related each to the other. Depending on the analyzer used, resolution or peak width can be constant or they vary in the scan. In particular:
-
1.
Quadrupole and ion trap: the peak width is constant over all the mass spectrum. Thus if FWHM is 0.5u: at m/z 40 the resolution will be 40/0.5=80, but at m/z 1000 the resolution will be 1000/0.5=2000. In other words, resolution increases by increasing the m/z value. In any case, quadrupole and ion trap do not have high resolving power.
-
2.
TOF and sector analyzers: the resolution remains constant over all the mass spectrum, i.e. the peak width increases by increasing the m/z value. Thus if Res FWHM is 20,000: at m/z 40 the peak width at 50% of height will be 40/20,000=0.002 u, but at m/z 4000 FWHM will be 4,000/20,000 = 0.2u. In other words, peaks are wider by increasing the m/z value. Modern TOF with reflectron have resolving powers around 30,000–40,000 while for sector instruments resolving power is about 10,000–15,000.
-
3.
FTICR: at constant detection time, the resolving power is inversely proportional to m/z. Thus if resolution is 1×10⁶ at m/z 100, it will be 1×10⁵ at m/z 1000.
-
4.
Orbitrap: at constant detection time, the resolving power is inversely proportional to the square root of m/z. Thus if resolution is 100,000 at m/z 100, at m/z 1000 it will be 100,000 × (100/1000)1/2=31,646.
Resolution is strictly related to sensibility (i), specificity (ii) and scan speed (iii).
-
(i)
Resolution vs sensitivity.
In general an increase of resolution causes a drastic decrease of sensitivity. So in sector instruments, increasing resolution involves a narrower ion spread which is obtained by closing the slits on the ion path. Passing from low resolution to resolution 5000 (at 10% valley) causes a decrease of sensitivity of about 50–70%. A similar situation occurs in ToF analyzers, passing from linear mode to reflectron mode, in Orbitrap and FT-ICR analyzers. A drastic decrease of sensitivity can have negative effects on accurate mass measurements (see below).
-
(ii)
Resolution vs specificity.
An increase of resolution increases specificity by distinguishing and separating isobaric ions, i.e. ions having the same nominal mass, but different chemical compositions. As an example CO, N2 and C2H4 have the same nominal mass, 28 Da, but different chemical compositions. So a high resolution regime allows one to eliminating species interfering with the analytes of interest (Fig. 5.3).
Fig. 5.3 
Mass spectra recorded at different resolutions: mass spectrum of a mixture of three isobaric species [C19H7N]+, [C20H9]+, [C13H19N3O2]+ obtained at low resolution (black line) and at resolving power 50,000 (grey line). It is noteworthy that at low resolution the three isobaric peaks are completely unresolved

-
(iii)
Resolution vs scan speed.
In general, an increase of resolution causes longer scan rates or longer detection times in FT analyzers. This is a very important topic especially when the mass spectrometer is coupled to a chromatographic system. In fact a good reproducibility of a chromatographic peak profile requires making at least 12–15 scans (Fig. 5.4). If the peak width is 5 sec, the cycle time cannot be longer than 0.4 sec, i.e. ~3 Hz. Thus in some cases, resolution must be reduced to a value in agreement with peak width and scan rate.
Fig 5.4 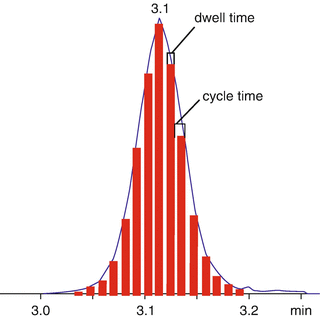
Chromatographic peak profile and number of scans

High resolution is a mandatory requirement for accurate mass measurements, i.e. measuring the m/z value with significance on the fourth decimal digit [20]. So when working in low resolution regime, calculations on masses can be done by using the nominal mass, i.e. the mass of the ion calculated using the mass of the most abundant isotope of each element rounded to the nearest integer value, e.g. H=1, C=12, N=14, O=16, etc. But when working in high resolution with accurate mass measurements, the monoisotopic mass, i.e. the mass of the ion calculated using the mass of the most abundant isotope of each element, has to be used. As an example, monoisotopic masses for hydrogen, carbon and nitrogen are 1.007825, 12.000000 and 14.00307, respectively.
By using the accurate mass value it is possible to obtain information on the chemical formula of the ion [21]. This is done via software starting from an input list, defined by the operator, of potential elements present in the ion with their ranges, i.e. C 5÷10, H 5÷30, N 1÷5, O 0÷10, etc. Starting from this list and from the accurate mass value, the software calculates potential chemical formulae. For each, it determines its own exact mass (the calculated mass considering the monoisotopic mass of a single isotope of each atom) which is compared to the accurate mass. In general, higher is the agreement between the two values, higher is the probability that the proposed chemical formula corresponds to the real formula of the ion. This is estimated by an error which can be expressed as mmu ((accurate mass – exact mass)/m/z) or ppm (((accurate mass – exact mass)/m/z) × 10 6 ) [20].
A reliable accurate mass value requires a correct mass calibration of the mass spectrometer, consisting of fitting the observed mass measurements to the exact masses of two or more different ions. Mass calibration can be external, i.e. reference masses from a mass spectrum of another analyte acquired under similar conditions, or internal, i.e. the reference masses are for ions of known elemental composition in the same mass spectrum as the analyte. Internal calibration is typically at least twice as accurate as external calibration.
Evaluation of repeatability and reproducibility of accurate mass measurements should be also carried out.
For an unambiguous identification, by increasing the m/z value, a higher mass accuracy is required. In fact increasing mass-to-charge ratios the number of potential formulae dramatically increases making identification more and more difficult.
Thus for the characterization of ions containing only C, H, O, N, with compositions C0÷100, H3÷74, O0÷4 and N0÷4, at m/z 118 only an error not exceeding 34 ppm is required for an unambiguous identification, but at m/z 750 an error better than 0.018 ppm is required to eliminate “all extraneous possibilities” [21]. This is graphically shown in Fig. 5.5. As an example, for ions containing only C, H, N, O, at m/z 1000 and mass accuracy of 5 ppm, about 150 chemical formulae can be proposed, at m/z 600 the number is reduced to about 30 and at m/z 300 the number of potential formulae is reduced to a very few [22].

The relationship between mass accuracy and m/z values on the number of potential elemental formulae [22]
Some constraints can be set up for reducing ambiguity and the number of potential chemical formulae. One is represented by the double bond/ring equivalents (RDB) defined in Eq. 5.1
where Ni is the number of atoms of element i, and Vi is the valence of atom i. In addition to information on the presence of double bonds and/or rings in the ions, its decimal digit gives an indication on the nature of the ion. In fact for odd-electron ions, RDB value is x.0 while for even-electron ions this value is x.5. So if we are studying the molecular ion (M+•, a radical cation) produced by electron ionization, RDB values x.0 will be considered. It should be noted that when we are considering ions produced by ESI or MALDI, where in general only even-electron ions are formed, our attention will be focused on formulae having RDB x.5.
In addition to the accurate mass of the most abundant ion, also accurate masses of [M+1]+ and [M+2]+ should be determined together with the relative intensity of the isotopic cluster to ascertain the congruity of all the data (Fig. 5.6).

High resolution mass spectrum of a cyclic peptide, accurate masses of the isotopic cluster of the protonated molecule, the first three proposed elemental formulae, their exact masses, errors and RDB calculated for each accurate mass
Another constrain for reducing ambiguity and the number of potential chemical formulae is the spectral ion abundance error which is an estimation on how well the experimental isotopic pattern from the detected compound matches to the isotopic pattern calculated for the proposed chemical formula [23]. In fact high mass accuracy (<1 ppm) alone is not enough to exclude enough candidates with complex elemental compositions (C, H, N, S, O, P, and potentially F, Cl, Br and Si). Use of isotopic abundance patterns as a single further constraint removes most of false candidates (Table 5.2).
Finally, it is possible performing accurate mass measurements on fragment/product ions, for example in EI spectra or in tandem mass spectra, and verify the agreement of all the data. For example [C10H20N2]+ cannot have [C9H18O]+ as product ion. In addition, accurate mass measurements on fragment/product ions allows one to determine the formula of the species lost in the fragmentation.
High resolution mass spectrometry finds application in many fields: MS imaging, food, petroleomics, proteomics, forensic sciences, metabolomics, homeland security, etc.
5.5 Tandem Mass Spectrometry
In mass spectrometry the presence of fragment/product ions is crucial for elucidating the structure of an unknown. Until the ion remains intact, its structure remains unknown!
So the aim of tandem mass spectrometry is to induce selective fragmentation of an ion that is located outside of the ionization source, i.e. in the analyzer region. In tandem mass spectrometry experiments, two (MS/MS or MS2) or more (MSn) sequential stages of mass analysis (which can be spatially or temporally separated) are used in order to examine selectively the decomposition of given ions in a mixture of ions [1,2,3,4].
Three main scan modes can be used in tandem mass spectrometry: (i) product ion scan which consists in selecting ions with a given m/z value, induce their dissociation and detecting their product ions (Fig. 5.7); (ii) precursor ion scan: in this case, all precursors of a given fragment ion are detected. This approach is particularly useful when a common fragment ion is produced from different compounds of a mixture.

ESI (+) MS (top) and MS/MS product ion scan (bottom) of a peptide
The third kind of scan mode, i.e. neutral loss scan, consists of the detection of fragmentation pathways involving elimination of neutral species, such as H2O, CO, CO2, HCN.
Ion decomposition can be obtained by four main mechanisms: (a) collisions of ions with a gas, generally nitrogen, helium, or argon. This yields a conversion of part of the translational energy of the ion to internal energy with a consequent bond cleavage and dissociation so to produce collision induced dissociation (CID) spectra. CID experiments can be done in low energy regime (1–100 eV collision energy) in ion traps, triple quadrupoles, Q-TOF or in high energy regime (5–30 keV collision energy) in sectors and TOF-TOF instruments; (b) interactions of ions with electrons through electron capture dissociation (ECD) [6], occurring inside a FT-ICR analyzer, or through electron transfer dissociation (ETD) [7] by ion-ion reactions inside an ion trap; (c) interactions of ions with photons (infrared multiphoton dissociation (IRMPD)); (d) interactions of ions with surfaces (surface-induced dissociation (SID)) [8, 25].
5.6 Conclusion
Modern mass spectrometry offers very powerful tools for identification, structural characterization and quantitation of unknowns.
Its coupling with separative techniques, such as gas chromatography or liquid chromatography (HPLC, UPLC, UHPLC, etc.) allows to separate analytes based on their retention times and to study complex mixtures.
In addition to the molecular weight determination, high resolution mass spectrometry allows to have very high specificity, by separating isobaric ions, and to make accurate mass measurements from which it is possible to determine the chemical formula of the ion.
Different techniques of tandem mass spectrometry, through the formation of selective fragmentation and decomposition of ions, allow obtaining structural information or offering suitable tools for quantitative determinations.
Other tools, such as mass spectrometry imaging (see Chap. 7 of this book), native mass spectrometry, hydrogen-deuterium exchange mass spectrometry, isotope ratio mass spectrometry, etc) are nowadays available and yield wide amounts of information about different analytes. In addition to them, it is also possible to investigate size and shape (conformation) of ions by using ion mobility which is having more and more relevance and diffusion in modern mass spectrometry. It has a lot applications in different fields: with portable and standalone spectrometers in homeland security with detection of toxic industrial chemicals, chemical-warfare agents; with an ion mobility device inserted inside a mass spectrometer it can investigate size and shape of wide classes of molecules, from small to large and very large, such as carbohydrates, metabolites, proteins, etc.
References
De Hoffmann E, Stroobant V (2007) Mass spectrometry: principles and applications, 3rd edn. Wiley, New York
Gross JH (2011) Mass spectrometry. A textbook, 2nd edn. Springer, Berlin
Dass C (2007) Fundamentals of contemporary mass spectrometry. Wiley-Interscience, New York
Desiderio DM, Nibbering NM (2009) In: Ekman R, Silberring J, Westman-Brinkmalm AM (eds) Mass spectrometry: instrumentation, interpretation, and applications. Hoboken, Wiley
Gross ML, Caprioli RM (eds) (2003) The encyclopedia of mass spectrometry, vol 1–10. Elsevier Science, Oxford
Zubarev RA, Kelleher NL, Mc Lafferty FW (1998) Electron capture dissociation of multiply charged protein cations. A nonergodic process. J Am Chem Soc 120:3265–3266
Syka JE, Coon JJ, Schroeder MJ, Shabanowitz J, Hunt DF (2004) Peptide and protein sequence analysis by electron transfer dissociation mass spectrometry. Proc Natl Acad Sci USA 101:9528–9533
Mabud MA, Dekrey MJ, Cooks RG (1985) Surface-induced dissociation of molecular ions. Int J Mass Spectrom Ion Proc 67:285–294
Robb DB, Covey TR, Bruins AP (2000) Atmospheric pressure photoionization: an ionization method for liquid chromatography–mass spectrometry. Anal Chem 72:3653–3659
Revel’skii IA, Yashin YS, Kurochkin VK, Kostyanovskii RG (1991) Mass spectrometry with photoionization at atmospheric pressure and the analysis of multicomponent mixtures without separation. Chem Physicochem Methods Anal 243–248 (translated from Zavodskaya Laboratoriya 57:1–4)
Van Berkel GJ, Pasilis SP, Ovchinnikova O (2008) Established, emerging atmospheric pressure surface sampling/ionization techniques, for mass spectrometry. J Mass Spectrom 43:1161–1180
Chen H, Gamez G, Zenobi R (2009) What can we learn from ambient ionization techniques? J Am Soc Mass Spectrom 2009(20):1947–1963
Alberici RM, Simas RC, Sanvido GB, Romao W, Lalli P, Benassi M, Cunha IBS, Eberlin MN (2010) Ambient mass spectrometry: bringing MS into the “real world”. Anal Bioanal Chem 398:265–294
Huang MZ, Yuan CH, Cheng SC, Cho YT, Shiea J (2010) Ambient ionization mass spectrometry. Annu Rev Anal Chem 3:43–65
Huang MZ, Cheng SC, Cho YT, Shiea J (2011) Ambient ionization mass spectrometry: a tutorial. Anal Chim Acta 702:1–15
Ifa DR, Wu C, Ouyang Z, Cooks RG (2010) Desorption electrospray ionization and other ambient ionization methods: current progress and preview. Analyst 135:669–681
Weston DJ (2010) Ambient ionization mass spectrometry: current understanding of mechanistic theory; analytical performance and application areas. Analyst 135:661–668
Harris GA, Galhena AS, Fernández FM (2011) Ambient sampling/ionization mass spectrometry: applications and current trends. Anal Chem 83:4508–4538
IUPAC Compendium of chemical terminology – the Gold Book, https://goldbook.iupac.org/
Brenton AG, Godfrey AR (2010) Accurate mass measurement: terminology and treatment of data. J Am Soc Mass Spectrom 21:1821–1835
Gross ML (1994) Accurate masses for structure confirmation. J Am Soc Mass Spectrom 5:57
Quenzer TL, Robinson JM, Bolanios B, Milgram E, Greig MJ (2002) Automated accurate mass analysis using FTICR mass spectrometry, Proceedings of the 50th ASMS conference, Orlando
Wang Y, Gu M (2010) The concept of spectral accuracy for MS. Anal Chem 82:7055–7062
Kind T, Fiehn O (2006) Metabolomic database annotations via query of elemental compositions: mass accuracy is insufficient even at less than 1 ppm. BMC Bioinformatics 7:234–243
Wysocki VH, Ding JM, Jones JL (1992) Surface-induced dissociation in tandem quadrupole mass spectrometers: a comparison of three designs. J Am Soc Mass Spectrom 3:27–32
Author information
Authors and Affiliations
Corresponding author
Editor information
Editors and Affiliations
Rights and permissions
Copyright information
© 2017 Springer Science+Business Media B.V.
About this paper
Cite this paper
Giorgi, G. (2017). Mass Spectrometry and High Resolution Mass Spectrometry: An Overview. In: Banoub, J., Caprioli, R. (eds) Molecular Technologies for Detection of Chemical and Biological Agents. NATO Science for Peace and Security Series A: Chemistry and Biology. Springer, Dordrecht. https://doi.org/10.1007/978-94-024-1113-3_5
Download citation
DOI: https://doi.org/10.1007/978-94-024-1113-3_5
Published:
Publisher Name: Springer, Dordrecht
Print ISBN: 978-94-024-1112-6
Online ISBN: 978-94-024-1113-3
eBook Packages: Biomedical and Life SciencesBiomedical and Life Sciences (R0)