
Abstract
Endoscopic ultrasound is the most sensitive method to detect malignant tumors of the pancreas <2 cm.
Access provided by Autonomous University of Puebla. Download chapter PDF
Keywords
These keywords were added by machine and not by the authors. This process is experimental and the keywords may be updated as the learning algorithm improves.
1 Self-Assessment Questions
-
1.
Endoscopic ultrasound is the most sensitive method to detect malignant tumors of the pancreas <2 cm.
-
a.
True
-
b.
False
-
a.
-
2.
The following statements regarding computed tomography (CT) are true, except:
-
a.
CT is limited by the use of ionizing radiation and intravenous contrast.
-
b.
CT allows three-dimensional reconstructions with the use isotropic voxels.
-
c.
CT is the most common imaging modality used to evaluate pancreatic masses.
-
d.
CT is superior to magnetic resonance for detecting pancreatic calcifications.
-
e.
CT is the method of choice for detection and staging of neuroendocrine tumors of the pancreas.
-
a.
-
3.
There is less than a 5 % risk of pancreatitis post-ERCP.
-
a.
True
-
b.
False
-
a.
-
4.
The signal intensity of the normal pancreas in T1WI with fat suppression sequence is:
-
a.
Higher than the spleen
-
b.
Same as the kidneys
-
c.
Lower than the liver
-
d.
Lower than the spleen
-
e.
Lower than the kidneys
-
a.
-
5.
Magnetic cholangiopancreatography (MRCP) is currently the method of choice in the detection of:
-
a.
Ectopic pancreas
-
b.
Pancreatic injury
-
c.
Pancreatic divisum
-
d.
Annular portal pancreas
-
e.
Pancreatic calcifications
-
a.
-
6.
PET/CT has the advantage of differentiating residual or recurrent tumor from postoperative fibrosis 8–12 weeks after surgery.
-
a.
True
-
b.
False
-
a.
-
7.
Octreotide scan has a high sensitivity for detecting insulinomas.
-
a.
True
-
b.
False
-
a.
Answers: 1. a, 2. e, 3. b, 4. a, 5. c, 6. a, 7. b.
2 Imaging of the Pancreas
-
Pancreatic imaging is a crucial tool for diagnosing pancreatic disease.
-
The diagnosis of pancreatic diseases often requires the combined use of different imaging modalities, allowing the evaluation of the pancreatic parenchyma, pancreatic duct, and surrounding tissues.
Current morphological and functional imaging techniques available for studying the pathology of the pancreas are:
-
Ultrasound
-
Transabdominal (US)
-
Endoscopic (EUS)
-
Intraoperative (IOUS)
-
-
Multidetector computed tomography (MDCT)
-
Magnetic resonance imaging (MRI)
-
18F-FDG positron emission computed tomography (PET/CT)
-
Somatostatin receptor scintigraphy 111Indium labeled Octreotide (OctreoScan)
-
Endoscopic retrograde cholangiopancreatography (ERCP)
Each of these imaging modalities has advantages and disadvantages. Their clinical use is dependent on the anatomic and functional characteristics of the pathology in question.
2.1 Ultrasound
2.1.1 Transabdominal (Figs. 5.1–5.7)
-
First-line screening modality for evaluating patients with suspected pancreatic disease.
-
Noninvasive, widely available, low cost, and portable.
-
Routine examination includes multiple plane scans (transverse, sagittal, and oblique), and the use of tissue harmonic imaging and color Doppler.
-
Contrast-enhanced ultrasound (CEUS) is not currently approved by the United States Food and Drug Administration (USFDA) but is used in many other countries.
-
Indications
-
Acute pancreatitis (evaluation for biliary stones)
-
Complication of acute/chronic pancreatitis (pseudocyst, pseudoaneurysms, portal/splenic vein thrombosis, biliary obstruction, ascites)
-
Suspected pancreatic mass (jaundice, epigastric pain, weight loss)
-
Detection and characterization of cystic pancreatic masses
-
Guided fine-needle aspiration (FNA) is the method used in interventional procedures of pancreatic masses or percutaneous drainage of pancreatic or peripancreatic fluid collections
-
-
Limitations
-
Obesity
-
Abdominal gas
-
Poor patient cooperation
-
Surgical dressings
-
Operator dependent
-
-
Normal pancreas on ultrasound
Fig. 5.1 

Normal anatomy of the pancreas on transabdominal ultrasound. Transverse (a, b) and sagittal sonograms obtained progressively from paramedian region toward the splenic hilum (c–j) show the vascular landmarks (a, c, e, g, i), and the anatomic divisions of the pancreas and adjacent organs (b, d, f, h, j)
Fig. 5.2 
Color Doppler of the portal vein system. (a) Portal vein, transverse scan. This vessel arises from the junction of the splenic and superior mesenteric vein posterior to the pancreatic neck and courses obliquely to the right to terminate in the porta hepatis (arrows). (b) By Doppler, this vein demonstrates hepatopetal flow with monophasic, low velocity waveform which undulates slightly with respiration. (c) Splenic vein, transverse scan. This vein runs posterior to the body and tail of the pancreas from the splenic hilum to the neck of the pancreas (arrow). (d) By Doppler, this vein demonstrates hepatopetal flow with monophasic, low velocity waveform which undulates slightly with respiration. (e) Superior mesenteric vein, sagittal scan. This vein runs parallel and to the right of the superior mesenteric artery (arrows). It joins to the splenic vein posterior to the neck of the pancreas. (f) By Doppler, this vein demonstrates hepatopetal flow with monophasic, low velocity waveform which undulates slightly with respiration
Fig. 5.3 

Color Doppler of the main arteries of the pancreas. The hepatic artery on color Doppler, transverse scan (a). The common hepatic artery (arrows) after arising from the celiac artery advances a short distance along the superior border of the pancreatic head (arrows) and then divides into the hepatic proper and the gastroduodenal artery. By Doppler ultrasound, this vessel shows a low-resistance arterial signal (b). Gastroduodenal artery on color Doppler transverse and sagittal scans (c, d). This artery after arising from the common hepatic artery can be identified in the anterosuperior border of the pancreatic head (arrow). By Doppler ultrasound, this artery shows the same low pulsatility signal as the hepatic artery (e).
Superior mesenteric artery on color Doppler transverse and sagittal scan (f, g) (arrows). This vessel arises from the aorta immediately below the origin of the celiac artery. It can be identified between the aorta and the splenic vein. On Doppler ultrasound, this artery shows a low-resistance diastolic flow (h). Note: 30–90 min after eating, the flow in this artery changes to a high resistance waveform
Fig. 5.4 
Transverse (a) and sagittal (b) views of the head of the pancreas show the anatomic location of the gastroduodenal artery and common bile duct
Fig. 5.5 
Variants of normal pancreatic echogenicity. (a) Transverse scan of the pancreas of a 35-year-old male patient shows that the pancreatic parenchyma (arrows) has similar echogenicity to the liver parenchyma (arrows). (b) Transverse scan of the pancreas performed on a 22-year-old female patient shows that the pancreatic parenchyma (arrows) is more echogenic than the liver parenchyma (arrows). (c) Transverse image of the pancreas of a 73-year-old female shows a homogeneous increase of echogenicity of the pancreas (arrows) similar to the retroperitoneal fat (white arrows). (d) Transverse image of the pancreas of a 68-year-old male shows a heterogeneous increased echogenicity of the pancreas (arrows)
Fig. 5.6 
Normal appearance of the main pancreatic duct in two different patients on conventional ultrasound. (a) Transverse image of the pancreas shows the main pancreatic duct appearing as two parallel echogenic lines (arrows). (b) Transverse image of the pancreas shows the main pancreatic duct appearing as a single echogenic line (arrows)
Fig. 5.7 
Pseudopancreatic duct on conventional ultrasound in two different patients. Transverse views (a, b) of the body of the pancreas show a tubular structure with parallel echogenic lines (posterior wall of the stomach) mimicking a pancreatic duct (arrows)
The pancreas can be localized by ultrasound by identifying its parenchymal architecture and the adjacent anatomic landmarks.
-
The most useful landmark to identify the pancreas is the splenic vein (SV).
-
On transverse scan, the splenic vein appears as a tubular anechoic structure located directly posterior to the body and tail of the gland.
-
The confluence of the splenic and superior mesenteric vein (SMV) occurs just posterior to the pancreatic neck.
-
The superior mesenteric vein courses between the pancreatic neck and uncinate process.
-
The portal vein (PV) courses cephalad to the hepatic hilum.
-
The splenic artery (SA) runs in the superior border of the body and tail of the pancreas. This artery is often markedly tortuous.
-
The superior mesenteric artery runs posterior to the superior mesenteric vein.
-
The gastroduodenal artery (GDA) courses along the right anterolateral aspect of the pancreatic head. This structure appears as a small anechoic dot on a transverse view.
-
The normal pancreatic parenchyma usually has a homogeneous texture and is isoechoic or hyperechoic to the normal liver parenchyma.
-
With age, fatty replacement of the pancreas is common, and the parenchyma may appear as echogenic as the adjacent retroperitoneal fat or may adopt a heterogeneous appearance.
-
The pancreatic duct may be seen as a double parallel echogenic line or as a single linear echogenic structure.
-
-
The main pancreatic duct can be confused with the posterior wall of the stomach (pseudopancreatic duct).
-
The common bile duct lies in the posterior aspect of the head of the pancreas.
-
It appears as a small anechoic dot in the inferior lateral aspect of the head of the pancreas in the transverse plane and as a tubular structure in the posterior aspect of the head of the pancreas on the sagittal plane.
-
The average diameter of the common bile duct on ultrasound is 7 mm and no larger than 10 mm after cholecystectomy.
-
-


Practical Pearls
-
Ultrasound is an extremely useful screening method for evaluating patients with jaundice to determine the presence of biliary obstruction. However, in order to accurately identify the site and the etiology of the biliary obstruction, computed tomography or magnetic resonance is required.
-
In patients with acute pancreatitis, ultrasound is commonly utilized to look for biliary stones, fluid collections, or vascular complications.
2.1.2 Endoscopic Ultrasound (EUS) (Figs. 5.8 and 5.9)

Endoscopic ultrasound (EUS) in two different patients with indeterminate pancreatic lesions by computed tomography. (a) EUS transverse view demonstrates a complex mass with cystic and solid elements (FNA: borderline IPMN). (b) EUS transverse view reveals a solid mass in the head of the pancreas (FNA: malignant IPMN)

Guided fine-needle aspiration using endoscopic ultrasound (EUS). (a) Transverse view shows a needle (arrow) within a complex cystic mass. Cytology specimen (b) shows a cluster of cohesive cells with well-defined borders and increased mucin-producing cytoplasm (arrows) floating in a background of mucin (arrowheads). (Papanicolau, 60×)
-
During EUS, the entire pancreas can be examined in almost all patients, as gas and fat interferences are eliminated.
-
The great advantage of this technique is that in addition to the images, tissue samples can be obtained in real time using fine-needle aspiration techniques (EUS-FNA).
-
Indications
-
Early detection of small pancreatic carcinoma
-
Staging pancreatic malignancy
-
Detection of neuroendocrine tumors
-
Characterization of cystic pancreatic masses
-
-
Limitations
-
Availability, a small field of view, requires patient sedation.
-
-
EUS-FNA complications
-
Acute pancreatitis, hemorrhage, and infection
-
Practical Pearl
-
This imaging technique is especially useful for detecting and characterizing small pancreatic masses; however, it requires an expert endoscopist, and therefore availability of this technique is limited in many medical centers.
2.1.3 Intraoperative Ultrasound (IOUS) (Figs. 5.10–5.13)

Intraoperative ultrasound of the pancreas, performed for localizing an undetectable insulinoma by computed tomography and magnetic resonance. (a, b) IOUS transverse image show a small (a) (arrow) hypoechoic, hypervascular mass in the body of the pancreas. Pathology: insulinoma (6 mm in diameter)

Intraoperative ultrasound in a patient with MEN-1 syndrome with a small neuroendocrine tumor in the head of the pancreas detected by computed tomography. (a, b) IOUS demonstrates a small hypoechoic, hypervascular mass in the pancreatic head (arrow) and an additional second lesion in the pancreatic neck (arrowhead)

Intraoperative ultrasound (IOUS) of the liver performed for detection of hepatic metastases in a patient with known pancreatic neuroendocrine tumors. Transverse scan of the liver demonstrates two hyperechoic solid lesions in segments 7 and 8 of the liver (arrows)

Patient with a malignant neuroendrocrine tumor of the pancreas who underwent an IOUS of the liver to rule out metastases. Transverse scan of the liver displays a single lesion in segment seven of the liver (arrow). This lesion was not detected by MDCT. A segmentectomy was performed. Final pathology revealed a single metastatic deposit
-
Intraoperative ultrasound (IOUS) is a dynamic imaging modality that provides interactive and timely information during surgical procedures.
-
Because the tranducer is in direct contact with the organ, high resolution images can be obtained that are not degraded by air or overlying soft tissues.
-
It can accurately localize pancreatic pathology, hepatic metastases, limit the extent of surgical resection, improve surgical staging, guide surface incisions for deep lesion resection, and may help the surgeon to select the optimal surgical procedure.
-
Indications
-
Staging and localizing pancreatic tumors
-
Performing regional metastatic surveys
-
Documenting arterial and venous patency
-
Identifying endocrine tumors
-
Distinguishing pancreatitis from a neoplasm
-
Guiding biopsy, duct cannulation, and to drain abscesses
-
-
Limitations
-
Availability, time consuming, and operative dependent
-
Practical Pearl
-
Intraoperative ultrasound has proven to be extremely useful in identifying small pancreatic neuroendocrine tumors not seen by the other imaging modalities or palpable by the surgeon. It can detect small metastatic lesions deep within the hepatic parenchyma.
2.2 Multidetector Computed Tomography
-
Multidetector computed tomography (MDCT) is the most commonly used imaging modality for the evaluation of pancreatic pathology.
-
MDCT has improved volume coverage, speed, and spatial resolution along the z-axis
-
It allows quick multiplanar reconstructions (MPR) or three-dimensional reformatting of the pancreas with the use of isotropic voxels: shaded surface display (SSD), maximum intensity projection (MIP), and three-dimensional volume rendering (3D VR).
-
MDCT is the modality of choice for the initial diagnosis and staging of pancreatic malignancies.
-
MDCT permits the acquisition of images in the arterial, pancreatic, and portal venous phases with a delay of 20, 40, and 70 seconds, respectively.
-
Most pancreatic neuroendocrine tumors and their metastases are small and very vascular and would be best seen in arterial phase images (20 s).
-
Maximum enhancement of the pancreas and the maximum tumor-to-parenchymal attenuation is achieved during the pancreatic phase (40 s).
-
The sensitivity improves if images are obtained at 70s in the portal venous phase.
-
-
Indications
-
Initial diagnosis and staging of pancreatic masses.
-
Diagnosis or confirmation of acute/chronic pancreatitis and its complications.
-
Determine the extension and location of peripancreatic fluid collections and vascular complications.
-
This imaging modality is as useful as with magnetic resonance for characterizing pancreatic cystic lesions.
-
Dynamic contrast-enhanced CT is the mainstay of imaging in suspected traumatic pancreatic injury.
-
This modality is the preferred guidance method for percutaneous needle biopsy of pancreatic masses and for aspiration or percutaneous drainage of pancreatic collections.
-
-
Disadvantages of CT
-
Ionizing radiation
-
Use of intravenous contrast
-
-
Normal pancreas on MDCT
Fig. 5.14 
Evaluation of the pancreas by MDCT. Volume rendered coronal image of the pancreas (a) shows the oblique orientation of this organ in the retroperitoneum (colored lines). Conventional axial images show that the pancretic tail (b) is located higher at level of T2 (white line), than the pancreatic body (c) at the level of L4 (red line), than the head (d) at the level of C1-L2 (blue line) and than the uncinate process (e) at the level of L2 (yellow line)
Fig. 5.15 
Pancreatic divisions on contrast-enhanced CT (a, b)
Fig. 5.16 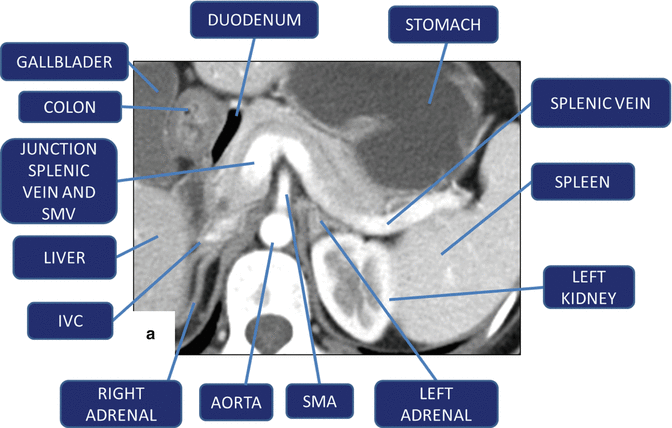

(a, b) Vascular landmarks of the pancreas and neighboring structures on contrast-enhanced CT axial images
Fig. 5.17 
Normal pancreatic duct on CT. Axial contrast-enhanced CT with curved planar reformat shows the entire length of the pancreatic duct (arrows)
Fig. 5.18 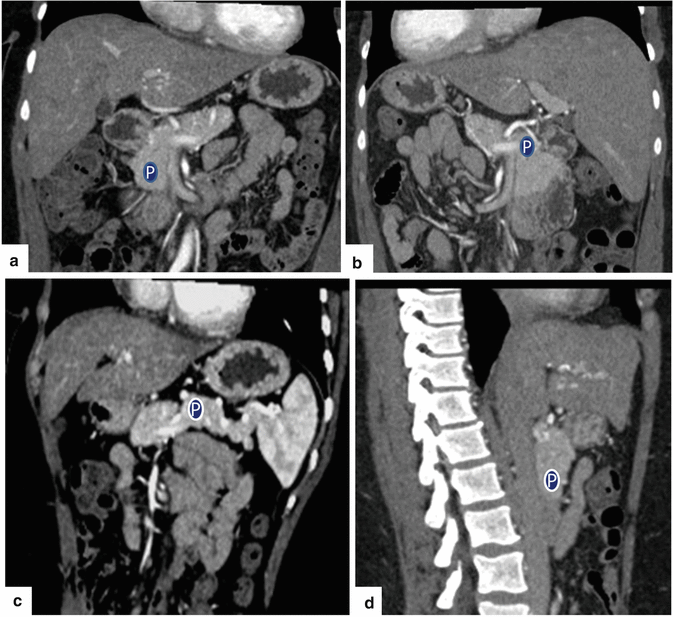
Multiple planar reformats of the pancreas (P) on contrast-enhanced CT. (a) Anterior coronal plane. (b) Posterior coronal plane. (c) Oblique plane. (d) Sagittal plane
Fig. 5.19 
CECT maximum intensity projection (MIP) reformation. Coronal images demonstrate the main arteries that supply the pancreas (a) and the main veins that drain the pancreas (b)
Fig. 5.20 
3D volume-rendered reformats of the pancreas on contrast-enhanced CT. (a, b) Axial and coronal images show a normal pancreas (arrows). (c, d) Axial and coronal images show a pancreatic pseudocyst (arrows). (e, f) Axial and coronal images show a neuroendocrine tumor on the tail of the pancreas (arrows)
Fig. 5.21 
Normal age-related changes of the pancreas on contrast-enhanced CT. (a, b) Axial images of the pancreas of a 30-year-old female show a pancreas with a homogeneous density and smooth margins (arrows). (c, d) Axial images of the pancreas of a 59-year-old female show a pancreas with a heterogeneous density and lobulated margins (arrows). (e, f) Axial images of the pancreas of an 86-year-old female show an atrophic pancreas with heterogeneous density and slightly lobulated margins (arrows)
-
The appearance of the pancreas on CT depends on the amount of fat within the intralobular septa that separates the acinar lobules of the gland.
-
The margins of the pancreas are smooth in younger patients.
-
The density of the parenchyma is homogeneous, with an attenuation similar to that of the muscle and spleen but less than non-contrast studies.
-
As we age, there is progressive fatty deposition in the pancreatic parenchyma. The pancreas appears heterogeneous, and the margins become lobulated.
-
The normal pancreatic duct is identified as a thin, tubular structure of low attenuation coursing in the center of the pancreatic parenchyma.
-
The pancreatic vascular anatomy is well delineated by this imaging modality.
-
The thin slices and isotropic reconstructions allow for the visualization of the main pancreatic arteries and veins.
-


Practical Pearls
-
This imaging modality is somewhat limited in thin patients and in the absence of intravenous or oral contrast.
-
The drawback of this technique is the use of significant ionizing radiation, particularly in pregnant patients, young individuals, and patients requiring close follow-up.
-
It is often challenging with CT to detect tumors less than 1 cm, which are the ones most likely to be considered resectable.
2.3 Magnetic Resonance Imaging (MRI) (Figs. 5.22–5.24)
-
Magnetic resonance imaging (MRI) is increasingly being used for identification and characterization of pancreatic diseases.
-
This modality has the capability of providing noninvasive images of the pancreatic ducts, cross-sectional images of the parenchyma analogous to computed tomography (CT) images, and angiographic depiction of blood vessels.
-
The evaluation of the pancreas can be optimized by the use of MR cholangiopancreatography (MRCP) which displays the pancreatic and biliary ductal system and with MR angiography (MRA) which visualizes the peripancreatic vessels.
-
At present, this “all-in-one” approach, combining pancreatic parenchymal MR, MRCP, and MRA, is the most cost-effective imaging technique in the evaluation of pancreatic diseases.
-
Indications
-
Suboptimal or equivocal CT or sonography findings with a high clinical suspicion of pancreatic pathology
-
Contraindication to iodinated contrast administration
-
Contraindication to ionizing radiation (pregnant women, children)
-
Characterization of suspected pancreatic parenchymal abnormalities found on CT or ultrasound (US)
-
Detection and staging pancreatic neoplasms
-
Characterization of cystic pancreatic lesions
-
Detection of small non-organ deforming pancreatic adenocarcinomas
-
Detection of neuroendocrine tumors
-
Evaluation of acute and chronic pancreatitis
-
Detection of choledocolithiasis as a cause of acute pancreatitis
-
-
Advantages and limitations of MRI
-
MRI is accurate in local staging of pancreatic malignancies owing to high soft tissue contrast resolution.
-
MRI has limitations as compared to MDCT, in the assessment of peripancreatic fat infiltration, vascular encasement, peritoneal deposits, and lymph node involvement.
-
MRI is as sensitive as MDCT in the identification of necrosis and peripancreatic fluid collections in acute pancreatitis cases.
-
MRI is less sensitive in the detection of calcifications associated with chronic pancreatitis.
-
Fat-suppressed T1-weighted MRI is more sensitive in the detection of early chronic pancreatitis, prior to development of calcifications.
-
MRI is useful in differentiating pancreatic pseudocysts from pancreatic neoplasms.
-
The presence of internal dependent debris is a highly specific MR finding for diagnosing pancreatic pseudocyst.
-
-
Normal pancreas parenchyma on MR imaging
Fig. 5.22 
Normal signal intensity of the pancreas on magnetic resonance. (a, b) Fat-suppressed gradient echo T1 weighted axial images show the normal high intensity of the pancreatic parenchyma in comparison to the signal intensity of the spleen and liver (arrows). (c, d) T2 weighted images with and without fat suppression axial images shows a low to intermediate signal of the pancreas in comparison with the spleen. (e, f) In contrast fat suppressed gradient echo T1 weighted breath hold axial images and after administration of intravenous gadolinium, arterial phase (e) shows intense homogeneous and early enhancement of the pancreas. (f) In portal phase, the signal intensity of the pancreas becomes isointense with the liver parenchyma
Fig. 5.23 
(a, b) Anatomy of the pancreas (P). Vascular landmarks and adjacent organs on magnetic resonance axial planes
Fig. 5.24 
CT versus magnetic resonance in the evaluation of a small nondeforming pancreatic adenocarcinoma. (a) Contrast-enhanced CT axial image demonstrates a small mass of low attenuation in the body of the pancreas (arrowhead) and mild dilatation of the pancreatic duct distal to this lesion. (b) Contrast-enhanced fat suppressed T1 weighted image shows the pancreatic mass (arrowhead) and the dilated pancreatic duct appear more conspicuous (arrow)
-
For imaging of the pancreatic parenchyma, various T1-weighted and T2-weighted sequences are used in axial and coronal planes.
-
The use of fat saturation pulses and dynamic studies following gadolinium intravenous injection has increased the sensitivity of this imaging technique in detecting pancreatic lesions.
-
Diffusion-weighted sequences help to differentiate the subtypes of pancreatic endocrine neoplasms on the basis of tumor cellularity and/or extracellular fibrosis that may account for various, apparent diffusion coefficient (ADC) values in these tumors.
-
T1-weighted images (T1WI) with fat suppression
-
The normal pancreas has the highest signal intensity of the intra-abdominal organs on fat-suppressed T1W images.
-
-
This high signal intensity of the pancreas is attributed to:
-
The larger amount of aqueous protein within the glandular elements.
-
Abundance of endoplasmic reticulum of the protein-producing acinar cells and the high content of paramagnetic ions, such as manganese.
-
Pancreatic solid masses and pancreatitis have longer T1 relaxation times due to increased water protons, therefore having “lower signal intensity” on T1WI images compared with the surrounding normal pancreatic parenchyma.
-
-
T2-weighted images (T2WI)
-
Normal pancreatic parenchyma has a shorter T2 relaxation time than the most abdominal organs; therefore, it has a low to intermediate signal on T2W images.
-
The spleen and the liver have a longer T2 than the pancreas and demonstrate higher signal intensity than the pancreas.
-
-
Intravascular administration of extracellular agent
-
The intravenous (IV) administration of an extracellular contrast agent (gadolinium chelate) increases the differences in signal intensity between normal pancreatic parenchyma and the usually less vascular neoplastic tissue.
-
It is useful in evaluating acute pancreatitis, especially for the detection of necrosis or vascular complications and for characterization of solid pancreatic masses.
-
-


Practical Pearl
-
MR images of the pancreas obtained with T1WI with fat suppression usually provide very important information regarding the pathologic conditions that may affect the pancreas.
2.3.1 MR Cholangiopancreatography (MRCP) (Fig. 5.25)
-
This MR technique is used for evaluating the pathology of the pancreatic duct and biliary system.
-
Frequently used in combination with an MR of the pancreas.
-
Imaging of the pancreatic duct is dependent on heavily T2-weighted imaging that selectively displays static or slow-moving fluid-filled structures (biliary system/duodenum).
-
Optimal sequence parameters vary with different images and depend on the availability of software applications and hardware applications.
-
MRCP dedicated pulse sequences
Fig. 5.25 
Magnetic resonance cholangiopancreatography. (a, b) MRCP thick slab, (c, d) T2 SE 3D respiratory trigger (MIP), and (e, f) thin section single-shot TSE T2-weighted images of the pancreas demonstrate dilatation and mild irregularity of the main pancreatic duct as well as dilatation of the side branches (arrows). In addition, dilatation of the intra- and extrahepatic biliary system up to the level of the ampulla (arrowheads) is demonstrated
-
2D SS-FSE (aka HASTE or RARE) also referred to as a single-shot technique
-
It takes around 3–4 s per slide and has 30–50 mm slice thickness.
-
Usually 3 or 4 slices are acquired at different angles through the biliary system.
-
-
3D TSE with navigator
-
One volume is usually isotropic voxel.
-
Can be used to generate multiplanar reconstructions (MPR) and maximum intensity projections images (MIP).
-
Uses a navigator in order to minimize motion from breathing. The navigator/pulse box is placed at the diaphragm. The navigator will monitor the motion of the diaphragm and only record data when the diaphragm is not moving.
-
Some vendors use a respiratory belt.
-
This sequence generally takes about 5–8 min but is a free breathing technique for the patient.
-
TR 2,000 msec, TE 600 msec, slice thickness 1.00–1.2 mm, matrix 384 × 384, and FOV 350–380.
-
-
Both of these techniques have a high TE (>600 msec) and fat saturation sequences.
-
The fat saturation eliminates any signal from abdominal fat.
-
In addition to the two sequences above, additional coronal thin slices T2W through the entire biliary system are obtained.
-

Practical Pearl
-
Magnetic resonance is a superb imaging technique to evaluate, characterize, and follow-up intraductal papillary mucinous neoplasms (IPMN) and to detect small metastatic deposits in the liver from malignant neuroendocrine tumors (diffusion sequences).
2.3.2 Secretin-Enhanced Dynamic MRCP (Fig. 5.26)
-
This is a variant of MRCP in which secretin is administered intravenously.
-
The exogeneous administration of secretin stimulates the secretion of fluid and bicarbonates by the exocrine pancreas and produces transient increases in the tone of the sphincter of Oddi.
-
Pancreatic secretion acts on an endogenous contrast medium that improves the depiction of the pancreatic duct and gives an estimate of the volume of fluid excreted by the pancreas (indirect access of the pancreatic exocrine reserve).
-
To detect changes at MRCP, the images are acquired dynamically
-
Indications
-
Evolution of ductal stricture or stones (chronic pancreatitis)
-
Depicts pancreas division or anamolous pancreatic biliary junction
-
Differentiate side-branch IPMN from other cystic neuroplasms or from a pancreatic pseudocystEvaluate patient for pancreatico-enteric anastomosis

Coronal MRCP images before and after the administration of intravenous secretin. Image obtained before the administration of secretin (a) shows a normal common bile duct (CBD) and poor visualization of the main pancreatic duct (MPD) (arrows). Image acquired 1 minute after secretin administration (b) shows the entire MPD (arrows) draining the major papilla together with the CBD and a patent accessory duct (thin arrow) draining into the minor papillae. The high signal intensity represents within the duodenum, the fluid excreted by the pancreas (arrowhead). Sequential images obtained at 5 minutes (c) and 10 minutes (d) show progressive increase of the amount of fluid in the duodenum and proximal jejunum (arrowhead) and the MPD becomes less conspicuous (arrows)
2.4 PET/CT of the Pancreas (Figs. 5.27–5.33)

Evaluation of a complex pancreatic mass with PET/CT. A 72-year-old male with repetitive attacks of acute pancreatitis. (a) Contrast-enhanced CT demonstrates a complex mass in the head of the pancreas (arrows). (b) Fused PET/CT shows increased FDG uptake in the region of the pancreatic mass (arrows). Finding suggestive of a malignant tumor. Patient underwent a pancreatoduodenectomy. Final diagnosis: invasive intraductal papillary mucinous neoplasm

Evaluation of metastases with PET/CT. A 56-year-old female patient with proven adenocarcinoma of the tail of the pancreas. (a) Contrast-enhanced CT shows an ill-defined, low attenuation mass in the tail of the pancreas (arrows). (b, c) Fused PET/CT scan performed to rule metastatic disease demonstrates a hypermetabolic mass in the same region (arrows). Note that there is no evidence of metastatic disease

Indeterminate pancreatic mass evaluated with PET/CT. A 62-year-old female with epigastric pain and weight loss. (a) Non-contrast-enhanced CT shows a lobulated solid mass in the pancreatic head (arrows) associated with peripancreatic fat stranding. (b, c) Fused PET/CT performed for tumor staging shows FDG uptake in this mass (arrow). Additionally, a focus of FDG accumulation was noted in the liver (curved arrows). Biopsy of the liver lesion revealed metastatic pancreatic adenocarcinoma

Evaluation of neoadjuvant chemotherapy response with PET/CT in a patient with an adenocarcinoma of the pancreas. A 55-year-old female with a history of pancreatic adenocarcinoma who received neoadjuvant chemotherapy. (a) Baseline fused PET/CT shows focal uptake of FDG in the area of the pancreas with an SUV of 6.2 (arrows). (b) Fused PET/CT done after the last chemotherapy regimen demonstrates a decrease in size of the focal area of FDG uptake in the head of the pancreas and a SUV of 5.3 (arrowheads). Patient underwent a pancreaticoduodenectomy. Final diagnosis: pancreatic adenocarcinoma with free surgical margin

Evaluation of recurrent pancreatic malignancy with PET/CT. A 72-year-old male with a history of distal pancreatectomy and splenectomy for an adenocarcinoma in the body of the pancreas. (a) Contrast-enhanced CT done 6 months after the surgery shows ill-defined, soft tissue between the left lobe of the liver and the lesser curvature of the stomach (arrows). (b) Fused PET/CT shows FDG uptake in this region (arrowheads). Fine-needle aspiration of this lesion revealed recurrent pancreatic adenocarcinoma

Evaluation of metastases from a pancreatic malignancy on PET/CT. A 48-year-old male with a history of distal pancreatectomy for an adenocarcinoma of the tail of the pancreas. (a, b) Plain contrast CT demonstrates multiple abdominal soft tissue masses, one abutting the lesser curvature of the stomach, another anterior to the right crux of the diaphragm, and two smaller lesions in the greater omentum (arrows). (c, d) Fused PET/CT shows intense FDG uptake in all of these masses (arrows). Findings consistent of diffuse carcinomatosis
-
Combined PET/CT provide both the metabolic information from 18F-FDG PET and the anatomic information from CT in a single examination.
-
Fluorine 18-fluorodeoxyglucose (18F-FDG) PET is a radiolabeled analog of glucose.
-
Because glucose uptake is increased in many malignancies, 18F-FDG PET is a sensitive method for detecting, staging, and monitoring the effects of therapy in many high-grade malignancies.
-
Benign and low-grade neuroendocrine tumors are characterized by normal or minimally increased uptake, unless they dedifferentiate into high-grade malignant tumors.
-
Typically, the amount of fluorine 18-fluorodeoxyglucose (18F-FDG) uptake in normal pancreatic parenchyma is insignificant compared with that of the liver.
-
Pancreatic malignancies usually manifest as an area of increased FDG uptake, appearing as a “hot spot” within the pancreas.
-
The level of FDG uptake or the absence of FDG uptake in a pancreatic tumor depends on the tumor biology and desmoplastic response of the tumor.
-
With this method, a semiquantitative analysis of the metabolic activity of the lesion is obtained calculating the standardized uptake value “SUV” of the lesion on the basis of the activity in the region of interest.
-
Indications
-
Detection and staging of high-grade pancreatic malignancies.
-
Monitoring effects of therapy.
-
Detection of recurrent disease or late metastases.
-
To identify sites of metabolically active tumor tissue amenable to intraoperative biopsy.
-
Shown by several studies to change preoperative staging and determination of operability.
-
Ideally, an attempt should be made to achieve normal glycemic values prior to the PET/CT study in patients with diabetes.
-
-
Limitations
-
The main limitation of this imaging modality is its relatively low spatial resolution which limits its role in evaluating direct invasion of adjacent structures or encasement of blood vessels.
-
These factors are important in the staging and planning of surgery for small tumors which are most likely to be successfully resected if detected early.
-
False positive associated with this technique
Potential causes include sites of hyperemia and inflammation or infection such as gastritis, colitis, pancreatitis, pseudocysts or recent post surgical and radiation sites of inflammation secondary to healing response. It is recommended that a study should be performed 6 - 8 weeks after, once inflammatory healing response has subsided.
-
False negatives associated with this technique
Tumor necrosis, recent chemotherapy or radiotherapy, hyperglycemia and hyperinsulinemia, tumors with large mucinous components, and some neuroendocrine tumors (especially well-differentiated, low-grade tumors)
-
Practical Pearls
-
PET/CT can alter the management of pancreatic cancer by demonstrating unsuspected metastases to the liver, lung, and bone, thereby avoiding the mortality and morbidity associated with unnecessary surgical intervention.
-
PET/CT has the advantage of differentiating residual and recurrent tumors if performed at least 8 weeks after recent pancreatic surgery or postirradiation of the pancreas.
-
18F-3′-fluoro-3′-deoxy-L-thymidine (FLT), a new radiolabeled molecule, may play a role in distinguishing tumor recurrence from postoperative fibrosis or inflammation, specifically.
-
The use of PET/CT for preoperative pancreatic cancer staging was reported as being cost effective because of its ability to demonstrate unexpected distal metastasis.
-
PET/CT is less sensitive for detecting low-grade pancreatic endocrine tumors, particularly those which are non functional and small in size at presentation, unless they differentiate into high-grade tumors.
2.5 Somatostatin Receptor Scintigraphy (Octreotide Scan) (Figs. 5.34–5.36)

Surveillance of multiple malignancies with PET/CT. An 81-year-old male with past history of multiple cancers (melanoma, renal cell carcinoma, and lymphoma) that have been treated and are in remission, being followed with serial imaging studies. (a, b) PET/CT axial and coronal images show a focal area of intense FDG uptake in the pancreatic head (arrows). (c) Contrast-enhanced CT demonstrates a complex hypervascular mass in the pancreatic head (arrow). Note the surgical absence of the left kidney. Patient underwent an endoscopic ultrasound with fine-needle aspiration of the lesion that was negative for malignancy. Patient underwent a pancreaticoduodenectomy. Final diagnosis: metastatic renal cell carcinoma to the pancreas

Evaluation of pancreatic mass with fused octreotide/CT. A 55-year-old female with vague abdominal pain and elevated chromogranin serum levels. (a) Contrast-enhanced CT demonstrates a mild hyperintense ovoid mass in the tail of the pancreas (arrows). (b) Fused ocreotide/CT scan shows intense uptake of ocreotide within the pancreatic tail mass (arrowheads). There was no evidence of metastatic deposits. Patient underwent a distal pancreatectomy. Final diagnosis: nonfunctional neuroendocrine tumor

Confirmation and staging of a gastrinoma with fused octreotide/CT. A 42-year-old male with intractable peptic ulcers and elevated serum gastrin levels. (a) Contrast-enhanced CT demonstrates a round, soft tissue mass between the head of the pancreas and the portal vein (arrows). (b) Fused ocreotide/CT scan shows intense uptake of octreotide by the mass (arrowheads). There was no evidence of metastasis. Pathology report: neuroendocrine tumor positive immunostain for gastrin
-
Pancreatic endocrine tumors are epithelial tumors which are usually well differentiated and are classified as functional or nonfunctional.
-
Neuroendocrine tumors represent 1–2 % of all pancreatic tumors.
-
Most (60–80 %) are nonfunctioning tumors.
-
Insulinomas and gastrinomas are the most common functioning islet cell tumors and are detected earlier in their clinical course while still of small size.
-
Most other functioning tumors (somatostatinoma, VIPomas, glucagonomas) and nonfunctioning tumors are often large and malignant at the time of diagnosis.
-
Neuroendocrine tumors, with the exception of insulinomas and poorly differentiated tumors, express somatostatin receptors and can be imaged with various radiolabeled analogs of octreotide.
-
The current radiotracer utilized clinically for detecting neuroendocrine tumors is 111-In-diethylenetriaminepentacetic acid (DTPA) octreotide.
-
111-In DTPA octreotide is a somatostatin analog that binds to somatostatin receptors (subtypes 2 and 5), which are expressed in functioning neuroendocrine tumors.
-
Also concentrates in various amine precursor uptake and decarboxylation (APUD) tumors such as pheochromocytomas, neuroblastomas, ganglioneuromas, paragangliomas, Merkel cell of the skin, pituitary adenomas, and small cell carcinomas.
-
-
Currently, these studies are performed utilizing both whole body scans and hybrid single-photon emission computed tomography coupled with CT (SPECT/CT) to increase sensitivity and provide better anatomical delineation.
-
Images are routinely acquired at 4 and 24 h and occasionally at 48 h post imaging.
-
Indications
-
Detection and staging neuroendocrine tumors of the pancreas and their metastases.
-
Follow-up patients with known disease to evaluate for progression or recurrence.
-
Determination of somatostatin receptors status (patients with somatostatin receptor-positive tumor may be more likely to respond to somatostatin or peptide receptor radionuclide therapy).
-
Recently, various PET tracers for somatostatin receptor imaging have become available, such as [68Ga-DTPA, Tyr 3] octreotide or [68Ga-DOTA o, Tyr 3] octreotide. These somatostatin analogs have a higher affinity for somatostatin receptor subtype 2.
-
Accumulation of 111 Indium octreotide may be seen:
-
In normal structures (pituitary, thyroid, liver, spleen, kidneys, bowel, gallbladder, ureters, bladder, and stimulated adrenals)
-
Potential causes of false positives include areas of hyperemia and active inflammation/infection since activated lymphocytes may express somatostatin receptors.
-
-
Accumulation may be seen in the following inflammatory settings:
-
Autoimmune diseases (rheumatoid arthritis, Grave’s disease), bacterial pneumonia, cerebrovascular accident, fibrous dysplasia, granulomatous diseases (tuberculosis, sarcoid), post-radiation inflammation, as well as recent surgical and colostomy sites.
-
False negatives: Presence of unlabeled somatostatin, either as result of octreotide therapy or due to production of somatostatin by the tumor itself may lower tumor detectability. Different affinities for the radioligand: variable tumor differentiation/receptor expression also influences tumor detectability. Liver metastases of neuroendocrine tumors may appear isointense because of a similar degree of tracer accumulation by normal liver. Correlation with anatomic imaging or subtraction scintigraphy with sulfur colloid may be considered.
-
-
Practical Pearl
-
This imaging modality is extremely useful to characterize a solid pancreatic mass, especially if there is a high suspicion that the mass corresponds to a neuroendocrine pancreatic tumor.
2.6 Endoscopic Retrograde Cholangiopancreatography (ERCP) (Figs. 5.37 and 5.38)

Evaluation of pancreatic mass with fused octreotide/CT. A 63-year-old male who underwent a contrast-enhanced CT for an abdominal bruit. (a) Axial and (b) coronal images demonstrate a large, heterogeneous, hypervascular mass in the head of the pancreas and a small hepatic mass with the same characteristics in the right lobe of the liver (curved arrow). (c, d) A fused octreotide/CT scan was done to look for additional metastases. This study demonstrates intense uptake of octreotide by the pancreatic mass (arrows) as well as by two hepatic lesions in the right lobe of the liver (arrowheads). The patient underwent a pancreaticoduodenectomy and a right hepatectomy. Final diagnosis: primary pancreatic neuroendocrine tumor with hepatic metastases

Endoscopic retrograde cholangiopancreatography (ERCP). A 53-year-old patient with suspicion of chronic pancreatitis. (a) ERCP shows mild irregularity of the main pancreatic duct and filling of the secondary branches (arrows). One day following this procedure, the patient developed epigastric pain. Subsequent contrast-enhanced CT (b) done the next day demonstrates peripancreatic fat stranding (arrows). Finding is suggestive of acute pancreatitis

Endoscopic retrograde cholangiopancreatography (ERCP) current indication. Stent placed with endoscopic guidance in a patient with pancreatic ascites secondary to a ruptured pancreatic pseudocyst. (a) ERCP shows extravasation of contrast from the pancreatic duct in the body of the pancreas (curved arrows). (b) Follow-up fluoroscopy plain film displays a pancreatic duct stent (arrows) bypassing the pancreatic duct disruption
-
Technique
-
Endoscopic cannulation of the pancreatic duct with retrograde injection of iodinated contrast under fluoroscopic control
The normal pancreatic duct has normal, smooth, and regular contours with progressive tapering from head to tail.
-
-
Indications
-
To assess patients suspected of having chronic pancreatitis
-
Pancreatic endotherapy (stent placement) for patients with strictures, stones, or fistulas in the main pancreatic duct
-
-
Complications
-
Acute pancreatitis (10–15 %)
-
Practical Pearl
-
Due to the substantial risk of acute pancreatitis, the use of ERCP in detection of chronic pancreatitis has been largely replaced by less invasive imaging modalities such MRCP.
3 Teaching Points
Pancreatic imaging | |
|---|---|
Ultrasound Transabdominal (US) Endoscopic ultrasound (EUS) Intraoperative ultrasound (IOUS) | Transabdominal ultrasound most common indications: detection of stones in suspected biliary pancreatitis and complications of acute or chronic pancreatitis Limitations: GI gas, obesity, surgical dressings, operator dependent EUS: Most sensitive technique for diagnosing small pancreatic carcinomas, guidance method for fine-needle aspiration of cystic or solid masses Limitation: availability IOUS: Most useful technique for localizing small pancreatic neuroendocrine tumors and small hepatic metastases Limitation: availability |
Multidetector computed tomography (MDCT) | Modality of choice for the initial diagnosis of pancreatic masses, acute and chronic pancreatitis, and their complications and for evaluating pancreatic injuries Limitations: ionized radiation, intravenous contrast allergy, renal failure |
Magnetic resonance imaging (MRI) | Very sensitive in the detection of small nondeforming pancreatic masses, for evaluating pancreatic pathology in patients allergic to iodine, children, and pregnant patients Limitations: pacemakers, availability, claustrophobia, and cost |
Magnetic resonance cholangiopancreatography (MRCP) | Method of choice for detection of pancreatic divisum, congenital biliary anomalies, site and etiology of biliary obstruction and to follow up cystic pancreatic masses Limitations: pacemakers, availability, claustrophobia and cost |
Magnetic resonance imaging (MRI) combined with Magnetic resonance cholangiopancreatography (MRCP) | Methods of choice for comprehensive evaluation of solid pancreatic masses, for diagnosing and following small cystic tumors of the pancreas, and for determining the site and etiology of biliary obstruction Limitations: pancreatic calcification, pacemakers, availability, claustrophobia, and cost |
Positron emission tomography computed tomography (PETCT) | Method of choice for staging pancreatic adenocarcinomas and for evaluating response to the treatment Limitations: availability, cost, false positives |
Somatostatin receptor scintigraphy (octreotide scan) | It is the initial imaging modality of choice for staging and detecting primary neuroendocrine tumors of the pancreas and detection of recurrent disease Limitations: poor sensitivity in the detection of insulinomas and false positives |
Endoscopic retrograde cholangiopancreatography (ERCP) | Main use: pancreatic endotherapy for patients with strictures or stones in the main pancreatic duct Limitation: the injection of contrast in the pancreatic duct may induce acute pancreatitis |
Recommended References
Articles: Magnetic resonance imaging of the pancreas on applied radiology online. http://appliedradiology.com/Article.aspx?id=14218&terms=magnetic+resonance+imaging+of+the+pancreas. Accessed 16 Sept 2013.
Magnetic resonance imaging of the pancreas. http://www.appliedradiology.com/articles/magnetic-resonance-imaging-of-the-pancreas. Accessed 20 May 2014.
Adams S, Baum RP, Adams M, et al. Clinical value of somatostatin receptor scintigraphy. Studies of pre- and intraoperative localization of gastrointestinal and pancreatic tumors. Med Klin (Munich). 1997;92(3):138–43.
Balon HR, Goldsmith SJ, Siegel BA, et al. Procedure guideline for somatostatin receptor scintigraphy with (111)in-pentetreotide. J Nucl Med. 2001;42(7):1134–8.
Barber TW, Kalff V, Cherk MH, Yap KS, Evans P, Kelly MJ. 18 F-FDG PET/CT influences management in patients with known or suspected pancreatic cancer. Intern Med J. 2011;41(11):776–83.
Calhoun PS, Kuszyk BS, Heath DG, Carley JC, Fishman EK. Three-dimensional volume rendering of spiral CT data: theory and method. Radiographics. 1999;19(3):745–64.
Cascini GL, Cuccurullo V, Mansi L. The non tumour uptake of (111)in-octreotide creates new clinical indications in benign diseases, but also in oncology. Q J Nucl Med Mol Imaging. 2010;54(1):24–36.
Chaudhary V, Bano S. Imaging of the pancreas: recent advances. Indian J Endocrinol Metab. 2011;15 Suppl 1:S25–32.
Intenzo CM, Jabbour S, Lin HC, et al. Scintigraphic imaging of body neuroendocrine tumors. Radiographics. 2007;27(5):1355–69.
Lamberts SW, Chayvialle JA, Krenning EP. The visualization of gastroenteropancreatic endocrine tumors. Metabolism. 1992;41(9 Suppl 2):111–5.
Lebtahi R, Cadiot G, Sarda L, et al. Clinical impact of somatostatin receptor scintigraphy in the management of patients with neuroendocrine gastroenteropancreatic tumors. J Nucl Med. 1997;38(6):853–8.
Matos C, Cappeliez O, Winant C, Coppens E, Deviere J, Metens T. MR imaging of the pancreas: a pictorial tour. Radiographics. 2002;22(1), e2.
Reidy-Lagunes DL, Gollub MJ, Saltz LB. Addition of octreotide functional imaging to cross-sectional computed tomography or magnetic resonance imaging for the detection of neuroendocrine tumors: added value or an anachronism? J Clin Oncol. 2011;29(3):e74–5.
Rufini V, Baum RP, Castaldi P, et al. Role of PET/CT in the functional imaging of endocrine pancreatic tumors. Abdom Imaging. 2012;37(6):1004–20.
Sahani DV, Bonaffini PA, Catalano OA, Guimaraes AR, Blake MA. State-of-the-art PET/CT of the pancreas: current role and emerging indications. Radiographics. 2012;32(4):1133–58; discussion 1158–60.
Shrikhande SV, Barreto SG, Goel M, Arya S. Multimodality imaging of pancreatic ductal adenocarcinoma: a review of the literature. HPB (Oxford). 2012;14(10):658–68.
Sundin A. Radiological and nuclear medicine imaging of gastroenteropancreatic neuroendocrine tumours. Best Pract Res Clin Gastroenterol. 2012;26(6):803–18.
Wang Z, Chen JQ, Liu JL, Qin XG, Huang Y. FDG-PET in diagnosis, staging and prognosis of pancreatic carcinoma: a meta-analysis. World J Gastroenterol. 2013;19(29):4808–17.
Yao J, Gan G, Farlow D, et al. Impact of F18-fluorodeoxyglycose positron emission tomography/computed tomography on the management of resectable pancreatic tumours. ANZ J Surg. 2012;82(3):140–4.
Author information
Authors and Affiliations
Corresponding author
Rights and permissions
Copyright information
© 2016 Springer-Verlag Berlin Heidelberg
About this chapter
Cite this chapter
Casillas, J., Serafini, A., Castillo, P., Quiroz, A., Ribeiro, A. (2016). Imaging of the Pancreas. In: Multidisciplinary Teaching Atlas of the Pancreas. Springer, Berlin, Heidelberg. https://doi.org/10.1007/978-3-662-46745-9_5
Download citation
DOI: https://doi.org/10.1007/978-3-662-46745-9_5
Publisher Name: Springer, Berlin, Heidelberg
Print ISBN: 978-3-662-46744-2
Online ISBN: 978-3-662-46745-9
eBook Packages: MedicineMedicine (R0)