
Abstract
Magnetic resonance imaging (MRI) is the imaging modality of choice for the evaluation of a variety of musculoskeletal pathologies. MRI has the advantage that it does not use ionising radiation and is non-invasive. In addition, it has a high soft tissue resolution and imaging capabilities in multiple planes.
A detailed knowledge of nuclear physics is not required for the interpretation of MRI images in the clinical setting. However, a basic understanding of the principles of MRI physics will allow the physician to understand the MRI appearances of pathological processes, identify abnormalities and make appropriate referrals for MRI investigations. This chapter briefly reviews the basics of MRI physics at a nuclear level, the steps involved in image acquisition, the pros and cons of various sequences for evaluating different tissue types and pathologies. We discuss MRI safety and future applications of MRI.
Access provided by Autonomous University of Puebla. Download chapter PDF
Keywords
- Fast Spin Echo
- Radio Frequency Pulse
- Echo Train Length
- Gradient Echo
- Standard Magnetic Resonance Imaging
These keywords were added by machine and not by the authors. This process is experimental and the keywords may be updated as the learning algorithm improves.
1 Indications for Musculoskeletal MRI
MRI is a very sensitive imaging modality and frequently identifies abnormalities that are not visible on plain radiographs, CT and ultrasound. Indications for MRI include occult fractures; early osteomyelitis; soft tissue injury to joints, particularly the shoulder, hip and knee; bone and soft tissue tumours and for imaging of the spine. However, not all pathology is optimally imaged with MRI, and the sensitivity and specificity of MRI are maximised when used in conjunction with other imaging modalities.
2 Obtaining a Good Image
The acquisition of an image of high diagnostic quality depends on multiple factors including:
-
Lack of patient movement
-
Use of an appropriate MR protocol
-
Use of an appropriate coil
-
Magnetic field strength
Patient movement during an MRI examination is usually due to patient discomfort or anxiety. Padding should be used to maintain adequate comfort during scanning, and if there is a chance that the patient may not be able to tolerate an entire study, it is sensible to perform the most important sequences first. Analgesia taken prior to an examination may also be helpful. In the case of babies and children, or those unable to follow commands, sedation or general anaesthesia may be required. Claustrophobic patients may benefit from referral to an open scanner, although image quality may be slightly inferior to that of a closed magnet.
An ideal image has a high ‘signal-to-noise ratio’ (SNR) and good resolution (the ability to detect small or fine structures). Unfortunately, increasing the resolution tends to decrease the signal and vice versa. As a result, there is always a trade-off between the SNR and image resolution, which can be minimised with the choice of an appropriate coil and imaging protocol.
Surface coils placed on, or volume coils placed around, the body part of interest produce a superior signal to that produced by a body coil. While the smallest coil possible should be used, it must be capable of detecting signal from the entire length and depth of the tissues of interest.
Imaging in an MRI scanner with a higher magnetic field strength (e.g. 3T vs. 1.5T) can produce an increase in the SNR, improvement in resolution and faster scanning times. However, there is a greater risk of producing artefacts.
3 Basic MR Physics
An atom consists of a nucleus containing protons and neutrons and an outer shell, consisting of electrons.
Within the nucleus of an atom, the protons and neutrons spin about their own axes. Nuclei with an odd number of protons such as hydrogen 1, carbon 13 and oxygen 17 are known as ‘MR-active nuclei’, as they combine a net charge with net spin. A ‘moving charge’ or current therefore exists, and in keeping with the basic rules of physics, this current induces a magnetic force. The MR-active nuclei act as tiny bar magnets, and the application of an external magnetic field (as in an MRI scanner) causes their magnetic moments to align in parallel with the external magnetic field. The magnetic moments are also induced to spin at a certain frequency determined by the strength of the external magnetic field. The magnetic moments are said to be ‘in-phase’ when they are all at the same position in their precessional path at a single point in time. Routine MRI uses hydrogen as an MR-active nucleus because it is abundant in the fat and water of the body and contains a single proton, giving it a large magnetic moment.
When a radio frequency (RF) pulse of the same frequency as that of the precessing hydrogen nuclei is applied at 90° to the direction of the external magnetic field, resonance occurs, leading to the hydrogen nuclei absorbing energy from the RF pulse. The magnetic moments move in phase with each other, and the net magnetic vector (NMV) comes to lie in the transverse plane, 90° to the direction of the magnetic field.
The receiver coil also lies in the transverse plane. A voltage (the MR signal) is induced in the receiver coil as a result of the NMV rotating around the transverse plane at resonance.
The RF pulse is then removed and the newly established transverse magnetisation (and therefore also the MR signal) decreases, while the longitudinal magnetisation is restored to its original state. A new RF pulse is applied and the process is repeated.
The time taken for the longitudinal magnetisation to increase again following removal of the RF pulse is referred to as the time constant ‘T1’, and the time taken for the transverse magnetisation to disappear is described by the time constant ‘T2’. Typical values are T1 of 300–2,000 ms and T2 of 30–150 ms. Water has a long T1 and a long T2, while fat has a short T1 and a short T2.
3.1 TR and TE
The degree of T1 weighting of an image is controlled by the repetition time (TR) – the time interval between two consecutive RF pulses. A short TR maximises T1 differences, while a long TR minimises T1 differences between tissues.
The T2 weighting is controlled by the echo time (TE), which is the time interval between the generation of the RF pulse and the collection of the MR signal. A short TE minimises T2 differences between tissues, while a long TE maximises the T2 differences.
The TR and TE are measured in milliseconds (ms).
4 MR Image Contrast
An image has contrast if it contains areas of high signal intensity (white), low signal intensity (black) and intermediate signal intensity (grey). The intensity of the signal generated by a tissue depends on its water and fat content, the proton density and the presence of any CSF or blood flow.
The signal intensity returned by a tissue is proportional to the size of the transverse component of magnetisation of that tissue at resonance.
Water consists of small molecules with little inertia, which are not able to absorb energy efficiently, while fat consists of large molecules which have slower motion, greater inertia and are able to absorb energy more efficiently. It is these differences that cause the magnetisation in different tissues to relax at different rates when the RF pulse is removed and is the basis for the contrast between tissues that contain varying amounts of fat or water.
Image contrast can also be adjusted manually by means of manipulating other factors, including the TE and TR.
5 Image Sequences
Musculoskeletal MRI examinations typically consist of at least two sequences obtained in several planes. Spin echo (SE) and gradient echo (GE) pulse sequences are typically used in MSK imaging and are used to produce T1-weighted (T1W), T2-weighted (T2W), proton density-weighted (PDW) and T2*-weighted GE images.
Conventional spin echo (CSE) sequences have the drawback of long acquisition times. To overcome this, fast spin echo (FSE) sequences are now routinely used.
The majority of standard MRI examinations take 20–30 min to complete, with each sequence lasting around 5 min. Post-contrast sequences will typically add an extra 10–15 min to an examination.
5.1 T1 Weighting
T1-weighted (T1W) sequences have a short TR and short TE. Fat, subacute haemorrhage and proteinaceous fluid are bright on T1-weighted images, but other fluids are typically of a low signal intensity.
T1 weighting best demonstrates anatomy and bone marrow architecture (Fig. 7.1) and is also useful for demonstrating the presence of fat, subacute haemorrhage and abnormal tissue enhancement following administration of intravenous gadolinium contrast agent. It is less sensitive than T2W fat-saturated or STIR (short tau inversion recovery) sequences for the detection of fluid, soft tissue oedema and bone marrow pathology.

T1-weighted sagittal image of the lumbar spine, demonstrating normal hypointense cerebrospinal fluid (arrow)
Typical parameters for T1-weighted sequence: TE < 30, TR < 1,000, Flip angle 90 (Helms et al. 2009).
5.2 T2 Weighting
T2W images are obtained by using sequences with a long TR and a long TE.
Fat is bright (high signal) on T2W FSE sequences (unless fat-saturation techniques have been applied) although not quite as bright as on the T1W sequences. Normal muscle is of intermediate-low signal, while fluid is very bright. T2-weighted images are useful for identifying fluid and general pathology, which typically appears as high signal (Fig. 7.2).

T2-weighted sagittal image of the lumbar spine. The cerebrospinal fluid (arrow) is hyperintense
Typical parameters for T2-weighted sequence: TE > 60, TR > 2,000, flip angle 90 (Helms et al. 2009).
5.3 Proton Density (PD)
PD-weighted images are obtained by using sequences with an intermediate/long TR and a short TE, with the result that the T1 and T2 effects are diminished.
Contrast is mainly due to differences in the relative density of protons in different tissues. Tissues with a low proton density are of low signal, while those with a high proton density appear as areas of high signal.
PDW sequences are good for demonstrating anatomy and are a good sequence for evaluating pathology of the menisci and articular cartilage (Fig. 7.3). However, they produce relatively little tissue contrast and in the absence of fat saturation, are relatively insensitive to marrow pathology and the presence of fluid.

Sagittal PDW image of the normal knee demonstrating intermediate intensity articular cartilage (black arrow) and hypointense meniscus (white arrow)
Typical parameters for a PD-weighted sequence: TE < 30, TR > 1,000, flip angle 90 (Helms et al. 2009).
5.4 Fast Spin Echo (FSE)
Imaging times are reduced by using fast or turbo spin echo sequences, which can produce T1, T2 and proton density-weighted images.
Multiple RF pulses (and therefore multiple echoes) are produced during every TR. Each echo has a different TE, and the number of echoes produced for each TR determines the echo train length (ETL). A FSE sequence with an ETL of 8 will produce an image in 1/8 of the time of a conventional spin echo sequence (CSE). The reduction in scan times allows the matrix size to be increased, resulting in improved spatial resolution. FSE sequences are less sensitive to metallic artefact and patient movement artefact than CSE.
Disadvantages of FSE sequences include increased fat signal on T2W sequences which may require fat suppression (particularly in the subcutaneous fat), an increased susceptibility to flow artefacts, blurring at tissue margins (particularly problematic with a high ETL) and reduced conspicuity of haemorrhage (Helms et al. 2009).
Typical parameters of FSE T2-weighted sequence: TE: > 60, TR > 2,000, flip angle 90, ETL 2–16 (Helms et al. 2009).
5.5 Fat Suppression
There are situations where it is advantageous to reduce (suppress) the bright signal produced by fat on T1- and T2-weighted images. This may be to confirm the presence of fat within a lesion, distinguish between fat and haemorrhage or to increase the conspicuity of fluid, oedema or contrast agents. T1-weighted fat saturation is routinely used pre- and post-IV contrast administration to identify areas of tissue enhancement.
The technique used depends on the specific tissue and the clinical situation.
Frequency-selective fat suppression exploits the differences in the resonant frequency of protons in fat compared to that of protons in water: at 1.5T, fat protons precess at a frequency 225 Hz slower than water protons.
This technique achieves fat saturation by applying a RF pulse at the same frequency as the precessing fat protons, followed by a ‘spoiler’ pulse at the resonant frequency of fat, which removes its signal. Frequency-selective fat suppression can be used with any imaging sequence and with gadolinium contrast agents. However, the technique can only be used at field strength in excess of 1T and is prone to inhomogeneities in fat suppression (Delfaut et al. 1999).
5.5.1 Inversion Recovery
Inversion recovery (IR) sequences homogeneously suppress signal from specific tissue types. IR exploits the different T1 between adipose tissue and water.
STIR (short tau inversion recovery) sequences are frequently used in MSK imaging, where suppression of fat leads to increased conspicuity of fluid and oedema within bones and soft tissues (Fig. 7.4). The fat suppression achieved is less susceptible to magnetic field inhomogeneities, is the preferred method of fat suppression for minimising metallic artefact (Vandevenne et al. 2007) and can be used at lower magnetic field strengths. However, the suppression achieved is not specific for fat alone and as a result may also lead to suppression of proteinaceous fluid, mucoid tissue, haemorrhage and gadolinium. Thus, STIR sequences should not be used with contrast agents.

Sagittal T1W (a), T2W (b) and STIR (c) images of the lumbar spine. The bone marrow oedema surrounding the compression fracture of L5 is most obvious on the STIR sequence (arrow)
Fluid attenuated inversion recovery (FLAIR) sequences are used as a sensitive sequence for the detection of pathology in the CNS, as the signal from CSF is suppressed, making hyperintense periventricular and spinal cord lesions more conspicuous.
Typical parameters for FSE STIR sequence: TE > 60, TR > 2,000, TI 120–150, flip angle 180–90, ETL 2–16 (Helms et al. 2009).
Opposed phase imaging relies on the fact that protons in fat and water will not be in exactly the same position or phase during precession, due to differences in their resonant frequencies. This technique is good for detecting lesions containing small amounts of fat or water, for example, in adrenal adenomata (Vandevenne et al. 2007).
5.6 Gradient Echo
Gradient echo (GE) sequences use a magnetic gradient to reduce magnetic field inhomogeneities, in contrast to spin echo sequences where an additional 180° RF pulse is used for this purpose. GE sequences are generally faster to acquire than spin echo sequences.
GE is typically used to produce a sequence with similar weighting to a standard T2W sequence. This is termed T2*, and although fluid and oedema return a high signal, the appearance of other tissues may differ from that of a standard T2W sequence.
T1W and PD-like sequences can be produced: as in the T2* sequence, the tissue weighting is dependent on TR, TE and the ‘flip angle’.
GE sequences are used for optimal imaging of menisci, articular cartilage, labrum and ligaments. Three-dimensional (volume) acquisitions can also be obtained using GE, particularly useful in small joints such as the wrist (Fig. 7.5). Other advantages include the increased conspicuity of haemorrhage, haemosiderin-laden synovium in pigmented villonodular synovitis (PVNS) (Fig. 7.5c), loose bodies or gas. Thin section fat-suppressed gradient echo sequences have been shown to be more sensitive than fat-suppressed T1-weighted images for detecting labral tears in direct arthrography of the shoulder. T1W sequences were more specific in delineating the tears, suggesting the need for multisequence imaging (Lee et al. 2008).

Gradient echo sequence. (a) Image of the wrist, demonstrating the scapholunate ligament (arrow). (b) Axial image of the glenohumeral joint demonstrating articular cartilage (arrow). (c) Gradient echo T2* axial image through the patellofemoral joint showing hypointense synovial thickening in a patient with diffuse PVNS (arrow)
Disadvantages of GE sequences include increased metallic artefact, poor demonstration of marrow pathology in the absence of trabecular destruction and overestimation of the size of osteophytes in the spine (Helms et al. 2009).
Typical parameters for GE T1 sequence: TE variable, TR < 30, flip angle 70–110
Typical parameters for GE T2* sequence: TE variable, TR < 30, flip angle 5–20 (Helms et al. 2009).
5.7 Diffusion-Weighted Sequences
In diffusion-weighted MRI (DWI-MRI), the signal intensity of a tissue is determined by the degree of Brownian motion of water molecules when a magnetic field gradient is applied. DWI provides information regarding tissue cellularity and cell membrane integrity and is already an established imaging sequence used in the assessment of brain lesions. DWI is gaining acceptance in MSK imaging as an aid to help distinguish between malignant and non-malignant lesions, including benign osteoporotic collapse vs. malignant vertebral compression fractures and benign vs. malignant soft tissue tumours (Karchevsky et al. 2008). Malignant tissues show restricted diffusion due to the high cellularity of tumour tissue, irrespective of the degree of associated oedema and necrosis (Fig. 7.6). There is some controversy in the literature regarding accuracy of DWI sequences for differentiating between TB spondylodiscitis and malignancy in the spine, although it appears that DWI can be used as a tool to help differentiate between pyogenic osteomyelitis and malignancy (Herneth et al. 2008).

(a) Coronal T1W image of the sacrum showing ill-defined hypointensity (arrow). (b) Axial DWI of the pelvis showing marked hyperintensity (restricted diffusion) in the sacrum of the same patient (arrow), confirming the presence of sacral metastases. An insufficiency fracture of the sacrum would show bone marrow oedema but would not show restricted diffusion
6 Contrast-Enhanced MRI
Gadolinium (Gd) is a paramagnetic agent used to produce intravascular, intralesional or intra-articular enhancement. When in solution, it works by reducing the T1 relaxation time of adjacent water protons, leading to an increase in signal on T1W sequences. Gd is a metal that binds to membranes and cannot be excreted in its unchelated form. To allow its excretion from the body, gadolinium must be chelated with other compounds, such as the ligand diethylenetriaminepentaacetic acid to form Gd-DTPA.
Side effects of IV Gd-DTPA are uncommon but include nausea and vomiting, hypotension, headache, rash and a transient rise in serum bilirubin and ferritin. Nephrogenic systemic fibrosis (NSF) is a rare but serious complication following the administration of intravenous gadolinium to patients with poor renal function or in renal failure. It starts as red, painful swellings on the arms and legs, which may progress to form fibrotic lesions in the skin, subcutaneous tissues and internal organs. NSF may be fatal in severe cases: renal impairment must be excluded with serum creatinine and GFR measurement in patients over the age of 60 or those considered to be at risk of renal failure, prior to administration of Gd-DTPA.
6.1 Intravenous Contrast
IV gadolinium is used to differentiate between solid and cystic structures (Fig. 7.7), necrotic vs. viable tissue, oedema vs. abscesses and recurrent disc herniation vs. scar tissue in the postoperative spine. The degree of contrast enhancement of tissues depends on their relative vascularity. T1 fat-suppressed images both pre-contrast and post-contrast administration are obtained.

Intravenous contrast enhancement. (a) Axial T1W image of the proximal thighs showing a hypointense mass in the anterior aspect of the right thigh (arrow). (b) IV contrast-enhanced T1W fat-saturated image demonstrating peripheral enhancement (black arrow), with no central enhancement (white arrow) confirming a solid periphery and necrotic centre. Axial T1 weighted (c) and axial T1 weighted fat-suppressed image post IV gadolinium (d) of a solid mass in the left axilla, showing uniform post-contrast enhancement (arrow)
6.2 MR Arthrography
Indirect MR Arthrography: IV gadolinium is administered, with imaging performed after 10 min of exercise of the joint under investigation. While this technique lacks the capsular distension of direct arthrography, it is more sensitive than non-enhanced MRI for the detection of rotator cuff tears, meniscal tears and cartilage pathology.
Direct MR Arthrography: The joint is distended with an intra-articular injection of a dilute solution of gadolinium (if a T1W fat-saturated sequence is used) or saline (with T2W fat-saturated imaging). A direct arthrogram optimally delineates fibrocartilage, ligamentous and articular cartilage tears, for example, in the shoulder, hip and wrist joints (Fig. 7.8). T2W fat-saturated images in the presence of an effusion also result in good visualisation of the labrum and ligamentous structures, without administration of intra-articular contrast.

T1W fat-saturated axial direct arthrogram of the glenohumeral joint showing a Bankart lesion (arrow)
MR Angiography: Flowing blood produces ‘flow voids’ on standard MR sequences, with vessels commonly appearing as low signal structures. However, selective MR imaging of vessels can be achieved using intravenous gadolinium, combined with T1-weighted sequences (Fig. 7.9), or alternatively time of flight (TOF) and phase contrast techniques which allow sensitive and reliable vascular imaging, without the need for administration of IV contrast.

MR angiogram (TRICKS) of both thighs showing the distal superficial femoral arteries, the popliteal arteries and the arterial trifurcations
7 MRI Appearances of Musculoskeletal Tissues
7.1 Bone
Cortical bone contains few mobile protons and as a result is black on all imaging sequences (Fig. 7.10).

Axial T1W image of the left glenohumeral joint, showing hyperintense fatty marrow in the humeral head (black arrow) and hypointense glenoid cortex (white arrow)
Marrow contains varying amounts of fatty marrow and haematopoietic marrow, depending on the age of the patient and the presence of any marrow reconversion.
Fatty marrow is hyperintense on T1W, while haematopoietic marrow is slightly hypointense to fat on T1W and slightly hyperintense to muscle on all sequences.
Fat-suppressed sequences (STIR, T2 and PD fat saturated) are the most sensitive means of identifying pathology within fatty marrow and adipose tissue, which appears as areas of loss of fat suppression (bright signal) at sites of pathology. Loss of normal fatty marrow signal on T1-weighted sequences also indicates pathology (Fig. 7.4).
7.1.1 Bone Tumours
While primary bone tumours are relatively rare, secondary or metastatic bone lesions are a common clinical presentation. MRI is a useful tool to establish the extent of involvement of the bone and adjacent soft tissues, in conjunction with other modalities. However, appearances of bone lesions are frequently non-specific, and it is often difficult to differentiate between various tumour types, or even to differentiate between tumour and infection. For this reason, bone tumour diagnosis is frequently made by multimodality imaging, supplemented with a bone biopsy. Common MRI findings, regardless of the nature of the bone tumour, are T1 hypointense/intermediate intensity and T2 and STIR hyperintense (Fig. 7.11). Necrosis, haemorrhage and neurovascular invasion are more typical of malignant lesions.

Coronal imaging of a spindle cell sarcoma in the distal femur. STIR sequence (a), T1weighted non-contrast (b), and T1 weighted post-IV gadolinium (c) showing post contrast enhancement of the tumour in c
7.1.2 Osteomyelitis
Acute osteomyelitis must be diagnosed and treated early to prevent long-term complications. Spread of infection to the bone may be haematogenous, contiguous or by direct implantation. Patterns of spread and location of the primary lesion within the bone depend on the age and immune status of the patient, anatomical site and to some extent, the type of infection (Fig. 7.12a).

(a) Sagittal T2W image of the thoracolumbar spine, showing abscess formation (black arrowhead), vertebral collapse (black arrow) and bone marrow oedema (white arrows) secondary to multilevel spinal TB infection. (b) Coronal STIR image of the hip joints in a patient with right hip septic arthritis, showing a joint effusion (black arrow) and bone marrow oedema of the right femoral head and neck (white arrow). (c) Coronal STIR image showing the fluid signal intensity centrally with surrounding marrow oedema. Figure 7.12d: T1 coronal image without contrast, demonstrating the T1 hyperintense penumbra peripherally (arrow)
MRI is the most sensitive tool for the early detection of osteomyelitis, with the T2 and STIR hyperintense disease indicators visible days before any abnormality is seen on ultrasound, CT or plain radiographs. A normal MRI has a negative predictive value of virtually 100 % for osteomyelitis (Helms et al. 2009). Sensitivity ranges between 53 and 94 %.
Elevation of the hypointense periosteum occurs as the disease progresses and the intraosseous pressure increases. Eventually, cortical disruption occurs, and a T2W/STIR hyperintense cloaca, abscess cavity or sinus tract may develop. A Brodie’s abscess is a subacute bone abscess, often occuring in the metaphyseal regions of the lower limbs, and sometimes extending into the epiphysis. Typical findings are of a fluid signal intensity lesion, with a T1 hyperintense margin (penumbra), and a sclerotic hypointense rim (Fig. 7.12c and d) Intravenous contrast enhancement assists with the differentiation between oedema and an abscess, the latter demonstrating peripheral capsular enhancement, with a non-enhancing centre. Bone marrow inflammation without infection frequently displays uniform enhancement post-IV gadolinium contrast.
Chronic recurrent multifocal osteomyelitis (CRMO) is a disorder most common in adolescents and young adults, with some imaging features suggestive of chronic osteomyelitis, but with no sequestrum or cloaca formation and no organism cultured on microbiological analysis (Jurik and Egund 1997).
7.1.3 Septic Arthritis
Septic arthritis should always be considered in the presence of a monoarthritis. MRI findings of septic arthritis are non-specific and include a joint effusion and enhancing thickened synovium. T2/STIR hyperintensity in the adjacent bone and soft tissues is particularly suggestive of a septic arthritis (Fig. 7.12b).
7.1.4 Avascular Necrosis (AVN)
Many causes of bone infarction are recognised, including trauma, steroids, sickle cell disease, Gaucher’s disease and alcoholism. Resulting osteonecrosis may occur at any site within the bone and is commonly termed AVN when present in the epiphysis. Areas with a greater proportion of the relatively avascular fatty marrow are more commonly affected, such as the diametaphyses and epiphyses (Helms et al. 2009).
MRI is the most sensitive imaging technique for early detection of AVN, and the appearances vary according to the stage of the lesion. MRI abnormalities may be evident in asymptomatic lesions (Fordyce and Solomon 1993). Marrow oedema is seen as high signal on T2W FS and intermediate signal on T1W images early in the disease, with a serpiginous geographical appearance developing later. Joint effusions are usually present in cases of acute AVN.
In 80 % of cases of AVN, a high signal intensity line develops on T2W images (Helms et al. 2009), adjacent to a low signal serpiginous line, producing a ‘double line sign’. Sclerosis and collapse of infarcted bone occur late in the disease process, appearing as hypointense on all sequences (Fig. 7.13).

(a) Coronal T1W image of the proximal femora in a patient on high-dose steroids, showing the serpiginous hypointense line secondary to bilateral AVN of the femoral heads (arrows). (b) T2W fat-suppressed coronal image of the same patient showing a joint effusion (white arrow), proximal femoral bone marrow oedema (black arrow) and a hypointense serpiginous line (black arrowhead)
7.2 Synovium
Normal synovium is not usually visualised on MRI and is usually only identifiable when it is thickened. T1W post-IV gadolinium sequences are the most sensitive for identifying synovial pathology (Fig. 7.14).

Axial T1 weighted non-contrast (a), and axial T1 weighted post IV gadolinium (b) showing synovial thickening and enhancement (arrow)
7.3 Cartilage
Articular cartilage appears as dark grey on STIR and T2W fat-saturated images and slightly brighter signal on PDW fat-saturated images, which allows easy distinction between cartilage and joint fluid (Fig. 7.15).

Sagittal PDW fat-suppressed image of the knee, showing normal articular cartilage (white arrow) and a focal osteochondral lesion (black arrow)
Normal articular cartilage is hyperintense on gradient echo fat-saturated images, and as a result, focal defects or thinning is easily identified. 3D gradient echo sequences are particularly helpful for identifying small defects.
7.3.1 Fibrocartilage
The normal meniscus is hypointense on all sequences: hyperintensity in a meniscus is abnormal, with the exception of children and young adults in whom the peripheral meniscus may contain areas of intermediate-high signal, as a result of normal vascularity.
7.3.2 Meniscal Pathology
Meniscal pathology is best evaluated on T1W, gradient echo T2* and spin echo PDW sequences. A meniscal tear is seen as a linear area of high signal extending to an articular surface. Meniscal tears may have oblique, radial, horizontal, vertical or ‘bucket handle’ morphology (Fig. 7.16). Increased signal intensity within a meniscus that does not extend to an articular surface is not defined as a tear but is termed ‘intrasubstance or myxoid degeneration’.

Sagittal PD FS image of the knee showing a complex medial meniscal tear, involving a radial tear of the body (black arrow) and an oblique tear of the posterior horn (white arrow)
A ‘discoid’ meniscus has a body that is rounder that the usual C-shape. They occur in approximately 3 % of the population, most commonly involving the lateral meniscus. Discoid menisci are more prone to cystic degeneration and tears than a normal meniscus and are seen as a thickened ‘bow tie’ on more than three successive 4-mm sagittal slices.
7.3.3 Labral Pathology
Labral pathology is best demonstrated with an MR arthrogram (T1W with fat saturation following intra-articular injection of dilute gadolinium (Fig. 7.17) or T2W fat-saturated images if saline has been injected).

Coronal MR arthrogram of the right hip without fat saturation showing a labral tear (arrow)
7.4 Ligaments and Tendons
Normal ligaments and tendons are generally hypointense on all MR sequences, although some structures such as the normal ACL and quadriceps tendon may have a striated appearance (Fig. 7.18a). T1W, T2W, PDW FSE and gradient echo T2* are useful sequences to assess these structures.
Ligament and tendon tears may be partial or complete. Partial tears appear as thickened structures which contain areas of increased signal but are in continuity. Complete tears show discontinuity of the structure with or without retraction of the torn ends (Fig. 7.18b).

(a) Sagittal proton density image of the knee, showing the normal striated appearance of the anterior cruciate ligament (arrow). (b) Sagittal T1W image of the ankle, showing a full thickness tear of the Achilles tendon, with retraction of the torn tendon ends (arrows)
7.5 Muscle
Normal muscle has a striated appearance on MRI; is of intermediate signal intensity on T1W, STIR and PDW images; and is relatively hypointense on T2W FSE sequences.
Muscle tears most frequently occur at the musculotendinous junction but can occur anywhere within the muscle and may extend between adjacent muscles (Fig. 7.19). They are graded depending on their severity:

Muscle tears. (a) Axial STIR image of the left thigh showing a grade 1 tear of the biceps femoris muscle (arrow). (b) Axial STIR image through the proximal thighs showing a grade 2 tear of the right adductor muscles (arrow). (c) Coronal STIR image of the right lower leg, showing a grade 3 tear of the right peroneus brevis muscle (arrow)
-
Grade 1: Few fibres torn and a minor amount of interstitial haemorrhage
-
Grade 2: Muscle partially torn, with reduced function and haemorrhage at the site of injury, with possible extension between muscles
-
Grade 3: Complete rupture of the entire muscle, with haemorrhage and complete loss of muscle function
In the acute and subacute phase, a haematoma is usually present, although it may have resolved in the case of a chronic tear.
The MRI appearance of a muscle tear depends on the age and severity of the injury: subacute blood is relatively hyperintense on T1W images, while haemosiderin from an older lesion is typically hypointense on T1 and T2W sequences (Table 7.1). The use of fat-saturated images will avoid misinterpretation of fat as an area of haemorrhage.
7.6 Intervertebral Discs
The normal intervertebral disc consists of an outer annulus fibrosus, which is hypointense on all imaging sequences, and an inner nucleus pulposus, consisting of proteoglycans, water and collagen.
On T2W sequences, the nucleus pulposus is uniformly hyperintense on each side of a horizontal hypointense intranuclear cleft that typically appears by the fourth decade of life (Saifuddin 2008). Normal intervertebral discs are of intermediate signal intensity on T1W sequences and should appear hypointense to the bone marrow and of a similar intensity to muscle. On T1W images, the nucleus and annulus are not reliably distinguished. Abnormal discs may contain an annular tear, seen as a focus of T2-hyperintensity, or may be dehydrated and of low signal intensity on T2W sequences. Disc bulges, protrusions, extrusions and sequestrations may occur (Fig. 7.20). When the bone marrow is hypointense compared to the adjacent intervertebral disc on T1W images, haematological malignancy must be suspected.

Sagittal T2W image of the cervical spine, showing a large intervertebral disc protrusion (arrow), resulting in significant narrowing of the spinal canal
7.7 Soft Tissue
7.7.1 Soft Tissue Tumours
The majority of soft tissue masses are benign, with soft tissue sarcomas accounting for only 1 % of all soft tissue masses. The likelihood of malignancy increases in elderly patients, or if the mass has rapidly increased in size, is painful, larger than 5 cm in diameter and is located deep to the fascia.
Necrosis, neurovascular involvement, crossing the fascia and the formation of an obtuse angle between the mass and the fascia are also suggestive of malignancy. Rapid enhancement post-IV gadolinium indicates neovascularity and is more suggestive of a malignant lesion.
Soft tissue masses are frequently hyperintense on T2W sequences and of low or intermediate signal intensity on T1W, although there is considerable overlap.
-
Soft tissue lesions which may be hyperintense on T1W sequences include lipoma, hibernoma, well-differentiated liposarcoma (Fig. 7.21) and a subacute haematoma.
Fig. 7.21 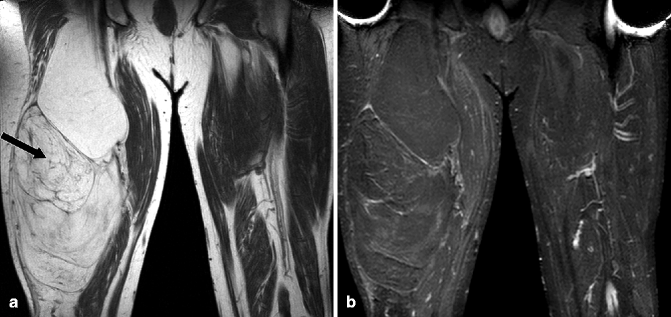
(a) Coronal T1W image of the anterior thighs, showing a hyperintense fatty lesion of the right thigh (arrow). The lesion showed imcomplete and inhomogeneous fat suppression on the STIR sequence (b). Biopsy confirmed a well-differentiated liposarcoma
-
Lesions which may contain low signal on T2W include PVNS, giant cell tumour of tendon sheath, fibromatosis, chronic haematoma and amyloid.

MRI narrows the differential diagnosis of a mass lesion, but biopsy and histological analysis are frequently required to give a definitive diagnosis.
7.7.2 Soft Tissue Infection
MRI is a highly sensitive modality for the detection of soft tissue infection.
Cellulitis appears as a reticular pattern of T1W hypointensity/T2W hyperintensity of the subcutaneous tissues. Enhancement may occur on post-contrast imaging.
Pyomyositis is usually due to Staphylococcus aureus infection and initially manifests as focal muscle oedema and swelling, followed by abscess formation, seen as focal T2W/STIR hyperintense lesions, with rim enhancement.
Necrotising fasciitis is a rare and frequently fatal infection of subcutaneous tissues, with MRI findings of T2 hyperintensity in the subcutaneous tissues and fascial planes. Abnormal areas show post-contrast enhancement, although necrotic tissue will not enhance. Gas within the soft tissues is seen as foci of low signal on all sequences.
8 Interventional MRI
Historically, the lack of real-time imaging capabilities has limited the suitability of MRI as an interventional imaging technique. MR-guided biopsy, MR-guided focused ultrasound and laser ablation procedures and real-time MR-guided interventional vascular and neurosurgical procedures are now being performed in specialist centres (Kos et al. 2008). Some neurosurgical and vascular operating theatres are equipped with an MRI scanner within the theatre, and the patient can simply be moved into the scanner when imaging is required. While some vascular procedures can be performed in a closed scanner, real-time interventional MRI typically requires an open style of scanner to allow the operator direct access to the patient. All devices and instruments must be non-ferromagnetic and should produce minimal artefact.
9 Spectroscopy
MR spectroscopy is a technique that allows non-invasive examination of organ and cell metabolism. It is most commonly employed in central nervous system (CNS) imaging to investigate malignancy, necrosis, localised brain activity and chronic disorders such as Alzheimer’s disease and multiple sclerosis. MR spectroscopy can also be used to investigate musculoskeletal malignancy and cartilage pathology, with many techniques still in the research stage but with promising early results.
1H-MR Spectroscopy: We have discussed how exploitation of the slight variations in the resonant frequency and phase of precessing protons within water and fat molecules allows fat-saturation techniques to be performed. Using similar principles, 1H-MR (or proton) spectroscopy can identify relative quantities of hydrogen-containing molecules within the body. In vivo spectroscopy uses gradients to selectively excite a small volume of tissue. The free induction decay produces spectra instead of images, with each peak specific for a particular metabolite. Clinically relevant metabolites that are measured with in vivo 1H-MR spectroscopy include:
-
Lactate – specific marker of cell death and necrosis
-
N-acetyl aspartate – reduced in the presence of neuronal disease
-
Glutamine and glutamate complex – relate to liver function
-
Creatine – may be elevated in malignancy
-
Choline – may be elevated in malignancy
-
Myo-inositol – may be elevated in the brain in Alzheimer’s disease and malignant tumours (McRobbie et al. 2007)
A recent preliminary 1H-MR spectroscopy study looking at choline levels and the choline/creatine ratios in benign and malignant bone and soft tissue tumours achieved an accuracy rate of 91 % in distinguishing between benign and malignant lesions (Qi et al. 2009).
Sodium Spectroscopy: Proteoglycans and collagen are important constituents of articular cartilage. Loss of proteoglycans results in failure of the articular cartilage, leading to chondral thinning, chondromalacia and arthritis.
Proteoglycans have a net negative charge, which attract positively charged sodium ions (Shapiro et al. 2000; Borthakur et al. 2000). As a result, the amount of articular cartilage present can be indirectly measured by evaluating sodium ion concentration using sodium spectroscopy. Abnormalities in the articular cartilage can be identified before any pathology is identified with standard MRI. This technique is also useful for evaluating the success of chondral and osteochondral implants. Different RF coils and imaging protocols are required for sodium spectroscopy.
10 3T MRI
3T MRI scanners are becoming increasingly common in routine clinical practice and can produce images with excellent resolution, increased SNR and shortened acquisition time. The benefits of imaging at a higher field strength are most striking in 3T MRI of articular cartilage, menisci, labrum and ligaments (Ramnath 2006; Mosher 2006).
The increased magnetic field can produce images with slightly altered tissue contrast when compared to standard 1.5T images: in particular, images with longer T1 weighting are obtained, which radiologists must be aware of when moving from 1.5T to 3T. Enhanced MRI can be performed with a reduction of approximately 50 % of the contrast dose.
Excellent sensitivity and resolution of spectroscopy can be achieved at 3T. More peaks are identified, and there is a marked improvement in the separation of the peaks, thereby increasing the diagnostic sensitivity. The imaging time for MR spectroscopy is also reduced at 3T, with spectra obtained in 2–3 min.
11 Upright MRI
Upright MRI scanners allow patients to be scanned in standing and sitting positions, unlike standard MRI scans, which are usually performed with the patient lying prone or supine. This technique is of particular value in patients with posture-dependent symptoms, in whom the degree of spondylolisthesis or disc protrusion may vary with position (Fig. 7.22) (Alyas et al. 2008, 2010).

Sagittal T2W images of the lumbar spine supine and standing. (a) shows a small spondylolisthesis (arrow) on a supine scan. On standing (b), there is a reduction in the AP dimensions of the spinal canal (arrow) as a result of the increased lumbar lordosis, buckling of the ligamentum flavum, and a slight increase in the spondylolisthesis
As upright MRI machines have an open design, they are suitable for claustrophobic patients. They often have a higher maximum weight limit than standard MRI tables.
Disadvantages of the upright MRI scanners include a low magnetic field strength and limited availability, with only two such facilities currently available in the UK.
12 Pitfalls of MR Imaging of the MSK System
It is important to use appropriate imaging planes and sequences relevant to the pathology and tissue type of interest (Tables 7.2 and 7.3).
‘Magic angle’ artefact can cause erroneous interpretation of pathology in a normal structure. It causes apparent hyperintense pathology in ligaments, tendons or menisci which lie at 55° to the main magnetic field on T1W, PDW and most GE sequences. Pathology can be excluded and magic angle phenomenon confirmed when normal appearances are seen on T2W sequences.
Metallic artefact may obscure a lesion or produce images suggestive of a lesion in a normal study (Fig. 7.23). Avoiding sequences which increase the metallic artefact (such as Gradient echo) and cautious interpretation of tissues adjacent to metallic structures should minimise errors of interpretation.

Sagittal PDW image of the knee showing metallic artefact (arrows) resulting from screws within the proximal tibia
13 MRI Safety
Patient safety is of paramount importance in the MRI department. Ferromagnetic objects must not be taken into an MRI scanner, as they can fly into the magnetic field at high speed, causing death or injury to patients and staff, as well as damage to the MRI scanner. Such items include scissors, oxygen cylinders and other non-MR-safe medical equipment.
Patients with medical devices or implants should not be scanned unless the device is identified and known to be MR-safe.
MRI is contraindicated in patients with the following devices/implants:
-
Pacemakers are contraindicated. Pacemakers may even be affected by the magnetic field outside the scanning room. The potential consequences include heating, arrhythmia and death.
-
Spinal cord stimulators.
-
Cochlear implants.
-
Infusion catheters.
-
Metallic fragments in the eyes.
-
Shrapnel in the body, depending on the site, nature and field strength involved – caution is advised (Eshed et al. 2010).
-
Aneurysm clips, depending on MR compatibility of the clips and institutional protocols.
While there are no reports of foetal or maternal harm following an MRI, scanning is usually avoided in pregnancy, particularly during the period of organogenesis in the first trimester. It is not known to what impact the heating effect and noise have on the developing foetus. However, an MRI should be performed when the benefit outweighs the potential risk, and MRI is being increasingly used as a tool for assessment of foetal birth defects in utero. Gadolinium should not be administered during pregnancy (Chen et al. 2008).
Orthopaedic implants are usually MR-safe but not necessarily MR-compatible (i.e. they cause artefact that distorts the image). Many devices are now made of titanium, which causes less artefact than stainless steel devices. Details of the orthopaedic implant are recorded at the time of surgery, and MR compatibility can be checked prior to a scan. If there is any doubt, do not proceed with the scan. Halos and Ilizarov frames are circular structures around which induced currents can flow, leading to heating, and patients with these devices should not undergo an MRI scan.
References
Alyas F, Connell D, Saifuddin A (2008) Upright positional MRI of the lumbar spine. Clin Radiol 63(9):1035–1048
Alyas F, Sutcliffe J, Connell D, Saifuddin A (2010) Morphological change and development of high-intensity zones in the lumbar spine from neutral to extension positioning during upright MRI. Clin Radiol 65(2):176–180
Borthakur A, Shapiro EM, Beers J, Kudchodkar S, Kneeland JB, Reddy R (2000) Sensitivity of MRI to proteoglycan depletion in cartilage: comparison of sodium and proton MRI. Osteoarthritis Cartilage 8:288–293
Bradley WG (1997) Use of gadolinium chelates in MR imaging of the spine. J Magn Reson Imaging 7:38–46
Chen MM, Coakley FV, Kaimal A, Laros RK Jr (2008) Guidelines for computed tomography and magnetic resonance imaging use during pregnancy and lactation. Obstet Gynecol 112(2 Pt 1):333–340
Delfaut EM, Beltran J, Johnson G, Rosseau J, Marchandise X, Cotton A (1999) Fat suppression in MR imaging: techniques and pitfalls. Radiographics 19:373–382
Eshed I, Kushnir T, Shabshin N, Konen E (2010) Is magnetic resonance imaging safe for patients with retained metal fragments from combat and terrorist attacks? Acta Radiol 51(2):170–174
Farr RF, Allisy-Roberts PJ (1999) Physics for medical imaging. WB Saunders, Philadelphia
Fordyce MJF, Solomon L (1993) Early detection of avascular necrosis of the femoral head by MRI. J Bone Joint Surg Br 75:365–367
Glickstein MF, Sussman SK (1991) Time dependent scar enhancement in magnetic resonance imaging of the post-operative lumbar spine. Skeletal Radiol 20(5):333–337
Helms C, Major NM, Anderson MW, Kaplan PA, Dussault R (2009) Musculoskeletal MRI, 2nd edn. Saunders/Elsevier, Philadelphia
Herneth AM, Friederich K, Weidekamm C, Schibany N, Krestan C, Kainberger F (2008) Diffusion weighted imaging of bone marrow pathologies. Eur J Radiol 3:74–83
Jurik AG, Egund N (1997) MRI in chronic, recurrent, multifocal osteomyelitis. Skeletal Radiol 26:230–238
Karchevsky M, Babb J, Schweitzer ME (2008) Can diffusion-weighted imaging be used to differentiate benign from malignant pathological fracture: a meta analysis. Skeletal Radiol 37:791–795
Kos S, Huegli R, Bongartz GM, Jacob AL, Bilecen D (2008) MR-guided endovascular interventions: a comprehensive review on techniques and applications. Eur Radiol 18(4):645–657
Lee MJ, Motamedi K, Seeger LL (2008) Gradient-recalled echo sequences in direct shoulder MR arthrography for evaluating the labrum. Skeletal Radiol 37(1):19–25
McRobbie DW, Moore EA, Graves MJ, Prince MR (2007) MRI from picture to proton. Cambridge University Press, Cambridge
Mosher TJ (2006) Musculoskeletal imaging at 3T: current techniques and future applications. Magn Reson Imaging Clin N Am 14(1):63–76
Qi ZH, Li CF, Li ZF, Zhang K, Wang Q, Yu DX (2009) Preliminary study of 3T 1H MR spectroscopy in bone and soft tissue tumors. Chin Med J (Engl) 122(1):39–43
Ramnath RR (2006) 3T MR imaging of the musculoskeletal system (part II): clinical applications. Magn Reson Imaging Clin N Am 14(1):41–62
Saifuddin A (2008) Musculoskeletal MRI. Hodder Arnold, London
Shapiro EM, Borthakur A, Dandora R, Kriss A, Leigh JS, Reddy R (2000) Sodium visibility and quantitation in intact bovine articular cartilage using high field 23Na MRI and MRS. J Magn Reson 142:24–31
Spouse E, Gedroyc WM (2000) MRI of the claustrophobic patient: interventionally configured magnets. Br J Radiol 73:146–151
Stover B, Sigmund G, Langer M, Brandis M (1994) MRI in diagnostic evaluation of osteomyelitis in children. Eur Radiol 4(4):347–352
Vahlensieck M, Sommer T, Indirect MR (1996) Indirect MR arthrography of the shoulder. An alternative to direct MR arthrography? Radiologe 36(12):960–965
Vandevenne JE, Vanhoenacker FM, Parizel PM, Butts Pauly K, Lang PK (2007) Reduction of metallic artifacts on musculoskeletal MR imaging. JBR-BTR 90:345–349
Westbrook C (2002) MRI at a glance. Blackwell Science, Oxford
Author information
Authors and Affiliations
Corresponding author
Editor information
Editors and Affiliations
Rights and permissions
Copyright information
© 2012 Springer-Verlag Berlin Heidelberg
About this chapter
Cite this chapter
Tyler, P., Butt, S. (2012). Basic Principles of MRI. In: Fogelman, I., Gnanasegaran, G., van der Wall, H. (eds) Radionuclide and Hybrid Bone Imaging. Springer, Berlin, Heidelberg. https://doi.org/10.1007/978-3-642-02400-9_7
Download citation
DOI: https://doi.org/10.1007/978-3-642-02400-9_7
Published:
Publisher Name: Springer, Berlin, Heidelberg
Print ISBN: 978-3-642-02399-6
Online ISBN: 978-3-642-02400-9
eBook Packages: MedicineMedicine (R0)