
Abstract
This chapter gives an overview of the research and development approach in the automotive industry. Therefore, Sect. 3.1 focuses on the automotive development process, specifically the complexity involved in developing a new vehicle model, an elaborate process involving thousands of engineering staff employed by the automaker and its Tier 1 suppliers. This section describes on proven processes and new technologies, such as the Stage-Gate® controlled development process, the digital mock-up process, requirements engineering with regard to automotive electrical/electronic (E/E) systems (see Chap. 4), and the diverse disciplines that enable new product creation processes which lead to constantly shrinking development times, better maturity, and overall product quality. The focus in Sect. 3.2 is on modularization and platforms used in the automotive industry which will allow to cope with an ever-increasing multibrand vehicle model line. In Sect. 3.3, virtual product creation is introduced which integrates the product data management concept to fully achieve the required computer-aided design (CAD)-based development pipeline as an integrated CAD format. Section 3.4 introduces the idea of product life cycle management, an approach that facilitates collaborative work processes for the various phases of the product or system life cycle represented by a number of phases and activities spread out across the automakers organization and its suppliers, each of which builds on the results of the preceding phase or activity. The sum of all these activities is called the product or system life cycle, which can be described using a model that contains the conceptualization phase, the utilization phase, the evolution phase, and the ultimate disposal phase. Section 3.5 contains a comprehensive set of questions on automotive research and development, while the final section includes references and suggestions for further reading.
Access provided by Autonomous University of Puebla. Download chapter PDF
This chapter gives an overview of the research and development approach in the automotive industry . Therefore, Sect. 3.1 focuses on the automotive development process , specifically the complexity involved in developing a new vehicle model , an elaborate process involving thousands of engineering staff employed by the automaker and its Tier 1 suppliers . This section describes proven processes and new technologies, such as the Stage-Gate® controlled development process , the digital mock-up process, requirements engineering with regard to automotive electrical/electronic (E/E) systems (see Chap. 4), and the diverse disciplines that enable new product creation processes which lead to constantly shrinking development times, better maturity , and overall product quality . The focus in Sect. 3.2 is on modularization and platforms used in the automotive industry which will allow to cope with an ever-increasing multibrand vehicle model line . In Sect. 3.3, virtual product creation is introduced which integrates the product data management concept to fully achieve the required computer-aided design (CAD)-based development pipeline as an integrated CAD format . Section 3.4 introduces the idea of product life cycle management , an approach that facilitates collaborative work processes for the various phases of the product or system life cycle represented by a number of phases and activities spread out across the automakers organization and its suppliers, each of which builds on the results of the preceding phase or activity. The sum of all these activities is called the product or system life cycle, which can be described using a model that contains the conceptualization phase , the utilization phase , the evolution phase , and the ultimate disposal phase . Section 3.5 contains a comprehensive set of questions on automotive research and development, while the final section includes references and suggestions for further reading.
3.1 The Automotive Development Process
The automotive development process ranges from the first vehicle idea to the final automotive prototype with the following main objectives:
-
Develop the vehicle to match or exceed customer requirements
-
Develop the vehicle as soon as possible
-
Utilize the invested resources as efficiently as possible
These objectives are related to the value creation of the automotive development process as they are linked to timing and size of the resulting invested cash flows . The objectives are neither independent nor necessarily fixed. Rather, they are influenced by the development process employed because the automotive development process is mostly portrayed as linear due to the intrinsic sequential structure of decision-making . Let us assume the decision(s) available at time t influences the set of decisions taken at time t + 1.
With regard to the specific course of actions included in the development process, various authors list somewhat different generic product development processes but all share the same basic structure. Differences can be found in the level of detail (LOD) covered (Sörensen 2006). The development of a new vehicle model is an elaborate process that can include thousands of employees at the automaker and its Tier 1 suppliers . Over the years, a trend has emerged of original equipment manufacturers (OEMs) doing less work internally, while Tier 1 suppliers and their supply chains provide more. This can be extended to the model that suppliers deliver complete systems as done, for example, for the Smart vehicle production in Hambach, France, established in 1994 as a joint venture of Daimler-Benz and the Swiss watch manufacturer Swatch to produce the Smart car . Today, it is fully owned by Daimler AG . Smart has the lowest in-house production depth in the automotive sector. It accounts for only 10%, while most other automakers often still have 20–40%. This means that 90% of the production steps to complete the vehicle are performed by component suppliers .
When a new vehicle is being developed, automakers typically work on an extensive benchmark with competitors, spending a significant amount of time on market research and customer analysis (Gusig and Kruse 2010) including the scope of a correct systematic approach of value engineering and target costing in cost management . Value engineering and target costing are complementary processes. One allows the identification of where in the development cost reduction could be achieved; the other shows the target to be achieved to guarantee the long-term profitability of a company. Based on value engineering methodology, work plans can be developed, taking into account the three subsequent stages:
-
Conceptualization Phase : Occurs in the initial design activity when the scope of the project is drafted and a list of the desired design features and requirements is created.
-
Project Phase : Determine the work to be performed, the budget, time schedule, what resources are needed, and assignment of responsibilities. As work progresses, the status of the project is compared to the actual plan and schedule. During this phase, schedules may need to be adjusted to keep the project on track.
-
Validation Phase : After completion, the project validation is done, highlighting project success and the lessons learned from the project implementation.
Therefore, the value engineering methodology focuses on product cost, functionality, and quality in accordance with customer needs and the company’s product strategy. Hence, key drivers for the product strategy in the automotive domain will be:
-
Advanced driver assistance system (ADAS) features (see Chap. 11)
-
Interior design
-
Passenger capacity
-
Powertrain technology
-
Production plant
-
Research and development budget
-
Safety features
-
Special equipment and bundling strategy
-
Target price level
-
Telematics/Connectivity
-
Type of vehicle model
Thus, the complexity of a vehicle’s research and development (R&D) process is tremendous. One way to control quality and maturity of the developed components is to introduce a Stage-Gate-controlled process (Gusig and Kruse 2010; Sendler and Wawer 2011; Eigner and Stelzer 2013), as shown in Fig. 3.4.
The Stage-Gate process consists of the following stages:
-
Stage 1— Scoping : A quick and inexpensive assessment of the technical merits of the project and its market prospects.
-
Stage 2—Building a Business Case : This is the critical homework stage, the one that makes or breaks the project. Technical research, marketing, and feasibility are assessed resulting in a business case which has three main components:
-
Product and project definition
-
Project justification
-
Project plan
-
-
Stage 3—Development: Here, plans are translated into concrete deliverables . The actual design and development of the new product takes place, the manufacturing or operations plan is mapped out, the marketing launch and operating plans are developed, and the test plans for the next stage are defined.
-
Stage 4— Testing and Validation: Thus the purpose of this stage is to provide validation of the entire project: the product itself, the production/manufacturing process, customer acceptance, and the economics of the project.
After Stage 4 has been successfully completed, full production and commercial market launch of the product begins. The structure of each stage is similar and can be expressed as follows:
-
Activities : Work the project leader and the team must undertake, based upon the project plan.
-
Integrated Analysis : Project leader and team’s integrated analysis of the results of all of the functional activities, derived through cross-functional interaction.
-
Deliverables : Presentation of the results of the integrated analysis which must be completed by the team for submission to the gate.
Preceding each stage is a decision point, or gate, which serves as a go/kill and prioritization decision point. Gates are where mediocre projects are culled out and resources are allocated to the best projects. Gates deal with three quality issues: quality of execution, business rationale, and the quality of the action plan. The structure of each gate is similar:
-
Deliverables : Inputs into the gate review: what the project leader and team will deliver to the meeting. Deliverables are defined in advance and are the result of actions from the preceding stage. A standard menu of deliverables is specified for each gate.
-
Criteria: What the project is judged against in order to make the go/kill and prioritization decisions. These criteria are usually organized into a scorecard and include both financial and qualitative criteria.
-
Outputs: Results of the gate review. Gates must have clearly articulated outputs including a decision (go/kill/hold/recycle) and a path forward (approved project plan, dates, and deliverables for the next gate agreed upon).
Thus the Stage-Gate-controlled development process results in a more effective, efficient, faster process that improves product innovation results (Cooper 2017).
Many companies have introduced product innovation processes ; however, they are still struggling to achieve the financial results they expect. Thus focusing on innovation productivity, the question to be answered is, “How can the company identify waste, streamline the product development process , remove bureaucracy, and improve profits?” The answer is a lean, rapid, and profitable new product development process (Cooper and Edgett 2005). The need for a lean, rapid, and profitable new product development process has never been greater than today because product life cycles have become shorter, competition is more intense, and customers are more ambitious. Therefore, leading automakers have overhauled their product innovation processes , incorporating critical success factors discovered through best practices research, which is possible with the help of the Stage-Gate new product development process. The Stage-Gate process has become an industry standard for managing new product innovations. It integrates numerous performance driving practices into an easy-to-understand, successful approach. Its robust design engages users at all decision levels and functions, enabling quality execution, timely go/kill decisions , alignment, and speed. This results in superior products reaching the market faster and generating more profit (URL1 2017).
The Stage-Gate-controlled process was introduced in the 1990s as a straight-forward basic concept. The development project is broken down into well-defined phases and the maturity of the product is being checked at each stage. At the end of a particular phase, the results are checked against the specifications and pass if all quality criteria are satisfied. Since delays are problematic, a development project is typically managed very tightly. Tough competition, enormous cost pressure , and stringent time-to-market deadlines have a great impact on today’s engineering processes (Gusig and Kruse 2010; Seiffert and Rainer 2008; Haas and Sinha 2004). A huge advantage in efficiency is realized through the deployment of specific tools such as:
-
CAD Systems for Geometric Design: Computer-based design tasks commence with the use of CAD systems to generate detailed geometric models. A central task in dealing with geometric constraints for CAD is the generation of an optimal decomposition plan that not only supports efficient solutions but also captures design intent and assists with conceptual designs. With the assimilation of CAD systems and analysis tools into major industrial processes, an integrated approach is worthwhile. However, the need for a systematic way of considering the relationship between geometry and functional aspects of the geometric model becomes a preferential treatment, as shown for the automotive CAD examples in Figs. 3.1 and 3.2.
Fig. 3.1 
Geometry design with the CAD system CATIA . Example axle (With kind approval/courtesy from Ashok Leyland (URL9 2017))
Fig. 3.2 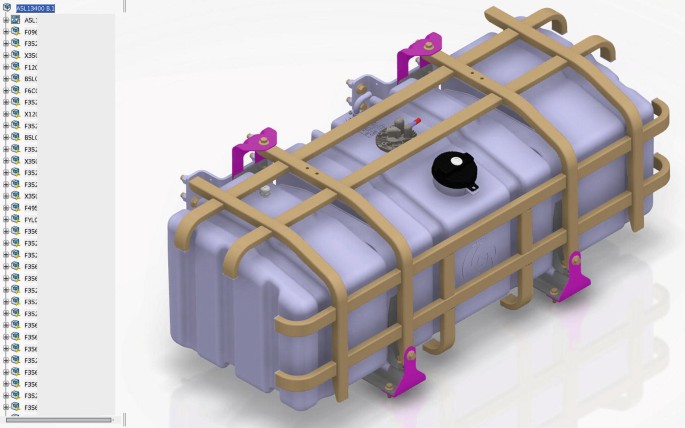
Geometry design with the CAD system CATIA . Example fuel tank (With kind approval/courtesy from Ashok Leyland (URL9 2017))


-
In geometric design, the geometry of complex shapes is represented in terms of polynomial functions. The nature of the surface obtained using such polynomial-based methods usually depends on the type of polynomial chosen. Examples of such surfaces are:
-
Bézier Surfaces : Many algorithms for curves in Bezier representation can be understood and derived using polynomials. A Bézier surface is defined by a set of control points . Similar to interpolation, a key difference is that the surface does not pass through the central control points ; rather, it is stretched toward them as though each were an attractive force. They are visually intuitive and are used for many applications including CAD , computer graphics , and finite element modeling (FEM) (Bézier 1986). A dimension count shows that the n + 1 linearly independent Bernstein polynomial \( {B}_i^n \) is the basis for all polynomials of degree ≤ n. Therefore, every polynomial curve b(u) of degree ≤n has a unique nth degree Bézier representation
-
Since the Bernstein polynomial represents a basis, every polynomial surface b(x) has a unique Bézier representation
with respect to the reference simplex A. The coefficient b i is called the Bézier point of b. They are the vertices of the Bézier net of b(x) over the simplex A (Prautzsch et al. 2002).
-
B-spline Surface : With regard to the Bézier representation of polynomial curves , it is desirable to write a spline s(u) as an affine combination of some control points c i as follows:
where the \( {N}_i^n(u) \) are basic spline functions with minimal support and certain continuity properties. Schoenberg introduced the name B-splines for those functions (Schoenberg 1967).
The B-spline can be defined by the recursion formula
is the local parameter with respect to the support of \( {N}_1^{n-1} \) (Prautzsch et al. 2002).
B-spline surface permits the use of more control points in the characteristic polyhedron while retaining low-order basis functions. B-spline basis functions are nonzero only over a given finite interval and enable the effect of a control point on the surface shape to be localized. Another advantage of the B-spline formulation is its ability to preserve arbitrarily high degrees of continuity over the complex surface patch. These characteristics make the B-spline surfaces popular for use in an interactive modeling environment (Woodward 1987).
-
Rational B-splines : Standard for surface modeling in CAD and computer graphics . Any typical surface forms, such as flat planes and quadratic surfaces, e.g., cylinders, spheres, ellipsoids of revolution, as well as more complex fully sculptured surfaces, are easily and accurately represented by rational B-spline surfaces. As with rational curves, rational forms of Bézier surfaces are possible. A Cartesian product rational B-spline surface in four-dimensional homogeneous coordinate space is as follows:
where the \( {N}_{i,j}^hs \) are the four-dimensional homogeneous polygonal control vertices , and N i, k(u) and M j, l(w) are the nonrational B-spline basis functions . An algorithm for a simple rational B-spline surface is given in Rogers (2001) as follows:
Specify number of control vertices in the u, w directions Specify order in each of the u, w directions Specify number of isoparametric lines in each of the u, w directions Specify (or acquire) the control net and store in an array Calculate (or acquire) the knot vector in the u direction and store in an array Calculate (or acquire) the knot vector in the w direction and store in an array For each parameter value, u Calculate the basis functions, N i,k (u) and store in an array For each parameter value, w Calculate the basis functions, M j,l (w) and store in an array Calculate the SUM function. For each control vertex in the u direction For each control vertex in the w direction Calculate the surface point, Q(u,w) and store in an array end loop end loop end loop end loop
-
A pseudocode implementation of the algorithm is given in (Rogers 2001).
-
Nonuniform Rational B-splines: Nonuniform rational B-splines are commonly referred to as NURBS. They have become the de facto industry standard for the representation, design, and data exchange of geometric information processed by computers. NURBS provide a unified mathematical basis for representing analytic shapes , such as conic sections and quadratic surfaces, as well as free-form entities , such as car bodies and ship hulls (Körber and Möller 2003). NURBS are generalizations of nonrational B-splines and rational and nonrational Bézier curves and surfaces (Piegl and Tiller 1997).
-
A rational B-spline curve is the projection of a nonrational polynomial B-spline curve defined in four-dimensional homogeneous coordinate space back into the three-dimensional physical space which results in
where the \( {B}_i^h \) are the four-dimensional homogeneous control polygon vertices for the nonrational four-dimensional B-spline curve, and N i,k(t) is the nonrational B-spline basis function.
Vector-valued polynomials with convenient properties are valuable for complex modeling and simulation purposes. They are mainly utilized for industrial developments such as automotive systems, avionic systems, and others. A NURBS surface S(u,v) can be defined as follows:
-
with the control point matrix
-
the basic functions
and the knot vector U = {u o, …, u m}, u i ≤ u i + 1.
The surface S(u,v) has (m + 1) × (n + 1) control points P i,j and weights w i,j. Assuming the degrees of basis functions along the u and v axes to be p-1 and q-1, respectively, the number of knots is (m + p + 1) × (m + q + 1). The nondecreasing knot sequence is t 0 ≤ t 1 ≤ ・・・ ≤ t m + p along the u direction and s 0 ≤ s 1 ≤ ・・・ ≤ s n + l along the v direction with the parameter domain in the range: t p-1 ≤ u ≤ t m + 1 and s q − 1 ≤ v ≤ s n + 1. If the knots have multiplicity p and q in the u and v directions, respectively, the surface computation will interpolate the four corners of the boundary control points .
In (Piegl and Tiller 1997), an algorithm for relatively fast computation of a vertex on a NURBS surface is discussed, exploiting redundancies and the property that most basis functions, the N i, p(u) and N j, q(v), evaluate to zero for given u and v.
The key to rendering complex objects lies in computing and rendering only those parts of the object which are visible to the viewer. This, in particular, is challenging in the case of complex surface rendering because it’s impossible to perform any kind of space partitioning and utilize one of the traditional occlusion culling methods. The reason for this property is that for a given point of view, the whole surface could possibly be overlooked. Moreover, omitting only those parts of the object which don’t lie in the viewing area of the viewer doesn’t suffice. The remaining triangle count could be far too high.
The key to surface rendering lies in the level of detail (LOD), i.e., rendering those parts of the surface which are far away from the viewer or which are rather smooth with less detail, i.e., less triangles and those parts which are close to the viewer or which are rough with more detail, which works for large objects only as small objects are always perceived in full detail (Piegl and Tiller 1997).
-
Digital Mock-Up (DMU): With the increasing complexity of technical systems, the design-related analyses have been successful based on the concept of DMUs. A DMU allows the aggregation of 3D CAD models of individual components into a 3D model of the product for its entire life cycle. This aggregation takes place according to the product or product structure and the position and orientation of each component within the product space enriched by all activities that contribute to describing the product. Product design engineers, manufacturing engineers, and support engineers work together to create and manage the DMU. The product structure is derived from the parts list or from the product data management (PDM). On the basis of the DMU, various analyses, such as collision of components, mountability, disassembly, etc., can be carried out. The integration of further aspects in addition to the shape, such as the movement behavior, the strength, or the thermal behavior, leads to virtual prototyping . This is a computer-based representation of the complete product and important knowledge of the future of the supported product to replace any physical prototype with virtual ones using 3D computer graphic techniques . It is also frequently referred to as digital prototyping (DP) or virtual prototyping (VP). These two specific definitions refer to the production of a physical prototype, but they are part of the DMU concept. DMU allows engineers to design and configure complex products and validate their designs without ever needing to build a physical model . Various types of analyses can be carried out to demonstrate functional capability . Thus, the term VP has also been used for this purpose: partial models which describe individual aspects and are created and analyzed by the product under development. This saves time and money because the construction and testing of real prototypes can largely be eliminated. A pioneer in using DMUs is the aviation industry. In the early 1990s, Boeing was able to advance the complete development of its 777 airplane in this way and significantly reduce its development time. Some other typical DMU applications are (Gausemeier and Plass 2013):
-
Building Space and Assembly Analyses: Building space analyses pursue the goal of optimally utilizing the available space. With the aid of the digital mock-up, it is possible to examine whether a container for the cooling liquid can be installed in the engine compartment. Furthermore, animations can be used to create very intuitive training documents for assembly and disassembly.
-
Collision Investigations: These are conducted in computer-assisted analysis of collisions, especially in complex kinematic systems with volume-bearing objects. Investigations of such analyses are contact (contact), component overlap (clash), and clearance violations (clearance). A DMU of a gearbox in Dassault’s CATIA environment which can be used for collision analysis of the moving parts is shown in Fig. 3.3.
Fig. 3.3 
Digital mock-up of a gearbox in CATIA (With kind approval from Ashok Leyland (URL9 2017))
-
Creation of Sales Documents: Today’s efforts are driven by marketing and sales to produce realistic product presentations even though the product is not yet available. The basis for this is 3D CAD models. Their properties are assigned to properties such as color, texture , reflection, etc. Ray-tracing software puts the later product into the right light and delivers realistic-looking product images. In addition, the static 3D CAD models are animated in order to demonstrate their characteristic features in a realistic product animation .
-
-
Computer-Aided Engineering (CAE): This term refers to the analysis of an engineering artefact. Computer-aided engineering includes finite element analysis (FEA), computational fluid dynamics (CFD), durability, optimization, and process analysis for manufacturing. A lot of these tasks are highly automated and deploy a wide variety of knowledge-based engineering methodologies, e.g. it is possible to automatically generate a FEA mesh from the CAD model.

These technologies are enabling new product creation processes, which lead to constantly shrinking development times, better product maturity , and overall product quality . In this context we have:
-
Concurrent Engineering (CE): Concurrent engineering is a method of designing and developing products in which design teams attempt to integrate the different stages of design and development to run them simultaneously rather than consecutively. Concurrent engineering also refers to simultaneous or parallel engineering. In considering tooling, assembly, and routing during product design, concurrent engineering results in decreasing product development time and time to market , leading to improved productivity and reduced costs. It relies on the introduction of new process models, with appropriate team and organizational structure, as well as the deployment of new information technologies to manage the overall complexity of information and knowledge flows .
-
Simultaneous Engineering (SE): Simultaneous engineering is a method for shortening product development by means of parallel initiation of the necessary development work. Thus, simultaneous engineering refers to the joint parallel development of a product and the necessary production plant . The overlapping of these two steps shortens the entire time until the market launch of the new product idea. The better information available to all parties involved in simultaneous engineering enables an accelerated and at the same time production-appropriate product development. Simultaneous engineering is often referred to as concurrent engineering . This includes the targeted and interdisciplinary collaborative and parallel work of the parties involved. OEM and Tier 1 suppliers can also be involved within the simultaneous engineering process in order to speed up and optimize the overall development. In this case data security and/or cybersecurity are of paramount importance.
These methods describe the product creation process which is highly parallel in nature and spans the complete product life cycle , from concept and feasibility studies, through manufacturing and market introduction, to disposal and recycling . Manufacturing and product face lifts, as well as recycling aspects, have to be taken into account at a very early stage. The goal significantly minimizes the number of design changes based on a thorough understanding of the overall product creation process, stringent process plans with suitable control mechanisms, and quality gates, as shown in Fig. 3.4.

A vehicle development system defining a set of milestones (M 0–M n) from concept to Job No. 1. For example, Truck Development System at Ashok Leyland (Truck model with kind approval from Ashok Leyland) and Bharat-Benz
A flood of information needs to be managed through concept ideas, geometries, design documents, guidelines, cost information, project management data, 3D CAD modeling , DMU , CAE tools, and new visualization techniques , such as:
-
Virtual Reality (VR): Like most technologies , VR did not suddenly appear. The emergence of VR was closely related to the maturity of other technologies, such as real-time computer graphics to visualize highly realistic 3D models. The required VR technology embraces all of the hardware utilized by the user to support a VR task. Typically this includes a head-mounted display (HMD); head-coupled display (HCD); 3D interactive devices, such as 3D mice and data gloves ; headphones; and 3D trackers . 3D trackers are typically used to monitor the positions and orientation of objects in 3D space. Typically, a stationary transmitter radiates electromagnetic signals that are intercepted by a mobile detector attached to the user’s head. When these signals are received by the detector, they are decoded to reveal the relative position and orientation between the transmitter and receiver . These signals are then passed onto the run-time system for transmission to the 3D graphic environment. The same principle is used for tracking the 3D mouse, whose signals are used to control an icon in the user’s field of view. An HMD isolates the user from the real world and substitutes binocular views on the virtual environment (VE). The data glove can monitor the status of the user’s fingers. This is achieved through the use of fiber optics attached to the back of the glove fingers. When the user’s fingers are flexed, the optical characteristics of the fiber optics alter, this can be measured and scaled into an output signal.
VR systems were not developed to meet a specific need; they were developed because they were possible. Hence, through the integration of real-time computing, VR enables the user to get deeper insight by moving around in the virtual space of the respective application domain. By embedding temporal concepts, VR can be used as the basis for simulation, analysis, and prognosis of complex processes. Furthermore, underlying databases offer the ability to efficiently store and retrieve huge amounts of data for the modeling of real-world process domains. The data itself can be visualized in rendered 3D models (Möller 2000, 2016).
-
Augmented Reality (AR): Computer-assisted perception is the integration of digital information with the user’s environment in real time. Unlike VR , which creates a totally artificial environment, AR uses the existing environment and overlays new information on top of it which expands the real environment around the virtual aspect. Augmented reality is routinely used to produce high-quality designs which have the required mechanical, thermal, and acoustic properties. It is this high degree of digitization that has popularized the term virtual product (Haas and Sinha 2004; Grieb 2010; Eigner and Stelzer 2013). The advantages of a fully digital model are compelling, such as the reuse of common parts, elimination of tedious prototyping, faster development cycles, fewer design flaws, and others. By using AR, physical mock-ups and artificially generated information can be mixed as desired. Thus, maintenance information, e.g., about the path of certain cables in the trunk of a vehicle or flow lines in a study of cabin interiors, can be combined. In AR and VR, the position of the head and the viewing direction can be recorded through sensors. Through this, the spatial orientation of the VR-scene is determined.
The need for new tools and methods in engineering is driven by the fast pace of change in this field:
-
Development work is being outsourced more and more to suppliers offering engineering services. As a consequence, complex supply chains have to be managed. Both the OEM and the suppliers have to agree on rules and standards, share the same IT infrastructure, exchange complex results, and integrate them. If the supplier does not have the same IT infrastructure, a solution needs to be found for exchanging product data and information in an efficient manner.
-
The development process itself is becoming increasingly distributed. Today, design teams across the world work on different parts of the structure and systems of a vehicle. They need tools that support efficient exchange of product data, collaborations, and the exchange of thoughts and ideas as well (Haas and Sinha 2004).
-
Pressure to shorten development cycles increases the need for efficient knowledge sharing . Internet and web technologies play a fundamental role in sharing engineering knowledge across teams, business units, and companies (Haas 2000; Haas and Sinha 2004).
3.1.1 Requirements Engineering
Requirements engineering (RE) can be described as a process by which engineers identify a problem’s context, locate the customers’ needs and requirements within that context, and deliver specifications that meet those needs (Verner et al. 2005). In this regard, the requirements engineering process requires a considerable reduction in the complexity of the real-world problem’s context. This reduction may incorporate a subset within which the customer’s organization operates, resulting in a set of requirements defined by business needs and requirements (BNR) and stakeholder needs and requirements (SNR). These can then be converted into a system requirement specification (SyRS), as introduced by (Faulconbridge and Ryan 2014). As can be deduced from the literature, most requirements engineering methodologies have been created by engineers who like:
-
Diagnosticity
-
Precision
-
Rigor
As described in Dorfmann and Thayer (1990), requirements engineering is the discipline concerned with analyzing and documenting requirements. In the publication of Kotonya and Sommerville (1998), requirements engineering is defined as systematic process of:
-
Analyzing
-
Documenting
-
Eliciting
-
Managing
-
Understanding
The ISO/IEC 29148 (ISO/EIT 2011) standard defines the requirements of an engineered system and the life cycle process (see Sect. 3.4) as a process by which the acquirer and the suppliers of a system:
-
Articulate
-
Discover
-
Document
-
Review
-
Understand
Hence, requirements engineering is a core process in product development, defining, documenting, and maintaining requirements, which document the physical and functional needs that a particular design of a product or a process must be able to perform. The fields concerned with requirements engineering are systems and software engineering . The term came into general use in the 1990s with the publication of an IEEE Computer Society tutorial by Thayer and Dorfmann (1997) and the establishment of a conference series on requirements engineering. Alan M. Davis maintains an extensive bibliography of requirements engineering (Davis 2011).
The activities involved in requirements engineering vary widely, depending on the type of system being developed and the specific style guide practices of the organization involved. These may include (URL3 2017):
-
1.
Requirements Elicitation: Practice of collecting requirements of a system from users, customers, and other stakeholders; sometimes also called requirements gathering.
-
2.
Requirements Identification : Verify that acceptance criteria are established in the software requirements for each of the identified requirements. Such criteria should be used for verification and validation (V&V) planning and performance as defined in each related life cycle phase.
-
3.
Requirements Analysis and Negotiation: Tasks determining the needs or conditions to meet for a new product with regard to possibly conflicting requirements of the various stakeholders.
-
4.
Requirements Specification: Documenting the requirements in a requirements document.
-
5.
System Modeling: Developing models of the new system, often using a notation such as the Unified Modeling Language (UML); UML profiles are intensively used in modeling domain-specific distributed applications.
-
6.
Requirements Validation: Checking that the documented requirements and models are consistent and meet stakeholder needs.
-
7.
Requirements Management : Managing changes to the requirements as the system is developed and put into use.
These requirements are presented as chronological stages; in practice, there is considerable interleaving of these activities .
3.1.2 Design as a Multiparameter Optimization Problem
In today’s highly competitive business environment , large-scale engineering (LSE) organizations are constantly searching for ways to differentiate their products from their competitors. Typically, this is achieved by increasing the level of innovation (see Chap. 1), embedding additional valuable features and functionality in their products, and reducing the development cycle time. This requires a well-integrated product development process that ensures intrinsic innovation and optimal designs that reduce the number of prototype iterations . This is accomplished by making use of an optimal design mechanism which is predictive in a single-dimensional setting with regard to the underlying probabilistic and mathematical statistical methods. Let’s assume the shortest return on investment (ROI) time with regard to a design is one that has to compare different scenarios based on what will be able to decide as best fit. In the case of two designs where two engineering groups work independently at different locations, the ROI can be proven by the means of random numbers from the uniform distribution on [0,1]. With regard to the expected ROI, the calculation can be done based on the two assumed uniform random variables [0,1] and a comparison setting of 1/3. Let v 1 and v 2 denote the valuations of the designs. With the definition of uniform random variables,
implying that
Since v 1 and v 2 are assumed to be independent results,
In the case of an expectation of nonnegative random variables , one gets
As a result, the question at this point is whether it is possible to do better and how.
Multidimensional settings are unlikely to permit succinct descriptions of optimal mechanisms. Optimal mechanisms in multidimensional settings are unlikely to have practical implementations. In comparison to this, product data management (PDM) typically encompasses multiple products’ technical specifications, engineering models, design drawings, bills of material (BOMs), and related documents. PDM typically controls product-related data and organizes workflow through the entire product life cycle . It provides version control and security to ensure that the information stored in the central repository is accurate and up-to-date, which in turn can reduce data processing and make operations more efficient.
In this regard, PDM is a precursor and major component of product life cycle management (PLM), a strategy for managing and collaborating around product information (see Sect. 3.4). PLM is a holistic, enterprise-wide approach to managing all product data and processes across the entire life cycle, from development and production to sales and maintenance. The potential benefits derived from PLM can be seen in all areas along the value chain , based on the life cycle approach and the holistic view that accompanies it. Using this concept, for example, products can be brought to the market more quickly, the product in the service phase can be supported by better services, and the disposal can be anticipated ex ante in the product concept. In summary, PLM’s potential benefits can be divided into the following four areas:
-
Business Performance: This includes, in particular , the value of data and information as well as their management.
-
Financial Advantages: Are particularly evident in an increase in profit, which is realized, for example, by an early market launch of the product, and thus higher sales figures, or by lowering costs.
-
Quality Advantages: Product quality refers not only to the quality of the product but also to the conformity of customer requirements and product performance. This means that PLM cannot only detect production errors at an early stage but also reduce rework and/or customer complaints. It can be used to implement product variants that are offered with a reasonable cost-benefit ratio and are valued by the customer.
-
Time Advantages: An efficient design leads to a reduction in project processing times, throughput times, problem-solving times, and the time to market .
PLM can be applied to several areas of a company, but the penetration, breadth and sophistication of the solution is domain-specific. PLM was developed mainly for use in product development, and many PLM-based methods and tools focus on this area of the value chain . The PLM function model consists of core data management, product data creation , process management , and process data integration management (Schuh 2012).
While PDM is a standard component of PLM, it is also offered as a dedicated module in many enterprise resource planning (ERP) suites of integrated applications for core business processes using common databases maintained by a database management system . The suite of integrated business activities is used to collect, store, manage, and interpret data from many business activities, including:
-
Finance
-
Inventory management
-
Manufacturing
-
Marketing and sales
-
Materials management
-
Product planning
-
Production planning
-
Purchase
-
Service delivery
-
Shipping and payment
This allows the ERP to share data across the various departments of the company, such as accounting, manufacturing , purchasing, sales, and others, that provide the data. Therefore, ERP facilitates information flow between all business functions and manages connections to outside OEM and Tier 1 suppliers .
3.2 Automotive Modularization and Platforms
The use of platforms and the development of product families based on platforms are not new and have been widely used globally in different industrial sectors. The production of product families based on platforms is a strategy that has been successfully applied in the automobile sector to cope with a rapidly increasing product portfolio in the late 1990s up to the first years of the twenty-first century. This expansion of the product portfolio was made possible by using a standard platform for different models in the same segment (Lampón et al. 2015). This has led to greater efficiency in design and development processes, as well as greater economies of scale in production and procurement due to greater standardization (Becker and Zirpoli 2003; Cusumano and Nobeoka 1998; Muffatto 1999; Muffatto and Roveda 1999; Wilhelm 1997).
The greatest changes regarding process flexibility and efficiency took place around the turn of the century, when platforms were reduced and standardized to develop a single common platform for different models within the same segment (Holweg 2008). The main objective of such standardization was to rationalize the number of platforms and to share common components and systems among those models assembled on a single platform (Patchong et al. 2003). This standardization strategy focused on aspects of product development— the simplification of engineering and design processes, reduction of costs and development time, and ability to update products (Muffatto 1999; Suk et al. 2007). It also aimed to take advantage of the economies of scale resulting from a greater number of common units per platform, such as savings on the purchase of components (Korth 2003). From a manufacturing perspective, the platform standardization strategy offered advantages for globalizing production processes because it allowed flexibility among plants , possibility of transferring production from one plant to another (Robertson and Ulrich 1998; Smith and Reinertsen 1998), and cost reduction by using resources on a worldwide scale (Wilhelm 1997).
In recent years, the platform strategy has been reviewed, and new modular platforms have been, and will continue to be, adopted in the sector (Sehgal and Gorai 2012; Global Automotive Modular Platform Sharing Market Analysis 2013–2023). From a technical point of view, such modular platforms are configured differently based on a single scalable design, allowing for changes in structural dimensions. This modularization of the structural element of an automobile, the platform, means that it is possible to not only assemble several models within a single segment (same size), as with the classic standard platforms , but also several models in different segments (different sizes) (Buiga 2012; Lampón et al. 2015). Although the modular platform strategy has not yet been fully implemented, the forecasts of several automobile manufacturers (e.g., Volkswagen, PSA Peugeot-Citroën, Nissan-Renault) mention savings in product development costs and in the procurement of components from the auxiliary industry (Lampón et al. 2015; Lampón and Cabanelas 2014).
The result of the platform standardization strategy is an improved operational flexibility . The modular platform strategy allows plants in different segments to share the same modular platform, so the production network can include a larger number of plants. Manufacturing mobility, expressed in terms of operational network manufacturing flexibility, is the ability to make optimal use of the total global capacity of the network by shifting production volumes between plants in order to cope with volatility in the international business environment (Lampón et al. 2015).
In Fig. 3.5 an example of a CAD model of an engine in the CATIA system environment is shown.

Modular CAD model of an engine in CATIA system environment. It defines the basis for a modularization platform (Courtesy Ashok-Leyland (URL9 2017))
3.3 Virtual Product Creation
Product data management (PDM) systems help engineers manage data and processes related to the product development life cycle. As sophisticated and automated design tools (e.g., CAD systems) became available , the amount of design data increased dramatically. PDM systems offer the technology to manage such data, and keep track of various product data that already exist in various forms. Hence, one can view PDM systems as having meta-knowledge about the product development life cycle. This meta-knowledge is in the form of knowledge about product structure, processes , and access/change management rules. Basic functions of a PDM system include (Bilgic and Rock 1997; Grieves 2006; Eigner and Stelzer 2013):
-
Change Management: The ability to define and manage changes to product data over the life cycle. Change management is process oriented, defining the events in the cycle of reviewing and approving changes.
-
Classification: The ability to classify parts by their structure, function, or processes for manufacturing .
-
Design Release Management: Process of controlling design data with an electronic vault with check-in/check-out, release level maintenance, access security, and review and approval management. This function encompasses the management of all forms of digital product data: CAD files , geometric models, images, documents, and others.
-
Impact Analysis: The ability to detect the effects of a design change on the overall product design life cycle.
-
Product Structure Management: The ability to define , create, maintain, modify, and display multiple versions of the product structure, including design options and activities over the product data life cycle .
-
Systems Management: Usually perceived as the use of project-oriented scheduling techniques with work breakdown structures but which should be able to manage any facet of systems design (cost, quality, risk, in addition to workflow).
Thus, PDM is going through a natural evolution cycle. It started as a typical engineering data storage and retrieval system; but today it encompasses a number of processes and technologies because PDM systems are designed to manage product data and documents produced by a mixture of CAD , CAM , CAE , material requirements planning (MRP), and other engineering and manufacturing control systems (Sendler and Wawer 2011; Grieb 2010). With regard to the major functionalities of PDM systems listed above, some others are:
-
Configuration Management, Product Structure Management, and Engineering Change Management: This functionality focuses on creating and managing production configurations and BOMs. Features include storing and managing previous build versions, managing effectivities, supervising several different configurations of the product simultaneously, managing engineering change requests, and providing information about different aspects of the production, based on the design discipline (such as mechanical, electronic, and even financial).
-
Program Management: PDM-based project management includes real-time resource scheduling and project tracking, progress reporting, status and location of deliverables, and identifying individuals working on various deliverables . This functionality is still evolving and is often supported by third-party applications.
-
Workflow: This is a key element in both process and configuration management which automatically transfers the results of one set of tasks to the next and can alert the concerned individual (or send a necessary interrupt to the next process), that work is pending or in progress. The work defined in a workflow system can be serial or concurrent; in either case, work can proceed simply once a step is completed, or it can be based on conditional requirements. Repetitive processes are ideal for workflow operations. If equipped with a graphical interface, the workflow enables users to see where resources and deliverables are lodged within the overall engineering processes.
-
Interfaces and Data Exchange: Several processes in the product development life cycle are supported by various tools. These tools generate data in the different required formats.
-
Vault: As the name suggests , a vault stores, organizes, controls, retrieves, and protects product data. Data need not be colocated. The idea is merely to organize wherever there is a need. The key is in the supervision of the data access by various parameters defined by the organization, such as individuals, groups/teams, projects, supervisors, public, etc.
-
Process Management, Process Modeling, and Design Control: This functionality is for controlling the creation and modification of product configurations , part definitions, data relationships, and other product data throughout the product development life cycle. Product data management records each step in the creation of data, thus providing an audit trail that is crucial for tracking design intent and design changes reversed .
One of the biggest challenges faced by PDM systems is to integrate all these data formats through standards like ISO 10303, Standard for the Exchange of Product Model Data (STEP), a series of standards that are the essential basis for product data technology, and to interface various tools through technologies such as system integration and middleware technologies. With the increasing distribution in various engineering disciplines, approaches to the integration of computer-aided systems without STEP are unthinkable today. Against this background, the introduction of STEP is a major challenge for all technical companies, as well as the further development of the product data model (Anderl and Trippner 2000).
With the accelerated pace of technological change that global manufacturing companies have to face, they must implement manufacturing engineering with proper consideration given to the manufacturing process and resources that are appropriate for the particularities of each manufacturing site. Particularly for effective ERP system implementation under a global manufacturing environment, the PDM integration for product data is one of the important keys to success. For such product data integration, engineering bills of material (EBOMs) need to be transformed to manufacturing bills of material (MBOMs), but the MBOM transformation must be done in such a way as to fit the particularities of each manufacturing site. In this process, a methodology appropriate for integration and transformation is required. Therefore, digital manufacturing can be proposed as the key tool for data integration between PDM and ERP. Digital manufacturing, as a technology possessing the physical and logical computer modeling and simulation technique for actual manufacturing, provides the methodology for transforming EBOM to MBOM that fits the particularities of each manufacturing site, based on the process and resource models which reflect the particularities of each manufacturing site. It also provides the methodology for MBOM verification and process and resource model integration. Using such a method, the MBOM and the process and resource data, verified and appropriate for each manufacturing site, can be sent to the ERP system (Lee et al. 2011).
The virtual product creation and global collaboration processes based on the Jupiter Tesselation (JT) exchange format shown in Fig. 3.6.

Virtual product creation and global collaboration processes at Mercedes-Benz cars (With kind approval from Daimler)
PDM systems are designed to:
-
Store, control, and manage documents, such as text, graphics, drawings, etc., and other information about products.
-
Enforce and manage the process of creating and using these documents.
-
Enable engineering teams to share information on products and process quickly and with consistent accuracy . Permit the integration of techniques such as computer-aided design and manufacturing (CAD/CAM) and FEM into coherent business systems across an entire enterprise.
Integration with PDM technologies is critical as well because the design data is typically managed through these tools. The blending of technologies and methods is an integral part of PLM initiatives—solutions that facilitate collaborative work processes, supplier integration, enterprise application integration, and a host of other approaches addressing the needs of the extended enterprise (Eigner and Stelzer 2013; Seiffert and Rainer 2008). Change management defines a workflow for initiating and approving design changes. The workflow itself is an integral part of the PDM infrastructure. In a typical development project, there will be thousands of change requests every day. With a web conferencing infrastructure in place, change management is supported by sharing important background information ad hoc, communicating the reasons for a particular change request, and by getting immediate feedback which allows faster decision-making and shorter time to market . The CAD-based PDM is shown in Fig. 3.7.

JT/CAD-based PDM (ProSTEP (URL7 2017))
The team-oriented structure of modern organizations means that many decisions require insight and approval from a lot of different sources. Electronic meeting tools enable dispersed teams to collaborate easily, ultimately delivering faster time to consensus and, hence, a shorter time-to-market (TTM) for new products and services (Cusumano 2008). In today’s increasingly competitive world, a shorter TTM delivers one of the highest payoffs. Furthermore, presence-based visual collaboration tools enable workers to immediately locate and communicate with co-workers and partners, regardless of their current location. That way, issues can be resolved in real-time and without the wasted cycles of voice mail and email exchanges. The result is decreased frustration , faster problem resolutions , and increased satisfaction.
-
Productivity/Efficiency: Videoconferencing and visual collaboration tools are moving away from the scheduled environment of the departmental conference room to the ad hoc, unscheduled work style of the desktop. Conferencing on demand delivers immediate productivity boosts and time savings to all knowledge workers by enabling them to integrate visual communications and desktop-based collaboration tools into their normal workflow process. The result is an immediate impact on the bottom line (Spath and Kern 2003) as employee productivity is a main concern across different industries.
-
Higher Impact and Focus: Videoconferencing can help an organization inject higher impact into their meetings and conference calls, especially when compared to an audio-only meeting. Higher impact during meetings translates into shorter, more effective meetings with minimal workflow disruption. Studies have shown that videoconferencing meetings tend to be shorter than in-person meetings, leading to less wasted time (Prasad 2003).
-
Competitive Advantage: Using web and videoconferencing can generate a competitive advantage. For example, a company that recruits by web-based videoconference rather than flying recruiters or candidates around the country can interview more people, from more locations, in less time, and with less cost and disruption to executive schedules, thereby making better hiring decisions. Using advanced collaboration tools enables companies to better support remote workers and build better dispersed teams, thereby giving more employees more choices on where they want to work.
-
Improved Management of Dispersed Teams: Large research and development organizations have subject matter experts and qualified resources located around the world. Web-based videoconferencing allows companies to more easily deploy and manage those globally dispersed resources by allowing impromptu, face-to-face meetings between managers, subordinates, and remote peers .
3.4 Product Life Cycle Management
Product life cycle management is an important task in today’s automotive systems and software engineering processes (Eigner and Stelzer 2013). It represents the business activity of managing a company’s products across their life cycles, from the first conceptual ideas for a product all the way through until it is retired and discarded. At its highest level, product life cycle management is used to increase product revenues , reduce product-related costs , and increase the value of the product portfolio as well as the value of current and future products for both customers and shareholders (Stark 2011, 2016). Thus, product life cycle management can be interpreted as some kind of digital archive , enabling the seamless integration of all information generated during the life cycle of a product.
The term product, as used in this book, refers to a physical, tangible product that can be owned, traded, and distributed to different places at different times without changing its identity. However, a product can also be something very intangible such as a piece of software, an algorithm, etc. Hence, a product with regard to product life cycle management is referred to by different names, such as (Saaksvuori and Immonen 2008):
-
Intangible products, nonphysical products that are not services
-
Physical, tangible products
-
Services
All kinds of products, as mentioned above, must be managed during all phases of the product life cycle. This will ensure that a product works well with regard to the preassigned product specs; but managing a product across its life cycle is not easy to achieve. During the development of a product, it does not physically exist; and once it becomes a physical, tangible product, it will be used by its customers where it is difficult for a company to keep control over it. Moreover, responsibility for a product within a company is often difficult to manage at different phases of the product life cycle. At one time, marketing may be responsible; and at another time, engineering, after sales services , and maintenance may be responsible. Maintaining a common coherent approach among these different organizational responsibilities, which may have different objectives, working methods, and applications, can be difficult and time consuming. Thus, losing control over a product may result in serious consequences for the company (Stark 2011, 2016).
3.4.1 Loss of Control in Life Cycle Management
Loss of control in product life cycle management can happen at different stages of the product life cycle. The earliest possibility of a loss of control may occur in the product development phase, where a delayed product market launch causes the project to exceed the targeted cost and has a huge impact on the product’s ROI . Assuming a product has an expected cumulative turnover of $100 million over a period of 5 years. The monthly loss with regard to the delayed market launch may result in a $1.6 million loss.
In the case of a company losing life cycle control due to a customer’s dissatisfaction with the quality of a product, or worse, damages resulting from the use of the product, may result in damage to the company’s image and a loss of customers concerned about product problems. Moreover, this could also include a loss of revenue to companies that launch products much faster into the market, as well as reduced profit due to the cost of recalls and legal liabilities resulting from product use (Stark 2011). The monetary losses cannot be quantified in this case, as they are dependent on the number of items sold, the market penetration , and the list price.
Loss of control of the product life cycle can also occur during product manufacturing . For example, in 2006, computer makers, such as Apple Computer, Dell, Hitachi, Lenovo, and Toshiba, announced the replacement of Sony-made lithium-ion batteries that could overheat in certain circumstances and pose a safety risk. In January 2013, after problems with lithium-ion batteries on JAL and ANA Boeing 787 s, the Federal Aviation Administration (FAA) ordered all 787 s to be grounded. The order was lifted in April 2013 after battery and containment systems had been redesigned (Stark 2011, 2016).
Loss of control of the product life cycle can also occur during product use. For example, in 2016, smartphone manufacturer Samsung had a serious problem with its new Galaxy Note 7 product. It could overheat in certain circumstances and pose a safety risk, which would in turn damage the company’s image and result in the loss of customers concerned about product problems. Meanwhile, Samsung developed an extensive battery check protocol to ensure safety of the battery from component to the complete device.
Loss of control in the product life cycle can also occur when products are sold in big numbers on the market. In October 2003, Nissan Motor Company said it would recall 2.55 million cars at an estimated cost of ¥15–16 billion ($138–148 million) due to an engine defect. Over a few months in late 2009 and early 2010, Toyota announced recalls of more than 8 million cars due to concerns over accelerator pedals and floor mats. The cost was estimated at $2 billion. In January 2010, Honda announced the recall of more than 600,000 cars to fix a switch defect that could lead, in some cases, to a fire. In June 2010, GM recalled over a million vehicles due to thermal incidents with heated washer fluid systems. GM listed 84 recalls affecting 30.4 million vehicles (Stark 2011, 2016).
An unprecedented loss of control in the product life cycle was discovered in the so-called diesel gate scandal of the Volkswagen Group —Europe’s largest automotive group. Volkswagen publicly acknowledged on September 20, 2015, that it had massively manipulated several of its models of diesel vehicles, with the help of software, in order to comply with the legal emission standards. Several million vehicles are affected worldwide, and they will be recalled to either fix them or buy them back.
3.4.2 Systems Engineering Approach
The systems engineering approach gives insight into how engineering concepts and procedures could be applied to individual and/or special requirements of products. This finally has resulted in a wide range of definitions of systems engineering, each of which is subtly different because it tends to reflect the particular focus of its source. The following are some of the more accepted and authoritative definitions of systems engineering from relevant standards and documents given in Faulconbridge and Ryan (2014):
“Systems engineering is the management function which controls the total system development effort for the purpose of achieving on optimum balance of all system elements. It is a process which transforms an operational need into a description of system parameters and integrates those parameters to optimize the overall system effectiveness.” (DSMC 1990)
“An interdisciplinary approach encompassing the entire technical effort to evolve and verify an integrated and life cycle balanced set of system, people, product, and process solutions, that satisfy customer needs. Systems engineering encompasses: the technical efforts related to the development, manufacturing , verification , deployment, operations, support, disposal of, and user training for, system products and processes; the definition and management of the system configuration ; the translation of the system definition into work breakdown structures, and development of information for management decision making .” (EIA/IS-632-1998 1994)
“Systems engineering is the selective application of scientific and engineering efforts to transform an operational need into a description of the system configurations which best satisfies the operational need according to the measures of effectiveness; integrate related technical parameters to ensure compatibility of all physical, functional, and technical program interfaces in a manner which optimizes the total system definition and design; and integrate the efforts of all engineering disciplines into the total engineering efforts.” (SECMM-95-01 1995)
“Systems engineering is an interdisciplinary, comprehensive approach to solving complex system problems and satisfying stakeholder requirements.” (Lake 1996)
“System engineering is an interdisciplinary approach and means to enable the realization of successful systems. It focusses on defining customer needs and required functionality early in the development cycle, documenting requirements, and then proceeding with design synthesis and system validation while considering the complete problem: operations, cost and schedule, performance, training and support, test, manufacturing , and disposal. Systems engineering considers both the business and the technical needs of all customers with the goal of providing a quality products that meets the user needs.” (Haskins 2006)
It should be noted that the above definitions come principally from earlier standards. Systems engineering standards, such as SITEC 15288, ANSI/EIA-632 , and IEEE-STD-1220, do not contain any definition of systems engineering but refer more generically to engineering of systems. The worldwide standardization bodies, International Standards Organization (ISO), also called International Organization for Standardization, and the International Electrotechnical Commission (IEC) , specialize in the development of international standards through technical committees established by the respective organization to deal with particular fields of technical activity . The ISO and IEC technical committees collaborate in fields of mutual interest. In this regard, ISO/IEC 15288 is a system engineering standard covering engineering development processes and life cycle phases. The initial planning for the ISO/IEC 15288:2002 (E) standard started in 1994 when the need for a common systems engineering process framework was recognized. In 2004, this standard was adopted as IEEE 15288; and it was updated on February 1, 2008. Standard ISO 15288 is managed by ISO/IEC JTC1/SC7 , which is the ISO committee responsible for developing ISO standards in the area of software and systems engineering. Standard ISO/IEC 15288 also provides processes that support the definition, control, and improvement of the life cycle processes used to manage a product across its life cycle. Organizations can use these life cycle processes when acquiring and supplying products.
The life cycle phases from ISO/IEC 15288 , Systems Engineering-System Life Cycle Processes , vary according to the nature, purpose, use, and prevailing circumstances of the engineered product. Despite an infinite variety of life cycle models, the most important phases are the conceptualization of the business needs for the product, its realization, its evolution, and its ultimate disposal, as shown in Fig. 3.8.

Phases of a generic product life cycle model
From Fig. 3.8, it can be seen that the engineered product will be phased out after operational use and product support, which are part of the ultimate disposal phase. It also can be seen in Fig. 3.8 that the systems engineered product remains in service in the utilization phase . During utilization, the engineered product can undergo modifications and upgrades to rectify performance shortfalls in order to meet changing operational requirements or external environmental constraints . This enables ongoing support for the product to be maintained or current performance or reliability to be enhanced, which is represented by the evolution phase in Fig. 3.8. At the very beginning of the conceptualization phase , the product to be engineered is defined in terms of technical specifications as determined by business needs and requirements, ensuring that only feasible, cost-effective products are launched in the market.
The phases shown in Fig. 3.8 can be slightly modified to reflect the influence of the ANSI/EIA 632 model, as shown in Fig. 3.9 (Valerdi and Wheaton 2005).

ISO 15288 life cycle phases
Each stage shown in Fig. 3.9 has a distinct purpose and contribution to life cycle management and represents one of the major life cycle periods associated with a product. The stages also describe the major progress and achievement milestones of the product throughout its life cycle. Understanding when systems engineering is performed relative to the product life cycle defines anchor points for the life cycle model. The typical distribution of systems engineering effort across the life cycle phases across the entire organization studied is shown in Table 3.1. It is important to note the standard deviation for each of the phases (Valerdi and Wheaton 2005).
3.4.3 Product Life Cycle Stages
In contrast to the systems engineering approach to life cycle management discussed in Sect. 3.4.2, the product life cycle approach in this section is based on four stages, each with its own characteristics and activities based on the business trying to manage the life cycle of its own particular products, as shown in Fig. 3.10 (URL4 2017).

Product life cycle stages
From Fig. 3.10, it can be seen that after introduction of the product to the market, sales increases quickly in the life cycle growth phase. The transition from the life cycle growth phase to the life cycle maturity phase is shown in the graph in Fig. 3.10 illustrating a recognizable limited value of product sales with a trend to reduced sales numbers, equivalent with a reduced sales volume in the life cycle maturity phase. The decline in sales turnover in the life cycle saturation phase indicates that market volume and market penetration are no longer expandable, which calls for the market launch of a revised product version with additional features or a new product which may result in renewed growth after market launch.
Thus, the product life cycle stages represent the following activities with their corresponding revenues:
-
Introduction Stage : This product life cycle stage may be expensive for a company launching a new product. The size of the market for the new product is small at product launch , which means sales are low; however, sales will increase. On the other hand, the cost of activities, such as R&D, consumer testing , and the marketing needed to launch the product, can be high, especially if the product is targeting a competitive sector.
-
Growth Stage : This product life cycle stage is typically characterized by a strong growth in sales and profits; and because the company can start to benefit from economies of scale in production, the profit margins, as well as the overall amount of profit, will increase. This makes it possible for businesses to invest more money in promotional activity to maximize the potential of this product life cycle stage.
-
Maturity Stage : During this product life cycle stage, the product is established; and the aim for the manufacturer is to maintain the market share it has built up. This is probably the most competitive time for most products, and businesses need to invest wisely in any marketing they undertake. They also need to consider any product modifications or improvements to the production process which might give them a competitive advantage .
-
Decline Stage : During this product life cycle stage, the market for a product will start to shrink, known as the decline stage. This shrinkage could be due to the market becoming saturated or because the consumers are migrating to a different type of product. While this product life cycle stage may be inevitable, it may still be possible for companies to make some profit by migrating to less expensive production methods and cheaper markets.
3.4.4 Software Life Cycle Processes
Standard ISO/IEC 12207:2008 establishes a common framework for software life cycle processes which is based on a well-defined terminology that can be used by the software industry. It contains processes, activities , and tasks that are to be applied during the acquisition of a software product or service and during the supply, development, operation, maintenance, and disposal of software products. Software includes the software portion of firmware (URL5 2017).
Standard ISO/IEC 12207 was published on August 1, 1995, and was the first international standard to provide a comprehensive set of life cycle processes, activities, and tasks for software that is part of a larger system and for stand-alone software products and services. That international standard was followed in November 2002 by ISO/IEC 15288 which addressed system life cycle processes. The ubiquity of the software meant that the software and its design processes should not be considered separately from those systems but be considered as an integral part of the system and system design processes. The ISO/IEC 12207 amendments in 2002 and 2004 added process purpose and outcomes to the international standard and established a process reference model in accordance with the requirements of ISO/IEC 15504–2 (URL6 2017).
This international standard, a revision of the amended ISO/IEC 12207, is an initial step in the SC7 harmonization strategy to achieve a fully integrated suite of system and software life cycle processes and guidance for their application .
This revision integrates ISO/IEC 12207:1995 with its two amendments and applies SC7 guidelines for process definition to support consistency and improved usability. Project execution was carefully coordinated with the parallel revision of ISO/IEC 15288:2002 to align structure, terms, and corresponding organizational and project processes (URL6 2017).
This international standard can be used in one or more of the following modes (URL6 2017):
-
By an Organization: To establish an environment of desired processes. These processes can be supported by an infrastructure of methods, procedures, techniques, tools, and trained personnel. The organization may then employ this environment to perform and manage its projects and progress systems through their life cycle stages. In this mode, this international standard is used to assess conformance of a declared, established set of life cycle processes to its provisions.
-
By a Project: To select structure and employ the elements of an established set of life cycle processes to provide products and services. In this mode, this international standard is used in the assessment of conformance of the project to the declared and established environment .
-
By an Acquirer and a Supplier: To develop an agreement concerning processes and activities. Via the agreement, the processes and activities in this international standard are selected, negotiated, agreed to, and performed. In this mode, this international standard is used for guidance in developing the agreement.
-
By Organizations and Assessors: To perform assessments that may be used to support organizational process improvement.
This international standard contains requirements in four clauses (URL6 2017):
-
Clause 6: Defines the requirements for the system life cycle processes
-
Clause 7: Defines the requirements for specific software life cycle processes
-
Clauses of Annex A: Provides requirements for tailoring of this international standard
-
Clauses of Annex B: Provides a process reference model which may be used for assessment purposes
Five informative annexes support the harmonization strategy initiated by this revision (URL6 2017):
-
Annex C: Expands on the history and rationale for the changes and provides high-level traceability among the international standards which were used as the input to this revision
-
Annex D: Describes the alignment of the processes of ISO/IEC 15288 and ISO/IEC 12207, a key focus of this revision
-
Annex E: Provides an example of a process view for usability intended to illustrate how a project might assemble processes, activities, and tasks of ISO/IEC 12207 to provide focused attention to the achievement of product characteristics that have been selected as being of special interest
-
Annex F: Contains some examples of process descriptions that are considered useful to some readers of this international standard
-
Annex G: Provides support for IEEE users and describes relationships of this international standard to IEEE standards
Readers of this international standard are advised to consult Clause 5 to gain an understanding of the key concepts used.
A future technical report (ISO/IEC TR 24748) will describe the relationships between this international standard and ISO/IEC 15288:2008 .
3.5 Exercises
-
What is meant by the term automotive development process ?
-
Describe the characteristics of an automotive development process.
-
What is meant by the term conceptualization phase ?
-
Describe the characteristics of a conceptualization phase.
-
What is meant by the term project phase?
-
Describe the characteristics of a project phase.
-
What is meant by the term validation phase?
-
Describe the characteristics of a validation phase.
-
What is meant by the term Stage-Gate-controlled development process?
-
Describe the characteristics of a Stage-Gate-controlled development process.
-
What is meant by the term computer-aided design ?
-
Describe the characteristics of a computer-aided design.
-
What is meant by the term Bézier surface ?
-
Describe the characteristics of a Bézier surface.
-
What is meant by the term rational B-splines ?
-
Describe the characteristics of a rational B-spline.
-
What is meant by the term nonuniform rational B-splines?
-
Describe the characteristics of nonuniform rational B-splines.
-
What is meant by the term digital mock-up?
-
Describe the characteristics of a digital mock-up.
-
What is meant by the term computer-aided engineering ?
-
Describe the characteristics of computer-aided engineering.
-
What is meant by the term concurrent design?
-
Describe the characteristics of a concurrent design.
-
What is meant by the term simultaneous engineering?
-
Describe the characteristics of a simultaneous engineering development process.
-
What is meant by the term virtual reality?
-
Describe the characteristics of the virtual reality method.
-
What is meant by the term augmented reality ?
-
Describe the characteristics of the augmented reality method.
-
What is meant by the term requirements engineering?
-
Describe the characteristics of the requirements engineering method.
-
What is meant by the term multiparameter optimization process?
-
Describe the characteristics of the multiparameter optimization process.
-
What is meant by the term modularization?
-
Describe the characteristics of the modularization process.
-
What is meant by the term platform?
-
Describe the characteristics of a platform.
-
What is meant by the term virtual product creation?
-
Describe the characteristics of the virtual product creation process.
-
What is meant by the term product data management?
-
Describe the characteristics of a product data management system.
-
What is meant by the term CAD pipeline?
-
Describe the characteristics of a CAD pipeline.
-
What is meant by the term STEP standard?
-
Describe the characteristics of the STEP standard.
-
What is meant by the term finite element analysis?
-
Describe the characteristics of the finite element analysis.
-
What is meant by the term systems integration?
-
Describe the characteristics of systems integration architecture.
-
What is meant by middleware?
-
Describe the middleware characteristics.
-
What is meant by the term product life cycle management?
-
Describe the characteristics of product life cycle management.
-
What is meant by the term product?
-
Describe the characteristics of a product.
-
What is meant by the term intangible product?
-
Describe the characteristics of an intangible product.
-
What is meant by the term physical, tangible product?
-
Describe the characteristics of a physical, tangible product.
-
What is meant by the term loss of control in life cycle management?
-
Describe the characteristics of loss of control in life cycle management.
-
What is meant by the term systems engineering?
-
Describe the characteristics of systems engineering.
-
What is meant by the term utilization phase?
-
Describe the characteristics of the utilization phase.
-
What is meant by the term evolution phase?
-
Describe the characteristics of the evolution phase.
-
What is meant by the term ultimate disposal phase?
-
Describe the characteristics of the ultimate disposal phase.
-
What is meant by the term product life cycle stages?
-
Describe the characteristics of the product life cycle stages.
-
What is meant by the term introduction stage?
-
Describe the characteristics of the introduction stage.
-
What is meant by the term growth stage?
-
Describe the characteristics of the growth stage.
-
What is meant by the term maturity stage?
-
Describe the characteristics of the maturity stage.
-
What is meant by the term decline stage?
-
Describe the characteristics of the decline stage.
-
What is meant by the term software life cycle process?
-
Describe the characteristics of the software life cycle process.
-
What is meant by the term ISO/IEC 12207:2008?
-
Describe the characteristics of the ISO/IEC 12207:2008.
-
What is meant by the term clauses?
-
Describe the characteristics of a clause.
References and Further Reading
(Anderl and Trippner 2000) Anderl, R., Trippner, D. (Ed.): STEP Standard for the Exchange of Product Model Data (in German). Vieweg and Teubner Publ., 2000
(Becker and Zirpoli 2003) Becker, C. M., Zirpoli, F.: Organizing new Product Development: Knowledge Hollowing-out and Knowledge Integration. – The Fiat Auto Case. International Journal of Operations and Production Management, Vol. 23, No. 9, pp. 1033–1063, 2003
(Bézier 1986) Bézier, P.: The Mathematical Basis of UNISURF CAD System. Butterworths Publ., 1986
(Bilgic and Rock 1997) Product Data Management: State of the Art and the Future. Proceedings of DETC’97 ASME Design Engineering Technical Conferences, 1997
(Buiga 2012) Buiga, A.: Investigating the role of MQB Platform in Volkswagen Group’s Strategy and Automobile Industry. International Journal of Academic Research in Business and Social Sciences, Vol. 2, No. 9, pp. 391–399, 2012
(Colotla et al. 2003) Colotla, I., Shi, Y., Gregory, M.: Operation and Performance of International Manufacturing Networks. International Journal of Operations and Production Management, Vol. 23, No. 10, pp.1184–1206, 2003
(Cooper 2017) Cooper, R. G.: Stage-Gate: Roadmap for New Product Development. Published by Product Development Institute, 2017. Available from: http://www.prod-dev.com/stage-gate.php
(Cooper and Edgett 2005) Cooper, R. G., Edgett, S. J.: Lean, Rapid, and Profitable New Product Development. Published by Product Development Institute, 2005
(Cusumano 2008) Cusumano, M. A.: Managing software development in globally distributed teams. Communications of ACM, Vol 51, Issue 2, p 15–17, Feb 2008
(Cusumano and Nobeoka 1998): Cusumano, M., Nobeoka, K.: Thinking beyond Lean, The Free Press, New York, 1998
(Davis 2011) Davis, A. M.: Requirements Bibliography; http://www.reqbib.com/
(Dorfmann and Thayer 1990) Dorfmann, M., Thayer, R. H.: System and Software Requirements Engineering. IEEE Computer Society Press, 1990
(DSMC 1990) Defense Systems Management College: Systems Engineering Management Guide, Washington, DC, U.S. Government Printing Office, 1990
(EIA&IS/632/1998) Systems Engineering, Washington, D.C., Electronic Industries Association (EIA), 1994
(Eigner and Stelzer 2013) Eigner, M., Stelzer, R.; Product Lifecycle Management – A Guide for Product Development and Life Cycle Management (in German), 2nd ed, Springer, Berlin Heidelberg, 2009
(Faulconbridge and Ryan 2014) Faulconbridge, I., Ryan, M. J.: Systems Engineering Practice. Argos Press 2014
(Gausemeier and Plass 2013) Gausemeier, J., Plass, C.: Future-oriented company design - strategies, business processes and IT systems for the production of tomorrow (in German). Carl Hanser Publ. 2013
(Gulati et al. 2000) Gulati, R., Nohria, N., Zaheer, A.: Strategic Networks. Strategic Management Journal, Vol. 21, pp. 203–215, 2000
(Gusig and Kruse 2010) Gusig, L.-O., Kruse, A. (Eds): Vehicle Development in the Automotive Industry - Current Tools for Practical Use (in German). Carl Hanser Publ., 2010
(Grieb 2010) Grieb, P.: Digital Prototyping – Virtual Product Development in Mechanical Engineering (in German). Carl Hanser Publ., 2010
(Grieves 2006) Grieves, M.: Product Lifecycle Management. Tata McGraw-Hill, 2006
(Haas 2000) Haas, R.: Engineering Knowledge Management - Current status and future challenges. Proceed. ICE Conference, Toulouse, France, 2000
(Haas and Sinha 2004) Haas, R., Sinha, M.: Concurrent Engineering at Airbus – A Case Study. Internat. J. of Manufacturing Technology and Management (IJMTM) Vol 6, No 3, 2004.
(Haskins 2006) Haskins, C.: Systems Engineering Handbook – Version 3. International Council of Systems Engineering, 2006
(Holweg 2008) Holweg, M.: The Evolution of Competition in the Automotive Industry. In: Build to Order, pp. 13–34, Eds. Perry, G., Graves, S. Springer Publ., 2008
(ISO/IEC 29148 2011 ) ISO/IEC 29148 FDIS Systems and Software Engineering– Life Cycle Processes–Requirements Engineering, 2011
(Körber and Möller 2003) Körber, C., Möller, D. P. F.: Dynamic Depth Triangulation of Large NURBS Surfaces in Real-Time and its Application to Geoscience. In: Proceed. 4th Mathmod Conf., pp. 618–622. Eds.: I. Troch, F. Breitenecker, ARGESIM Report, Vol. 24, 2003
(Korth 2003) Korth, K.: Platform reductions versus demands for specialization. Automotive Design and Production, Vol. 115, No. 10, pp. 14–16. 2003
(Kotonya and Sommerville 1998) Kotonya, G., Sommerville, I.: Requirements Engineering. Wiley & Sons, 1998
(Lake 1996) Lake, J.: Unraveling the Systems Engineering Lexicon. Proceedings of the INCOSE Symposium, 1996
(Lampón et al. 2015) Lampón, J., Cabanelas, P., Benito, J. G.: The Impact of Implementation of a Modular Platform Strategy in Automobile Manufacturing Networks. Governance and Economics Research Network Working Paper B, 2015
(Lampón and Cabanelas, 2014) Lampón, J. F., Cabanelas, P.: La Estrategia de Platformas Modulares “Una Nueva Revolución en la Organización de la Producción en la Sector del Automóvil”. University Business Review, Vol. 42, pp. 14–31, 2014
(Lee et al. 2011) Lee, C., Leem, C. S., Hwang, I.: PDM and ERP Integration Methodology using Digital Manufacturing to Support Global Manufacturing. Int J Adv Manuf Technol., Vol. 53, No. 1, pp. 399–409, 2011. doi:https://doi.org/10.1007/s00170-010-2833-x
(Miltenberg 2009) Miltenburg, J.: Setting Manufacturing Strategy for a Company’s International Manufacturing Network. Internat. J. of Production Research, Vol. 47, No. 22, pp. 6179–6203, 2009
(Möller 2000) Möller, D. P. F.: Virtual Reality: A Methodology for Advanced Modeling and Simulation of Complex Dynamic Systems. In: 3rd Mathmod, pp. 505–508, Eds.: I. Troch, F. Breitenecker, ARGESIM Publ., 2000
(Möller 2004) Möller, D. P. F.: Virtual Reality Framework for Surface Reconstruction. In: Networked Simulation and Simulated Networks, pp. 428–430, Ed. G. Horton, SCS Publ. House, 2004
(Möller 2016) Möller, D. P. F.: Guide to Computing Fundamentals in Cyber-Physical Systems – Concepts, Design Methods, and Applications. Springer Publ. 2016
(Muffatto 1999) Muffatto, M.: Introducing a Platform Strategy in Product Development. Internat. J. of Production Economics, Vol. 60/61, pp. 145–153, 1999
(Muffatto and Roveda 1999) Muffatto, M., Rodeda, M.: Developing Product Platforms: Analysis of the Development Process. Technovation, Vol. 20, No. 11, pp. 617–630, 1999
(Prasad 2003) Prasad, C. S. K.: Global Virtual Teams: A Capability Centric Model – Degree of Virtualness in Capabilities and Predictors. Indian Institute of Science (IISc), 2003
(Patchong et al., 2003) Patchong, A., Lemoine, T., Kern, G.: Improving car body production at PSA Peugeot Citrroen. Interfaces, Vol. 33, No. 1, pp. 36–49, 2003
(Piegl and Tiller 1997) Piegl, L., Tiller, W.: The NURBS Book. Springer Publ. 1997
(Prautzsch et al. 2002) Prautzsch, H., Boehm, W., Paluszny, M.: Bézier and B-Spline Techniques. Springer Publ. 2002
(Robertson and Ulrich 1998) Roberston, D., Ulrich, K.: Planning for Product Platforms. In: Sloan Management Review, Vol. 39, Issue 4, pp 19ff, 1998
(Rogers 2001) Rogers, D. F.: Introduction to Nurbs. Morgan Kaufmann Publ. 2001
(Rudberga and Olhagerb 2003) Rudberga, M., Olhagerb, J.: Manufacturing Natworks and Supply Chains an Operations Strategy Perspective. Omega Vol. 31, pp. 29–39, 2003
(Saaksvuori and Immonen 2008) Saaksvuori, A., Immonen, A.: Product Lifecycle Management. Springer Publ. 2008
(Schoenberg 1967) Schoenberg, I. J.: On Spline Functions. In: Sischa, O. (Ed.) In-equalities, pp. 255–291. Academic Press 1967
(Schuh 2012) Schuh, G.: Innovation Management (in German) Ed. Schuh, G. Springer Publ. 22012
(Schumaker 1981) Schumaker, L. L.: Spline functions: Basis Theory, Wiley Publ., 1981
(SECMM-95-01) Systems Engineering Capability Maturity Model, Version 1.1, Carnegie Mellon University, Pittsburgh, P.A., Software Engineering Institute, 1995
(Sehgal and Gorai 2012) Sehgal, B., Gorai, P.: Platform Strategy will shape future of OEMs. White Paper Evalueserve, 2012
(Seiffert and Rainer 2008) Seiffert, U., Rainer, G. (Eds): Virtual product design for vehicle and drive in cars (in German) Vieweg and Teubner Publ., 2008
(Sendler and Waver 2011) Sendler, U., Waver, U.: From PDM to PLM (in German), Carl Hanser Publ., 2011
(Shi and Gregory 1998) Shi, Y., Gregory, M.: International Manufacturing Networks to Develop Global Competitive Capabilities. Journal of Operations Management, Vol. 16, pp. 195–214, 1998
(Sinha and Haas 2006) K. Sinha, K., Haas, R., An Architecture for Integrated Simulation Driven Design, Industrial Simulation Conference (ISC) 2006, Palermo, Italy
(Smith and Reinertsen 1998) Smith, P. G., Reinertsen, D. G.: Developing Products in Half the Time: New Rules, New Tools. John Wiley & Sons Inc., 1998
(Sörensen 2006) Sörensen, D.: The Automotive Development Process – A Real Options Analysis. Deutscher Universitäts Verlag, 2006
(Spath and Kern 2003) Spath, D., Kern, P. (Eds.): Office 21 - More performance in innovative work environments (in German). Egmont vgs Publ., 2003
(Stark 2011) Stark, J.: Product Lifecycle Management. Springer Publ., 2011
(Stark 2016) Stark, J.: Product Lifecycle Management, Volume 2. Springer Publ. 2016
(Suk et al., 2007) Suk, E., de Weck, O., Kim, I. Y., Chang, D.: Flexible Platform Components Design under Uncertainty. Journal of Intelligent Manufacturing, Vol. 18, No. 1, pp. 115–126, 2007
(Thayer and Dorfmann 1997) Thayer, R. H., Dorfmann, M.: Software Requirements Engineering. Wiley Publ., 1997
(Tiller 1983) Tiller, W.: Rational B-Splines for Curve and Surface Representation. IEEE Comput. Graph Appl. Vol. 3, pp. 61–69, 1983
(Valerdi and Wheaton 2005) Valerdi, R., Wheaton, M.: ANSI/EIA 632 As a Standard WBS for COSYSMO. Proceedings 5th Aviation, Technology, Integration, and Operations Conference (ATIO), Arlington, Virginia, 2005
(Vereecke and Van Dierdonck 1999) Vereecke, A., Van Dierdonck, R.: Design and Management of International Plant Networks. Research Report Gent Academia Press, 1999
(Verner et al. 2005) Verner, J. K., Cox, S., Bleistein, S., Cerpa, S.: Requirements Engineering and Software Project Success: An Industrial Survey in Australian and the U.S.. Australian Journal of Information Systems, Vol. 13, No. 1, 2005
(Wilhelm 1997) Wilhelm, B.: Platform and modular concept at Volkswagen – Their effect on the assembly process. In: Transforming Auto Assembly. Shimokawa, K., Jurgens, U., Fujimoto, T. (eds.), Springer Publ., 1997
(Woodward 1987) Woodward, C. D.: Blends in Geometric Modeling. In: Martin, R. R. (Ed.), Mathematical Methods of Surfaces II, pp 255–297. Oxford University Press, 1987
Links
(URL1 2017) http://www.stage-gate.com/resources_stage-gate.php
(URL2 2017) http://wirtschaftslexikon.gabler.de/Archiv/14455/simultaneous-engineering-v6.html
(URL3 2017) http://en.wikipedia.org/wiki/Requirements_engineering#cite_note-5
(URL4 2017) http://productlifecyclestages.com/
(URL5 2017) http://www.iso.org/iso/catalogue_detail?csnumber=43447
(URL6 2017) https://www.iso.org/obp/ui/#iso:std:iso-iec:12207:ed-2:v1:en
(URL7 2017) http://www.prostep.org/en/medialibrary/publications/?no_cache=1
(URL8 2017) http://www.daimler.com
(URL9 2017) http://www.ashokleyland.com
Author information
Authors and Affiliations
Rights and permissions
Copyright information
© 2019 Springer International Publishing AG, part of Springer Nature
About this chapter

Cite this chapter
Möller, D.P.F., Haas, R.E. (2019). Automotive Research and Development. In: Guide to Automotive Connectivity and Cybersecurity. Computer Communications and Networks. Springer, Cham. https://doi.org/10.1007/978-3-319-73512-2_3
Download citation
DOI: https://doi.org/10.1007/978-3-319-73512-2_3
Published:
Publisher Name: Springer, Cham
Print ISBN: 978-3-319-73511-5
Online ISBN: 978-3-319-73512-2
eBook Packages: Computer ScienceComputer Science (R0)