
Abstract
Quantitative and verbal aptitude tests are widely used in the context of student admissions and pre-employment screening. In contrast, there has been “contemporary neglect” of the potential for organizations to use spatial abilities testing to make informed decisions on candidates’ success in educational settings (Wai J, Lubinski D, Benbow CP, J Educ Psychol 101:817–835, 2009) and the workplace. We begin with a review of the research literature on the validity of spatial ability tests for predicting performance in STEM fields (e.g., engineering, surgery, mathematics, aviation). We address the controversy regarding the extent to which spatial abilities provide incremental validity beyond traditional measures of academic aptitude. We then present results from over a decade of U.S. Air Force research that has examined the validity of spatial ability tests relative to verbal and quantitative measures for predicting aircrew and pilot training outcomes. Finally, consistent with meta-analyses examining pilot training outcomes across several countries (e.g., Martinussen M, Int J Aviat Psychol 6:1–20, 1996), we present results showing spatial ability tests add substantive incremental validity to measures of numerical and verbal ability for predicting pilot training outcomes. Hence, organizations that fail to include spatial testing in screening may be overlooking many individuals most likely to excel in STEM fields. We conclude with a discussion of potential challenges associated with spatial ability testing and provide practical recommendations for organizations considering implementing spatial ability testing in student admissions or personnel selection.
Access provided by CONRICYT-eBooks. Download chapter PDF
Keywords
1 Introduction
Quantitative and verbal aptitude tests enjoy extensive use in the context of student admissions and organizational pre-employment screening/selection systems. Traditional measures of general cognitive ability found in many standardized tests are strong, positive predictors of both academic (Frey and Detterman 2004; Jensen 1998; Kuncel et al. 2001) and occupational (Hunter 1986; Jensen 1998; Schmidt and Hunter 2004) success. However, for civilian and military STEM (science, technology, engineering, and mathematics) fields, research additionally suggests spatial ability is a critical predictor of field and career success (National Research Council [NRC] 2015; Lubinski 2010; Uttal and Cohen 2012; Wai et al. 2009). Wai and colleagues (2009) demonstrate spatial abilities play a critical role in predicting adolescent achievement in STEM careers above quantitative and verbal ability, and characterize the failure to improve talent identification via spatial ability assessment nothing less than “contemporary neglect” (p. 817). Similarly, Lubinski (2010) asserts identification of spatial ability is a proverbial “sleeping giant” for improving identification and development of talent in STEM fields.
Most research linking spatial ability with STEM education and career success involves assessment of spatial visualization. Spatial visualization is the process of apprehending, encoding, and mentally manipulating spatial forms within and between one, two, or three-dimensional space (Carroll 1993; Uttal and Cohen 2012). Other forms of spatial ability include visual memory, closure and perceptual speed, and kinesthetic coordination (Carroll 1993; NRC 2015). Spatial ability has consistently demonstrated moderate-to-strong correlational relationships with and predictive validity of performance in STEM fields including human physiology (Rochford 1985), radiology and dentistry (Hegarty et al. 2007), geology (Hambrick et al. 2011), chemistry (Stieff 2004, 2007), and mathematics (Koedinger and Anderson 1990). In a broad review of spatial abilities and STEM field success, Uttal and Cohen (2012) conclude spatial cognition is most predictive of STEM performance and success when participants lack domain-specific knowledge; heightened spatial ability may serve to facilitate integration of STEM-related concepts into undeveloped mental models. However, as field-specific STEM knowledge increases via educational attainment and applicable mental models are developed and refined, the relative impact of spatial ability decreases (Ackerman 1988; Hambrick et al. 2011; Hambrick and Meinz 2011). Thus, for those new to STEM fields, initial spatial ability may set the trajectory for long-term success.
Not only does spatial ability predict STEM field career success, it adds incremental predictive validity beyond predictors of quantitative and verbal aptitude on standardized tests like the Scholastic Aptitude Test (SAT) (Shea et al. 2001; Webb et al. 2007) and the Graduate Record Exam (GRE) (Wai et al. 2009). Wai and colleagues (2009) summarize and extend five decades of spatial abilities research examining a sample of 400,000 high school students (grades 9 through 12) tracked via Project TALENT in the 1960s and 1970s (Wise et al. 1979) along with contemporary GRE data and the Study of Mathematically Precocious Youth (Lubinski and Benbow 2000). The authors demonstrate mathematical and spatial ability are the two greatest predictors of STEM career success and degree attainment, and that spatial ability predicts success in STEM fields beyond just mathematical aptitude.
Ambivalence to adopt spatial abilities testing in talent identification and selection can be partially attributed to reported gender differences on spatial ability measures (see Linn and Peterson 1985) and persistent under-representation of women in STEM fields (Ceci et al. 2009; Halpern 2012; Wai et al., 2009). Further complicating gender differences are the impact of cultural influence and gender stereotypes. For example, males consistently provide higher self-estimates of general, mathematical, and spatial ability over their female peers (Syzmanowicz and Furnham 2011). However, gender differences in spatial ability are also a function of the spatial ability being assessed, the test used, and gender composition of testing samples (Barron and Rose 2013; Linn and Peterson 1985; Miller and Halpern 2013). Ultimately organizations must weigh potential advantages and disadvantages of assessing spatial ability when selecting candidates for highly-specialized organizational roles.
One highly-specialized, applied STEM field is military aviation. In the United States Air Force (USAF), combat systems officers (CSO) serve as mission commanders of multi-person aircraft, coordinating electronic warfare and intelligence, weapons systems, and navigation/communications (Olea and Ree 1994). Air battle managers (ABM) provide “big picture” command and control support for air missions, ranging from risk management to location, identification, and pursuit of enemy targets (Carretta 2008; Miller 1997). In the cockpit pilots simultaneously operate complex machinery while maintaining “continuous perception of self and the aircraft in relation to the dynamic environment of flight, threats, and mission” and the ability to forecast and execute tasks (Carretta et al. 1996, p. 22). Hunter and Burke (1994) meta-analyzed decades of aviation research noting assessment of spatial ability has substantial cost benefits for military pilot selection. In USAF pilot trainees, spatial ability positively predicts training grades (i.e., academic, daily flight, check flight, and class rank) as well as pilot training graduation/attrition. A meta-analysis across 11 countries (Martinussen 1996), and recent international studies (de Kock and Schlecter 2009; Maroco and Bartolo-Ribeiro 2013) further support the validity and generalizability of spatial abilities for predicting pilot training success. Extending past training, seasoned USAF pilots demonstrate better metric spatial relation as well as mental rotation in relation to their non-pilot counterparts (Dror et al. 1993; King et al. 2013). Spatial ability also plays a role in ameliorating spatial disorientation, a critical skill in military aviation during high-pressure combat missions and immediate threat situations (Webb et al. 2012).
The U.S. military is the largest employer of young adults ages 18–29, and military aviation frequently involves training applicants with little or no prior aviation experience (Dickinson 2012; Hunter and Burke 1994). Recalling the critical role initial spatial ability has in the trajectory of success for those lacking domain-specific expertise (Hambrick et al. 2011; Hambrick and Meinz 2011), military aviation has a vested interest to accurately identify, select, and classify spatial talent. In this chapter we examine the role spatial ability plays in predicting primary flight training outcomes for USAF pilot and aircrew trainees. First, we examine similarities between spatial ability and perceptual speed tests, determining them to be facets of spatial cognition. We additionally examine how spatial cognition tests (including both two and three-dimensional spatial ability and perceptual speed measures) differ from quantitative and verbal ability. Second, we use a meta-analytic approach to examine the relative predictive validity of spatial cognition tests relative to quantitative, verbal, and technical knowledge tests. Finally, we examine incremental predictive validity of spatial cognition tests above traditional quantitative and verbal aptitude for predicting “hands on” flying and academic pilot training success.
2 Method
Before entering aircrew training, all USAF officer candidates are screened on the Air Force Officer Qualifying Test [AFOQT] (Caretta and Ree 1996; Drasgow et al. 2010; Skinner and Ree 1987), a battery of ability tests including both traditional academic aptitude (verbal, quantitative) measures like those included on the SAT/ACT or in other college admissions testing, as well as several non-academic aptitude measures assessing spatial ability and technical knowledge. AFOQT scores are used to award US Air Force Reserve Officer Training Corps (AFROTC) scholarships and to qualify applicants for officer commissioning through ROTC, Officer Training School (OTS), and the Airman Education and Commissioning Program (AECP). It also qualifies applicants for aircrew training specialties such as combat system officers (CSO; formerly navigators), air battle managers (ABM), and remotely-piloted aircraft (RPA) pilots provided they clear other educational, fitness, medical, moral, and physical requirements (Carretta 2008; Carretta and Ree 1995; Olea and Ree 1994).
3 Study 1 Method: AFOQT Factor Analysis
We examine five academic subtests most similar to those used in traditional college admissions testing as well as seven distinct AFOQT aptitude subtests with a spatial component. While the AFOQT itself has evolved over time, we focus on form Q used from 1994 to 2005 which included a larger number of spatial ability and perceptual speed tests in operational classification compared to AFOQT forms S and T (see Figs. 2.1 and 2.2) (Air Force Personnel Testing 2014; Carretta 2008; DSYX 2015; Weissmuller et al. 2004). Academic tests include Reading Comprehension, Verbal Analogies, Word Knowledge, Arithmetic Reasoning, and Math Knowledge. Spatial-based tests include Block Counting, Electrical Maze, Hidden Figures, Mechanical Comprehension, Rotated Blocks, Scale Reading, and Table Reading. For sample spatial test questions see Appendix A. Although several published analyses have documented the evolving factor structure of the AFOQT (c.f. Carretta and Ree 1996; Drasgow et al. 2010; Glomb and Earles 1997; Skinner and Ree 1987), for ease of interpretation, the two AFOQT subtests assessing prior aviation knowledge and exposure (Aviation Information and Instrument Comprehension) are excluded from our analysis to more readily focus on aptitude and not prior knowledge. Additionally, Form Q quantitative subtest Data Interpretation is excluded to better replicate the quantitative composite used in operational AFOQT form T (i.e., Arithmetic Reasoning and Math Knowledge only) (DSYX 2015).

Academic subtests administered as part of the AFOQT from Form Q through current Form T. An “x” denotes test was used in officer selection while shaded squares indicate test administration but no use in officer selection

Spatial subtests administered as part of the AFOQT from Form Q through current Form T. An “x” denotes test was used in officer selection while shaded squares indicate test administration but no use in officer selection
Between February 1994 and September 2006, 34,184 AFROTC officer candidates completed the AFOQT form Q, of which 30,025 ROTC candidates had AFOQT subtest-level data available in the Defense Manpower Data Center (DMDC) database. Candidates were predominately male (74.41 %) and were on average 20.02 years old. Demographically, 76.66 % of candidates indicated as White/Caucasian, 8.79 % African-American, 5.46 % Asian-American, 0.82 % Native-American, 0.30 % Pacific-Islander; 8.52 % declined to provide demographic data. For study one we completed a principal components analysis of the 13 non-aviation-specific subtests using an orthogonal varimax rotation, examined associated scree plots, and retained factors with Eigenvalues >1.
4 Study 1 Results: AFOQT Factor Analysis
Initial correlations between subtests were calculated with results indicating a significant degree of inter-correlation between subtests and evidence of subtest factorability [Table 2.1: rs =.13–.69, ps <.0001].Results revealed a two-factor structure and adequate fit for the data [Kaiser’s sampling adequacy =.90, RMSRdiagonal =.07, RMSRoff-diagonal partials =.17,commonality estimatesfinal >.427].A spatial cognition factor [factor loadings =.662–.740] emerged consisting of Block Counting, Scale Reading, Electrical Maze, Rotated Blocks, Table Reading, and Hidden Figures.This spatial factor had an eigenvalue of 5.35 and explained 44.58 % of variance of the factor structure.A second, academic aptitude factor [factor loadings =.831–.877] emerged consisting of verbal aptitude measures Word Knowledge, Reading Comprehension, and Verbal Analogies, with an eigenvalue of 1.53 and explained an additional 12.76 % of the factor structure.Two quantitative aptitude measures (Arithmetic Reasoning, Math Knowledge) and one spatial measure (Mechanical Comprehension) did not readily load on either factor [cross-factor loadings =.502–.575] (Table 2.2).Results indicate where cross-loading existed it was for subtests requiring both a certain academic reading level (i.e., to extract information from word problems or to use certain terminology) as well as specific level of spatial ability (i.e., interpretation of visuospatial diagrams and figures).
5 Study 1 Discussion: AFOQT Factor Analysis
Results of the subtest-level exploratory factor analysis demonstrate academic and spatial aptitude tests form distinct factors, such that individuals who perform most highly on tests of traditional academic measures are different from those who perform most highly on spatial aptitude measures. Results also demonstrate while distinct spatial aptitude tests may differ in important respects (e.g., two-dimensional vs. three-dimensional rotation, level of speededness) (c.f. Carroll 1993; Fleishman et al. 1999; Hegarty et al. 2006), nonverbal spatial test scores for both spatial ability and perceptual speed converge permitting us to speak about overall (i.e., general) spatial cognition distinct from academic aptitude. This diverges somewhat with earlier work by Carretta and Ree (1996) who examined AFOQT form Q factor structure with spatial ability and perceptual speed as both separate (Model 5) and combined factors (Model 6). The authors assert Model 5 [χ 2(83) = 1250; RMSEA =.071; CFI =.957; AASR =.027] as having a significantly better fit than Model 6 [χ 2(84) = 1313; RMSEA =.072; CFI =.954; AASR =.029], but did not examine fit in terms of parsimony/complexity, a necessity in highly-saturated, complex models (Akaike 1974; Mulaik et al. 1989).
Note findings of our factor analysis are also consistent with spatial abilities literature that frequently includes perceptual speed as a facet of overall spatial cognition (NRC 2015). Carroll (1993) as well as Fleishman and colleagues (e.g., Fleishman et al. 1999; Fleishman and Quaintance 1984) propose perceptual speed as part of spatial cognition involving the ability to quickly compare and match visual objects/stimuli. The National Research Council (2015) notes an emerging consensus that spatial abilities might best be conceptualized by “scale of task” as opposed to “type of task”, creating two distinct yet related spatial families: (1) “Small scale” tasks involving mental rotation of objects and (2) “large scale” tasks involving navigation and way-finding (Hegarty et al. 2006). In light of current study factor analysis results and literature denoting perceptual speed as a facet of overall spatial cognition (Carroll 1993; Fleishman et al. 1999; Fleishman and Quaintance 1984), we examine the incremental validity of AFOQT form Q spatial ability and perceptual speed tests on academic and hands-on pilot training outcomes.
6 Study 2 Method: Meta-analysis of AFOQT Predictive Validity
The use of meta-analytic techniques provides the ability to assess statistical commonality across time and multiple study formats. Study two examines the relative predictive impact of traditional (verbal, quantitative) and non-traditional (spatial, processing speed, specialized knowledge) cognitive abilities on USAF pilot (Carretta and Ree 1995), navigator (Olea and Ree 1994; Valentine 1977), and air battle manager (Carretta 2008) training performance. Total sample size across four studies consisted of 10,161 Air Force officer candidates spanning multiple iterations of the AFOQT.
7 Study 2 Results: Meta-analysis of AFOQT Predictive Validity
Meta-analysis of the relative predictive validity of AFOQT subtests was based on data from four studies. The test battery used by Valentine (1997) included AFOQT Form N and several experimental tests. Several of these experimental tests were subsequently administrated and included in later AFOQT validation studies and AFOQT test form versions (O and P) (Carretta and Ree 1995; Olea and Ree 1994). A final article included in the meta-analysis used participants who primarily completed the AFOQT form Q (Carretta 2008). Spatial aptitude content varied across forms of the AFOQT, with five spatial abilities subtests (Blocking Counting, Electrical Maze, Hidden Figures, Mechanical Comprehension, and Rotated Blocks) and two perceptual speed subtests (Table Reading and Scale Reading) being assessed through AFOQT form Q. With development of AFOQT form S, test structure, length, and content were assessed to reduce administration time. Subtests were removed based on two criteria: (1) that removal would minimize impact on total variance explained compared to the 16-subtest AFOQT and (2) the subtest had low or multi-factor loadings (Thompson et al. 2010). Form S retained spatial abilities test Block Counting and perceptual speed test Table Reading for officer candidate selection; spatial tests Hidden Figures and Rotated Blocks were included in Form S but were not part of any operational composite (Drasgow et al. 2010; Weissmuller et al. 2004). As of Form T, only Block Counting and Table Reading are still included in the AFOQT (DSYX 2015).
The meta-analysis examined the predictive validity of several cognitive measures for USAF pilot (Carretta and Ree 1995), navigator (Olea and Ree 1994; Valentine 1977), and air battle manager (Carretta 2008) training performance. Validities of the AFOQT tests were corrected for range restriction (Lawley 1943) and dichotomization (Cohen 1983), and the corrected validities were averaged for verbal, quantitative, spatial, specialized knowledge, and perceptual speed predictor scores. Training performance criteria include graduation/elimination, academic and flight grades, and composite measures of performance. Mean validities for the cognitive constructs varied across occupation and training criteria; quantitative aptitude had the highest mean weighted validity for academic grades: verbal [ρ =.282], quantitative [ρ =.334], aircrew knowledge [ρ =.244], spatial [ρ =.227], and perceptual speed [ρ =.286]. Perceptual speed and aircrew knowledge had the highest mean weighted validities for hands-on flying criteria [i.e., daily and check flight grades]: verbal [ρ =.094], quantitative [ρ =.182], aircrew knowledge [ρ =.209], spatial [ρ =.153], and perceptual speed [ρ =.218]. The weighted mean validities across all occupations and criteria from highest to lowest were: perceptual speed [M rho =.244], quantitative [M rho =.225], aircrew knowledge [M rho =.219], spatial [M rho =.177], and verbal [M rho =.145]. Results are summarized in Table 2.3.
8 Study 2 Discussion: Meta-analysis of AFOQT Predictive Validity
The previous meta-analysis provides a broad examination of the relative predictive validities of traditional (verbal, quantitative) and non-traditional (spatial, processing speed, specialized knowledge) cognitive abilities for US Air Force officer trainees in a variety of military aviation roles. Meta-analysis of AFOQT and officer outcomes indicate the content areas with the highest weighted mean validities across all criteria were perceptual speed, quantitative, and aviation knowledge. Verbal and quantitative aptitudes demonstrate consistently greater predictive validity for traditional academic performance outcomes than do spatial ability or perceptual speed. Spatial ability, aviation knowledge, and perceptual speed demonstrate their highest validity for indicators of “hands-on” pilot performance including basic procedures, daily flight, and check flight outcomes; Quantitative ability also predicts pilot-related outcomes. This is not surprising considering the established statistical relationship between quantitative aptitude, spatial ability, and STEM field success (Uttal and Cohen 2012; Wai et al. 2009).
Study three further explores the predictive relationships of such measures by demonstrating the incremental predictive validity of spatial cognition when used in combination with verbal and quantitative aptitude tests for predicting “hands-on” and academic pilot training outcomes.
9 Study Three Method: Spatial Cognition Incremental Validity
9.1 Overview
In light of our factor analysis of AFOQT form Q in study one and predictive meta-analysis across multiple AFOQT forms in study two, we examine the incremental predictive validity of spatial ability and perceptual speed subtests on daily flight and academic performance for USAF pilots. We identified 905 ROTC officer candidates with valid AFOQT form Q subtest scores and undergraduate pilot training outcome data. These pilot trainees completed the AFOQT between November 1998 and August 2005, attended Specialized Undergraduate Pilot Training (SUPT) between 2001 and 2008, and included pilots who trained in both the older USAF T-37 and the newer T-6 training aircraft.
From 2001 to 2008 the USAF phased out the Cessna T-37 Tweet basic flight training aircraft in favor of the more modern Beechcraft T-6 Texans II (Parie 2008). Critical differences exist between aircraft including increased power and maneuverability in the T-6, a pressurized, digital glass cockpit with Head-Up Display (HUD), and several additional multifunction displays lacking in the T-37 (USAF 2003; USAF National Museum 2015).Periods of aircraft training transition impact both flight instructors and trainees (O’Neil and Andrews 2000), and evidence of transitional impact was observed on pilot trainee daily flight performance evaluation scores in our sample. Trainee daily flight scores for T-6 trainees were significantly lower in 2006 [M = 64.72, SD = 4.61] and 2007 [M = 65.99, SD = 5.03] than in 2008 [M = 66.61, SD = 5.44], [F(2625) = 6.77, p <.002], but not for trainees during the same time period still training in the T-37, F(2300) = 2.84, n.s. Therefore we eliminated T-6 trainees in 2006 and 2007 [N = 360], only including those from 2008 as mean daily flight scores were comparable to 2008 T-37 daily flight scores, M = 66.68, SD = 3.86. In total, 640 (71 %) participants completed basic flight training using the T-37 aircraft while 265 (29 %) trained with the newer T-6.
9.2 Performance Criteria
While in SUPT trainee performance is evaluated via a number of hands-on flying and academic criteria. The current study examines two criteria, one related to “hands-on” daily flight performance and the other related to aviation academic testing performance. Individual daily flight performance involves assessment of trainee skill and ability to execute basic and advanced flying maneuvers and procedures including emergency landing pattern, missed approach, and speed break maneuvers on all flights except check flights (Barron and Rose 2013; Carretta and Ree 1995). Trainee flight performance is assessed daily by instructor pilots during each sortie or mission using a one to five grading scale (no grade/unable or unsatisfactory/fair/good/excellent), providing a consistent and multi-point metric of daily flight performance (Barron and Rose 2013). Daily performance percentage scores are then computed by dividing number of maneuver points obtained by number of maneuver points possible. Academic performance is assessed via written tests of flying fundamentals including procedures, aerodynamics, navigation, aviation meteorology, mission planning, and mishap prevention. The majority of academic assessment takes place during Phase I of primary pilot training, prior to actual flight training (Carretta and Ree 1995; O’Neil and Andrews 2000).
10 Study Three Results: Spatial Cognition Incremental Validity
10.1 Daily Flight Performance
Initial correlations between subtests and outcome variables were calculated, indicating a significant degree of inter-correlation between predictor and outcome variables [Table 2.4: rs =.07–.61, ps <.05]. Using the AFOQT form Q we examined which composition of the five traditional cognitive AFOQT form Q subtests (Reading Comprehension, Verbal Analogies, Word Knowledge, Math Knowledge and Arithmetic Reasoning) were predictive of daily flight performance. All five subtests were entered into a preliminary regression analysis predicting daily flight performance; non-significant subtests Verbal Analogies and Word Knowledge were removed through the process of backwards elimination, p >.05. Quantitative predictors Math Knowledge and Arithmetic Reasoning were summed to create a basic quantitative composite score to reflect the composite used in the current AFOQT form T (DSYX 2015). Finally, the quantitative composite and Reading Comprehension subtest variables were entered into a second regression equation predicting daily flight performance. Results indicate both the quantitative composite [β =.17, p <.0001] and Reading Comprehension subtest [β =.10, p <.01] were significant, positive predictors of participant daily flight performance, F (2905) = 25.97, p <.0001, R 2 =.055).
Hierarchical regression analyses were then performed to determine the incremental predictive validity of spatial ability and perceptual speed over traditional cognitive subtests on participant daily flight performance. In steps one, the quantitative composite and Reading Comprehension subtest were entered as predictors of daily flight performance. In step two, a single spatial ability or perceptual speed subtest was entered as an incremental predictor. This process was repeated for each seven spatial and perceptual speed AFOQT form Q subtests: Mechanical Comprehension, Electric Maze, Block Counting, Rotated Blocks, Hidden Figures, Scale Reading, and Table Reading. Results indicate all spatial and perceptual subtests except Electric Maze had significant incremental predictive validity for daily flight performance: Mechanical Comprehension [β =.143, p <.0001; ΔR 2 =.017, p < 0001], Block Counting [β =.101, p <.01; ΔR 2 =.009, p <.01], Rotated Blocks [β =.135, p <.0001; ΔR 2 =.017, p <.0001], Hidden Figures [β =.080, p <.05; ΔR 2 =.006, p <.05], Scale Reading [β =.156, p <.0001; ΔR 2 =.019, p <.0001], and Table Reading [β =.170, p <.0001; ΔR 2 =.027, p <.0001] (Table 2.5).
10.2 Pilot Academic Performance
We once again examined optimal composition of five traditional AFOQT form Q subtests (Reading Comprehension, Verbal Analogies, Word Knowledge, Math Knowledge and Arithmetic Reasoning) that were predictive of pilot trainee academic performance. All five subtests were entered into a regression equation, and subtests were removed using a backward elimination approach, p >.05. As with daily flight performance, the optimal composition of predictors of pilot academic performance was a quantitative composite of Math Knowledge and Arithmetic Reasoning [β =.302, p <.0001] and the Reading Comprehension subtest [β =.169, p <.0001], F (2905) = 86.21, p <.0001, R 2 =.161).
Hierarchical regression analyses were performed to determine the incremental predictive validity of spatial ability and perceptual speed subtests on pilot trainee academic performance. Traditional cognitive subtests (i.e., the quantitative composite and Reading Comprehension subtest) were entered into step one. In step two, spatial cognition subtests were entered as an additional incremental predictor; this process was repeated for each of seven AFOQT form Q spatial and perceptual speed subtests. Results demonstrate only subtests Mechanical Comprehension [β =.161, p <.0001; ΔR 2 =.022, p <.0001] and Rotated Blocks [β =.119, p <.001; ΔR 2 =.013, p <.001] provide incremental predictive validity over traditional cognitive aptitude subtests for trainee pilot academic performance.
11 Study Three Discussion: Spatial Cognition Incremental Validity
Despite previous factor analysis and structural equation modeling results demonstrating distinct differences between spatial ability and perceptual speed tests on the AFOQT (Carretta and Ree 1996; Drasgow et al. 2010), our factor analysis findings supports the approach of assessing tests as a single spatial cognition factor. This mirrors “Model 6” fitted in Carretta and Ree (1996) which specified AFOQT subtests for spatial ability and perceptual speed as one factor. While the authors ultimately chose a different factor structure separating the two constructs, they did not consider indices of parsimony/complexity in model fit and selection. Doing so would have likely favored the model with a combined spatial/perceptual speed factor. Furthermore, established research literature consistently conceptualizes perceptual speed and spatial ability as distinct yet related facets of overall spatial cognition (Carroll 1993; Fleishman et al. 1999; Fleishman and Quaintance 1984). Therefore we found it prudent to conceptualize these tests as distinct but related facets of overall spatial cognition constructs and examine the incremental validity of both perceptual speed and spatial ability subtests.
Interestingly, perceptual speed tests Scale Reading and Table Reading demonstrated the greatest incremental validity compared to other AFOQT spatial cognition subtests. In all, each spatial subtest with the exception of Electric Maze added significant, incremental predictive validity on participant daily flight performance. Considering the visual nature of executing maneuvers in both simulation and real-world flight situations on a daily basis (Barron and Rose 2013), increased spatial awareness/acuity and associated enhanced perceptual speed likely significantly improves daily trainee performance (Carretta et al. 1996).
In contrast, the pattern observed for daily flight was not repeated when predicting pilot academic performance. Only Mechanical Comprehension and Rotated Blocks demonstrated incremental validity. However, the Mechanical Comprehension subtest in AFOQT form Q often requires solving basic arithmetic problems in the context of mechanical systems. As a result, performance on this subtest would likely relate to quantitative, academic performance, supported by significant correlations between Mechanical Comprehension and Arithmetic Reasoning [r =.37, p <.001] as well as with Math Knowledge [r =.26, p <.001]. Rotated Blocks, in contrast, likely predicts pilot academic performance as Phase I of SUPT commonly makes use of paper-and-pencil scenarios to teach aviation basics like flying fundamentals, navigation, and other hypothetical situations requiring visualization and mental rotation of self and aircraft (Barron and Rose 2013; O’Neil and Andrews 2000). Classroom instruction reliant on visualization-related mental rotation and spatial orientation would favor those with heightened spatial abilities, especially in situations where they lacked domain-specific expertise (Ackerman 1988; Hambrick et al. 2011; Hambrick and Meinz 2011; Uttal et al. 2012).
12 Discussion
In this chapter we presented military aviation as an important exemplar of a STEM field in which many individuals without prior domain-knowledge must be trained to perform effectively each year. We began comparing and contrasting traditional (verbal, quantitative) and non-traditional (spatial ability, perceptual ability, specialized knowledge) tests of cognitive aptitude via exploratory factor analysis. We also examined similarities between spatial ability and perceptual speed, opting to combine them into a single spatial cognition factor. We then examined the predictive validity of spatial ability measures relative to traditional academic admissions tests involving quantitative and verbal abilities. Our meta-analysis replicates examinations of success in other STEM fields (Uttal and Cohen 2012; Wai et al. 2009) in showing that quantitative aptitude was consistently a better predictor of pilot training outcomes than verbal aptitude. Results show traditional academic aptitude tests are generally somewhat stronger predictors of pilot training outcomes than spatial tests. Across multiple studies, meta-analysis results show quantitative tests [ρ =.334] were substantially stronger predictors of purely academic pilot training outcomes than perceptual speed [ρ =.286] or spatial tests [ρ =.227]. In contrast, perceptual speed [ρ =.218] was only a marginally better predictor of practical, “hands on” flight training outcomes compared to quantitative [ρ =.182] and spatial ability tests [ρ =.153]. Considering academic instruction is frequently the foundation of future hands-on training in military aviation (Carretta and Ree 1995; O’Neil and Andrews 2000), organizations choosing a single type of screening might view the content of traditional aptitude testing as sufficient.
However, considering the dual academic and “hands-on” nature of military pilot training, the choice of whether to screen candidates on academic (quantitative) or spatial measures should not be an “either or” conundrum—rather, by combining academic and spatial measures, we suggest organizations are most likely to identify those individuals who not only have the aptitude to excel, but also have the supplemental spatial aptitude to grasp critical STEM concepts in applied fields like military aviation. Hence, study three demonstrates the substantial incremental validity of spatial cognition (spatial ability and perceptual speed) subtests for predicting both hands-on and academic pilot training outcomes.
12.1 Present and Future Challenges to Spatial Abilities Testing: Recommendations
While benefits of selecting for spatially gifted candidates are readily apparent, present and future challenges exist for increasing use of spatial abilities testing for selection and classification purposes. One critical challenge is reducing or minimizing adverse impact to female candidates. Science, technology, engineering, and mathematics fields already suffer from persistent under-representation of women in STEM fields (Ceci et al. 2009; Halpern 2012; Wai et al. 2009), compounded by significant sex differences in performance on spatial abilities measures (Linn and Peterson 1985). While some disparity may be attributed to physiological differences between sexes, still others are the result of cultural, societal, and educational differences between the treatment of male and female students (Miller and Halpern 2013; Syzmanowicz and Furnham 2011). Finally, significant differences in adverse impact exist even among subtests (Barron and Rose 2013; Linn and Peterson 1985; Miller and Halpern 2013). Assembling Objects (AO), the only spatial subtests on the Armed Services Vocational Aptitude Battery (ASVAB), is not used for selection purposes by any branch of the US military. Currently only the Navy uses AO for occupational classification (Held and Carretta 2013). However, Barto et al. (2014) recently suggested adding AO or replacing the ASVAB Mechanical Comprehension subtest in several mechanical-oriented Air Force occupational qualification composites to improve predictive validity and reduce adverse impact.
Specific recommendations to reduce gender inequality from a selection standpoint is to (1) determine the occupational necessity of using spatial abilities testing as selection criteria (i.e., military aviation), (2) select for spatial abilities that serve as significant predictors of performance while minimizing adverse impact (Barron and Rose 2013), (3) identify spatial ability tests and procedures that maximize predictive validity while minimizing adverse impact (Barron and Rose 2013; Linn and Peterson 1985; Miller and Halpern 2013), and (4) provide opportunities for spatial training for both sexes with deficient spatial ability that are otherwise occupationally qualified.
The concept of training “ability” may at first seem counterintuitive as abilities are seen as relatively immutable compared to knowledge and skills. However, evidence shows the use of spatial training can significantly improve spatial ability, and spatial training on specific spatial abilities generalizes to other spatial abilities (Uttal et al. 2013). For example, the use of spatial training to improve mental rotation of three-dimensional objects significantly improved engineering student spatial ability and success of degree obtainment (Sorby 2009). While spatial training can include activities as simple as paper folding (Newcombe 2010) or using popular two-dimensional games like Tetris (Uttal et al. 2013), the incorporation of technology and augmented reality may be key in providing cost-effective, beneficial spatial training to adolescents and adults (Martin-Gutierrez et al. 2010). Considering spatial abilities are critical predictors of STEM success absent domain-specific knowledge (Ackerman 1988; Hambrick et al. 2011; Hambrick and Meinz 2011; Uttal and Cohen 2012), identification and use of spatial training to improve spatial abilities of otherwise qualified candidates provides organizations both a larger applicant pool and a progressive approach to reducing disparity among males and females in STEM fields. Even when disparity between male and female spatial abilities persist post-training, both groups demonstrate improvement to the degree other skills and abilities predicting success in STEM fields like persistence, communication, and creativity become salient (Newcombe 2010).
A final challenge for spatial abilities testing and organizations are that occupations are becoming increasingly integrated with and reliant upon sophisticated technology. Specific to military aviation is the increased use of remotely-piloted aircraft (RPA) for both combat and non-combat roles. The US military has increased number of daily RPA flights steadily for over a decade, with a projected 50 % increase in daily RPA flights by 2019 (Lubold 2015). While advantages of RPA include increased surveillance and reconnaissance capabilities along with reduced risk of pilot casualty, it comes at a cost of requiring pilots to make critical decisions absent spatial information traditionally gained being physically in a cockpit. Piloting from a remote location requires specific spatial acuity to manipulate spatial forms in three-dimensions based on data from two-dimensional screens. Furthermore, RPA pilots must interpret velocity, altitude, and other flight characteristics without the benefit of physical feedback (Tvaryanas 2006). As technology matures it is expected that RPAs will become more automated and autonomous, requiring less emphasis on flying skill and more emphasis on supervisory control and operator-RPA (i.e. human-machine) team functioning (Carretta et al. 2007). Increased automation and autonomy may enable a single pilot to supervise multiple systems. In such a scenario cognitive ability and job knowledge will likely remain important. However, contingent on the effects of automation and supervisory or active pilot-operator roles, specific spatial ability requirements may increase (e.g., perceptual speed) while others decrease.
This concept of physical versus virtual “presence” (see Wirth et al. 2007) is not limited to military aviation – how STEM fields rely on and make use of technology will ultimately determine how (and whether) spatial abilities testing continues to predict STEM field success. Therefore the field and science of spatial abilities testing must continue to develop methods of assessment that accurately reflect how spatial ability is used within technology-dependent STEM fields. Furthermore, organizations must remain cognizant of the benefit of spatial abilities testing while acknowledging changing job roles and reliance on technology will alter how spatial abilities predict occupational performance.
12.2 Limitations
Some limitations of the studies in this chapter should be noted. First, because the purpose of this chapter was to examine incremental predictive validity of spatial cognition beyond traditional cognitive aptitude tests, we did not include aviation-specific knowledge variables in either our factor analysis or incremental validity analyses. Although military aviation and training frequently involves applicants with little or no prior aviation experience (Dickinson 2012; Hunter and Burke 1994), future examination similar to ours should consider including prior knowledge as an additional predictor or covariate. Second, despite our attempts to minimize the impact of training differences, the use of a sample training on two distinctly different aircraft (T-37 vs. T-6) likely introduced some degree of error into our findings. Finally, we examined the incremental validity of seven spatial subtests individually, avoiding attempts at model building to focus on the comparative incremental validity of multiple spatial cognition subtests. Future studies should extend findings to determine which combination of spatial cognition tests would maximize incremental predictive validity over traditional tests of cognitive aptitude.
References
Ackerman, P. L. (1988). Determinants of individual differences during skill acquisition: Cognitive abilities and information processing. Journal of Experimental Psychology, 117, 288–318.
Air Force Personnel Testing. (2014, August 1). AFOQT manual for administration (Form T). Unpublished internal document, United States Air Force.
Akaike, H. (1974). A new look at the statistical model identification. IEEE Transactions on Automatic Control, 19(6), 716–723.
Barron, L. G., & Rose, M. R. (2013). Relative validity of distinct spatial abilities: An example with implications for diversity. International Journal of Selection and Assessment, 21(4), 400–406.
Barto, E., Pena, D., & Alley, W. E. (2014). ASVAB composite study, AFCAPS-FR-2010-0003. Randolph: Air Force Personnel Center, Strategic Research and Development Branch.
Carretta, T. R. (2008). Predictive validity of the Air Force Officer Qualifying Test for USAF air battle manager training performance, AFRL-RH-WP-TR-2009-0007. Wright-Patterson AFB, Dayton: Air Force Research Laboratory, Human Effectiveness Directorate, Crew Systems Interface Division, Supervisory Control Interfaces Branch.
Carretta, T. R., & Ree, M. J. (1995). Air force officer qualifying test validity for predicting pilot training performance. Journal of Business and Psychology, 9, 379–388.
Carretta, T. R., & Ree, M. J. (1996). Factor structure of the air force officer qualifying test: Analysis and comparison. Military Psychology, 8(1), 29.
Carretta, T. S., Perry, D. C., Jr., & Ree, M. J. (1996). Prediction of situational awareness in F-15 pilots. The International Journal of Aviation Psychology, 6(1), 21–41.
Carretta, T. R., Rose, M. R., & Bruskiewicz, K. T. (2007). Selection methods for remotely piloted aircraft system operators. Remotely piloted aircraft: A human systems integration approach. Hoboken: Wiley.
Carroll, J. B. (1993). Human cognitive abilities: A survey of factor-analytic studies. Cambridge: University of Cambridge.
Ceci, S. J., Williams, W. M., & Barnett, S. M. (2009). Women’s underrepresentation in science: Sociocultural and biological considerations. Psychological Bulletin, 135, 218–261.
Cohen, J. (1983). The cost of dichotomization. Applied Psychological Measurement, 7, 249–253.
de Kock, F., & Schlecter, A. (2009). Fluid intelligence and spatial reasoning as predictors of pilot training performance in the South African Air Force (SAAF). SA Journal of Industrial Psychology, 35, 31–38.
Dickinson, B. (2012, January 10). The biggest employer for young Americans is still the US military. Retrieved November 20, 2015 from Business Insider Web site: http://www.businessinsider.com/can-you-guess-the-top-employer-for-young-adults-2012-1
Drasgow, F., Nye, C. D., Carretta, T. R., & Ree, M. J. (2010). Factor structure of the air force officer qualifying test form S: Analysis and comparison with previous forms. Military Psychology, 22(1), 68.
Dror, I. E., Kosslyn, S. M., & Waag, W. L. (1993). Visual-spatial abilities of pilots. Journal of Applied Psychology, 78(5), 763–773.
Fleishman, E. A., & Quaintance, M. K. (1984). Taxonomies of human performance: The description of human tasks. Orlando: Academic.
Fleishman, E. A., Costanza, D. P., & Marshall-Mies, J. (1999). Abilities. In N. G. Peterson, M. D. Mumford, W. C. Borman, P. R. Jeanneret, & E. A. Fleishman (Eds.), An occupational information system for the 21st century: The development of O*NET (pp. 175–196). Washington, DC: American Psychological Association.
Frey, M. C., & Detterman, D. K. (2004). Scholastic assessment or g? The relationship between the scholastic assessment test and general cognitive ability. Psychological Science, 15(6), 373–378.
Glomb, T. M., & Earles, J. A. (1997). Air Force Officer Qualifying Test (AFOQT): Forms Q development, preliminary equating and operational equating, AL/HR-TP-1996-0036. San Antonio: Air Force Human Resources Laboratory, Personnel Research Division.
Halpern, D. F. (2012). Sex differences in cognitive abilities (4th ed.). Oxfordshire: Psychology Press.
Hambrick, D., & Meinz, E. (2011). Limits on the predictive power of domain-specific knowledge and experience for complex cognition. Current Directions in Psychological Science, 20(5), 275–279.
Hambrick, D. Z., Libarkin, J. C., Petcovic, H. L., Baker, K. M., Elkins, J., Callahan, C. N., Turner, S. P., Rench, T. A., & LaDue, N. D. (2011). A test of the circumvention of limits hypothesis in scientific problem solving: The case of geological bedrock mapping. Journal of Experimental Psychology. General, 141(3), 397.
Hegarty, M., Montello, D. R., Richardson, A. E., Ishikawa, T., & Lovelace, K. (2006). Spatial abilities at different scales: Individual differences in aptitude-test performance and spatial-layout learning. Intelligence, 34(2), 151–176.
Hegarty, M., Keehner, M., Cohen, C., Montello, D. R., & Lippa, Y. (2007). The role of spatial cognition in medicine: Applications for selecting and training professionals. In G. Allen (Ed.), Applied Spatial Cognition. Mahwah: Lawrence Erlbaum Associates.
Held, J. D., & Carretta, T. R. (2013). Evaluation of tests of processing speed, spatial ability, and working memory for use in military occupational classification, NPRST-TR-14-1. Millington: Navy Personnel Research, Studies, and Technology.
Hunter, J. E. (1986). Cognitive ability, cognitive aptitudes, job knowledge, and job performance. Journal of Vocational Behavior, 29(3), 340–362.
Hunter, D. R., & Burke, E. F. (1994). Predicting aircraft pilot-training success: A meta-analysis of published research. The International Journal of Aviation Psychology, 4(4), 297–313.
Jensen, A. R. (1998). The “g” factor: The science of mental ability. London: Praeger.
King, R. E., Carretta, T. R., Retzlaff, P., Barto, E., Ree, M. J., & Teachout, M. S. (2013). Standard cognitive psychological tests predict military pilot training outcomes. Aviation Psychology and Applied Human Factors, 3(1), 28–38.
Koedinger, K., & Anderson, J. (1990). Abstract planning and perceptual chunks: Elements of expertise in geometry. Cognitive Science, 14, 511e550.
Kuncel, N. R., Hezlett, S. A., & Ones, D. S. (2001). A comprehensive meta-analysis of the predictive validity of the graduate record examinations: Implications for graduate student selection and performance. Psychological Bulletin, 127(1), 162–181.
Lawley, D. N. (1943). A note on Karl Pearson’s selection formulae. Proceedings of the Royal Society of Edinburgh, Section A, 62, Part 1, 28–30.
Linn, M. C., & Petersen, A. C. (1985). Emergence and characterization of gender differences in spatial abilities: A meta-analysis. Child Development, 56, 1479–1498.
Lubinski, D. (2010). Spatial ability and STEM: A sleeping giant for talent identification and development. Personality and Individual Differences, 49(4), 344–351.
Lubinski, D., & Benbow, C. P. (2000). States of excellence. American Psychologist, 55, 137–150.
Lubold, G. (2015, August 16). Pentagon to sharply expand U.S. drone flights over next four years. Retrieved November 20, 2015 from The Wall Street Journal Web site:http://www.wsj.com/articles/pentagon-to-add-drone-flights-1439768451
Maroco, J., & Bartolo-Ribeiro, R. (2013). Selection of air force pilot candidates: A case study on predictive validity of discriminant analysis, logistic regression, and four neural network types. International Journal of Aviation Psychology, 23, 130–152.
Martín-Gutiérrez, J., Saorín, J. L., Contero, M., Alcañiz, M., Pérez-López, D. C., & Ortega, M. (2010). Design and validation of an augmented book for spatial abilities development in engineering students. Computers & Graphics, 34(1), 77–91.
Martinussen, M. (1996). Psychological measures as predictors of pilot performance: A meta-analysis. The International Journal of Aviation Psychology, 6, 1–20.
Miller, C. B. (1997). USAF TACS battle management: Preparing for high tempo future operations. Master’s Thesis submitted to Marine Corps University, Quantico.
Miller, D. I., & Halpern, D. F. (2013). Can spatial training improve long-term outcomes for gifted STEM undergraduates? Learning & Individual Differences, 26, 141–152.
Mulaik, S. A., James, L. R., Van Alstine, J., Bennett, N., Lind, S., & Stillwell, C. D. (1989). Evaluation of goodness-of-fit indices for structural equation models. Psychological Bulletin, 10(3), 430–445.
National Research Council. (2015). Human capabilities: An agenda for basic research on the assessment of individual and group performance potential for military accession. Washington, DC: The National Academy Press.
Newcombe, N. S. (2010). Picture this: Increasing math and science learning by improving spatial thinking. American Educator, 34(2), 29.
O’Neil, H. F., Jr., & Andrews, D. H. (Eds.). (2000). Aircrew training and assessment. Mahwah: Lawrence Erlbaum Associates.
Olea, M. M., & Ree, M. J. (1994). Predicting pilot and navigator criteria: Not much more than g. Journal of Applied Psychology, 79, 845–851.
Parie, J. (2008, April 8). Tweet complete: T-37 retires after 39 years of service. Retrieved November 3, 2015 from United States Air Force Web site: http://www.af.mil/News/ArticleDisplay/tabid/223/Article/123891/tweet-complete-t-37-retires-after-39-years-of-service.aspx
Rochford, K. (1985). Spatial learning disabilities and underachievement among university anatomy students. Medical Education, 19, 13–26.
Schmidt, F. L., & Hunter, J. (2004). General mental ability in the world of work: Occupational attainment and job performance. Journal of Personality and Social Psychology, 86(1), 162–173.
Shea, D., Lubinski, D., & Benbow, C. (2001). Importance of assessing spatial ability in intellectually talented young adolescents: A 20-year longitudinal study. Journal of Educational Psychology, 93, 604–614.
Skinner, J., & Ree, M. J. (1987). Air Force Officer Qualifying Test (AFOQT): Item and factor analysis of Form O, AFHRL-TR-86-68. Brooks: Air Force Human Resources Laboratory, Personnel Research Division.
Sorby, S. A. (2009). Educational research in developing 3‐D spatial skills for engineering students. International Journal of Science Education, 31(3), 459–480.
Stieff, M. (2004). A localized model of spatial cognition in chemistry. (Doctoral dissertation). Northwestern University, Evanston.
Stieff, M. (2007). Mental rotation and diagrammatic reasoning in science. Learning and Instruction, 17, 219e234.
Strategic Research and Assessment Branch (DSYX). (2015, August). AFOQT information pamphlet (updated August 2015). Retrieved November 30, 2015 from United States Air Force, Air Force Personnel Center Web site:http://access.afpc.af.mil/pcsmdmz/Form%20T.HTML
Syzmanowicz, A., & Furnham, A. (2011). Gender differences in self-estimates of general, mathematical, spatial and verbal intelligence: Four meta analyses. Learning and Individual Differences, 21(5), 493–504.
Thompson, N., Skinner, J., Gould, B. R., Alley, W., Shore, W., Schwartz, K. L., & Weissmuller, J. J. (2010). Development of the Air Force Officer Qualifying Test (AFOQT) form R and implementation of form S. AFCAPS-FR-2010-0003. Randolph: Air Force Personnel Center, Strategic Research and Assessment Branch.
Tvaryanas, A. P. (2006). Human systems integration in remotely piloted aircraft operations. Aviation, Space, and Environmental Medicine, 77, 1278–1282.
United States Air Force. (2003, March 28). T-6A Texan II. Retrieved November 1, 2015 from The United States Air Force Official Web site: http://www.af.mil/AboutUs/FactSheets/Display/tabid/224/Article/104548/t-6a-texan-ii.aspx
USAF National Museum. (2015, May 29). Cessna T-37B Tweet. Retrieved November 3, 2015 from National Museum of the US Air Force, United States Air Force Web site: http://www.nationalmuseum.af.mil/Visit/MuseumExhibits/FactSheets/Display/tabid/509/Article/198031/cessna-t-37b-tweet.aspx
Uttal, D. H., & Cohen, C. A. (2012). Spatial thinking and STEM education: When, why, and how? Psychology of Learning and Motivation, 57, 147–181.
Uttal, D. H., Meadow, N. G., Tipton, E., Hand, L. L., Alden, A. R., Warren, C., & Newcombe, N. S. (2013). The malleability of spatial skills: A meta-analysis of training studies. Psychological Bulletin, 139(2), 352–402.
Valentine, L. D., Jr. (1977). Navigator-observer selection research: Development of a new air force officer qualifying test navigator-technical composite, AFHRL-TR-77-38. Brooks: Air Force Human Resources Laboratory, Personnel Research Division.
Wai, J., Lubinski, D., & Benbow, C. P. (2009). Spatial ability for STEM domains: Aligning over 50 years of cumulative psychological knowledge solidifies its importance. Journal of Educational Psychology, 101, 817–835.
Webb, R. M., Lubinski, D., & Benbow, C. P. (2007). Spatial ability: A neglected dimension in talent searches for intellectually precocious youth. Journal of Educational Psychology, 99(2), 397–420.
Webb, C. M., Estrada, A., III, & Kelley, A. M. (2012). The effects of spatial disorientation on cognitive processing. The International Journal of Aviation Psychology, 22(3), 224–241.
Weissmuller, J. J., Schwartz, K. L., Kenney, S. D., Shore, C. W., & Gould, R. B. (2004). Recent developments in USAF officer testing and selection. Presented at the International Military Testing Association 46th Annual Conference, Brussels, Belgium.
Wirth, W., Hartmann, T., Böcking, S., Vorderer, P., Klimmt, C., Schramm, H., et al. (2007). A process model of the formation of spatial presence experiences. Media Psychology, 9, 493–525.
Wise, L. L., McLaughlin, D. H., & Steel, L. (1979). The project TALENT data bank. Palo Alto: American Institutes for Research.
Author information
Authors and Affiliations
Corresponding author
Editor information
Editors and Affiliations
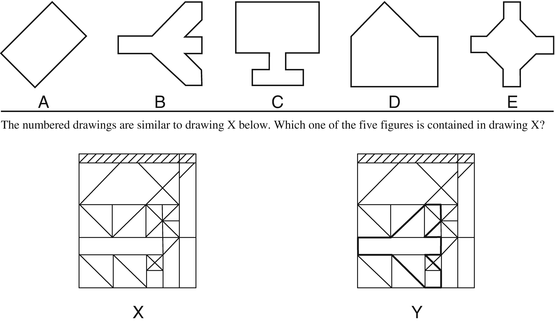
Appendix A: Spatial Subtest Item Examples
Appendix A: Spatial Subtest Item Examples
-
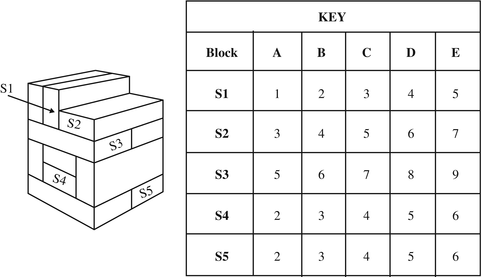
Block Counting:
-
Electrical Maze:
-
Hidden Figures:
-
Mechanical Comprehension 1 (ASVAB Exemplar):
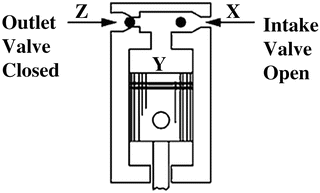
Why does the intake valve open on this pump when the piston goes down?
-
(A)
Air pressure at X is less than air pressure at Y.
-
(B)
Air pressure at Z is less than air pressure at X.
-
(C)
Air pressure at X is greater than air pressure at Y.
-
(D)
Air pressure at Y is greater than air pressure at Z.1 Source: http://official-asvab.com/questions/app/question_mc3_app.htm
-
(A)
-
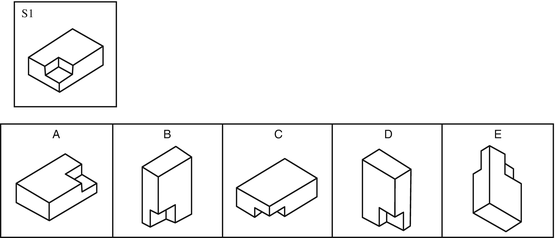
Rotated Blocks:
-
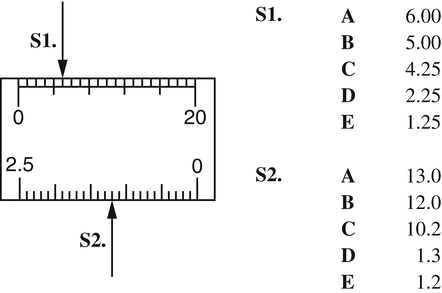
Scale Reading:
-
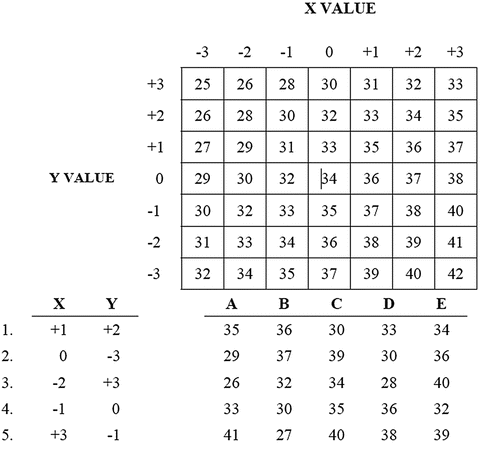
Table Reading:


Rights and permissions
Copyright information
© 2017 Springer International Publishing Switzerland
About this chapter
Cite this chapter
Johnson, J.F., Barron, L.G., Rose, M.R., Carretta, T.R. (2017). Validity of Spatial Ability Tests for Selection into STEM (Science, Technology, Engineering, and Math) Career Fields: The Example of Military Aviation. In: Khine, M. (eds) Visual-spatial Ability in STEM Education. Springer, Cham. https://doi.org/10.1007/978-3-319-44385-0_2
Download citation
DOI: https://doi.org/10.1007/978-3-319-44385-0_2
Published:
Publisher Name: Springer, Cham
Print ISBN: 978-3-319-44384-3
Online ISBN: 978-3-319-44385-0
eBook Packages: EducationEducation (R0)