
Abstract
Companies are keen on using novel technologies like Virtual Reality (VR) in order to achieve competitive advantages. However, the economic impact of the integration of such technologies in a company is difficult to quantify. Especially small and medium enterprises encounter difficulties when trying to quantify the benefits of instruments like VR. During the decision process, companies need extensive support and expensive consulting. In this paper a methodology for an efficiency analysis of industrial VR integration is presented. It includes both cost- and utility-based considerations. The user-friendly analysis allows the decision-maker to access a deeper understanding of VR and it results in a customised VR solution. The proposed economic assessment methodology is being validated by two companies in the mechanical engineering sector and it is proved to be a very useful tool to enable the decision for VR integration.
Access provided by Autonomous University of Puebla. Download conference paper PDF
Keywords
1 Introduction
The key for a company in context of globalisation is to prove their innovation ability in order to attain competitive advantages. However, required investments in new technologies are often associated with high costs. Especially if small and medium enterprises (SME) disinvest, it may have serious consequences.
Using Virtual Reality (VR) technologies companies can achieve next to front-loading other competitive advantages in their respective fields. The development of these technologies has been growing quickly in recent years, in the entertaining industry as well as in industrial applications. A forecast for 2018 based on data from 2014 predicts that sales of VR products (hardware and software) will increase from US$90 million (in 2014) to US$5,200 million [1]. This represents a growth of nearly 5800 % and indicates that quite some companies do see benefits (however hard to quantify) in the tools provided by the VR technology.
Nevertheless, the initial investments of industrial VR applications are a major barrier for SME. Industrial VR systems are complex product-service-systems consisting of hardware, software and services (henceforth referred to as VR configuration or VR solution). Their entire beneficial consequences are hard to quantify. Moreover the user acceptance of these technologies has increased significantly over the past twelve years. A study conducted in 2015 revealed that the companies have great concerns regarding the accompanied high investments and lack of access to information for VR integration [2]. For this reason, a systematic economic analysis is required, which allows companies without prior VR experience to evaluate the potential of VR systems in general and gives guidelines on which VR systems suits their individual requirements best.
The following chapter gives an overview of related works on classification of VR systems, investment appraisal models and approaches for economic and efficiency analyses. It is followed by a short description of the developed methodology for efficiency analysis of VR environments. For better understanding a detailed description of each methodology step is described on the basis of the validation. The paper is then concluded with a proposition for future work.
2 Related Work
The result of a servery in 2015 with 51 German SME without any prior VR experience [2] shows that SME face two main challenges, which complicate the VR integration: The high investment costs and the lower level of information about VR.
One main challenge is that companies without any VR experience need methods to evaluate VR systems in regard to technical parameters and company-specific benefits. One possible solution is the classification scheme for VR systems from Weidig et al. [3]. In this approach “Non-VR experts” can formulate requirements of those technologies on the basis of a scheme and evaluate them. It is based on linked tables, which is constructed in several stages. The model provides a good approach to classify VR interaction technologies due to the combined knowledge from different technical areas. This method is suitable for the classification of VR functions, but it could be extended by a concrete usage of VR technology.
Methods for evaluation of VR usability and benefits already exist, especially for special application areas. For example, Rizzo and Kim conducted a SWOT analysis of the field of Virtual Reality rehabilitation and therapy [4]. There is also a computerised diagnostic tool for usability evaluation of virtual environment systems [5]. In this application, a participant can evaluate an existing VR system based on 100 questions derived from 10 usability factors. However, specific economic analyses for VR in companies prior to the installation of the VR system are still missing.
The other main challenge for SME is the high investment combined with uncertain profit. Almost every investment appraisal is built on methods like net present value and payback method [6]. The most reused benefit methods are use-value analysis (like analytic hierarchy process [7]) and cost-benefit analysis [8]. There are specific analyses for different industries as well. The VR investments are comparable to general IT investments. Therefore OTT developed an economic analysis with risk levels (WARS), which analyses the cost-effectiveness of IT investments [9]. The model includes not only a statement about the costs and benefits, but evaluates the stability of potential results as well. It is based on the cost-benefit analysis of IBM. The risk levels reflect the probability, which costs and benefits can realise. The benefits and costs can be represented over the increasing risks levels in a diagram. Therefore the intersection of the two curves can be assessed at the corresponding level of risk with the payment [9]. A direct transfer of this method to industrial VR applications is not possible. However, an adaption for virtual reality technology was developed and is presented in this publication (see Sect. 3).
There are only a few methods, which combine solutions for the two challenges described above. A general approach is to use experience-based knowledge of companies with VR systems. This exchange of experience is the most important requirement for information acquisition [2]. The experience-based knowledge was surveyed in 2015 with participants, who had already been working with VR systems in their company. In this way 17 companies provided an insight into the everyday business with VR environments. The aim was to highlight actual important VR applications for different businesses and to reveal the development of usage by a comparison of a study by Klocke et al. conducted in 2003 [10] and a study by Dücker taken in 2015 [2]. It turned out that the companies used the technology very intensively [2], compared with 2003 [10]. However, the companies continue to use intense basic functions of VR technologies such as design reviews or early error detection, but also use advanced applications like simulations. These results improved the basis for discussion and enabled as well as accelerated the decision making process. However, only qualitative statements about the economy could be obtained in this study. Statements about precise economic improvements were only made by a few companies, because companies have either no capacity to gather this data or they protect their internal company secret.
A methodology for economic analysis of VR technologies was developed by Kunst [11] in 2005, where he focused on virtual factories. KUNST recognised the problem that classic investment calculations are difficult to apply in this context. In particular, the potentials of VR applications in his work are well-structured. He divides the analysis in different parts, but he did not discuss the relationship between the results. It is difficult to assess the relevance of this model in practice, because the key components for a practical implementation and interpretation were not described in detail.
SME have less time to get involved in the technology specification and usage in their particular company, so they are often compelled to engage an expensive consultant to guide them through the integration process. There exist many solutions only for partial aspects and there is no holistic method to easily, fast and cost effective analyse their VR potential prior to VR integration.
3 Efficiency Analysis of VR Environments for Industrial Applications
The amount of the initial investment for VR integration in a company usually can be estimated very accurately. However the companies assume high and difficult to predict consequential costs. The developed Efficiency Analysis of VR Environments so called WAVE methodology (German acronym: Wirtschaftlichkeitsanalyse für Virtual Engineering) should create transparency for companies on their way to the technology adaptation. When companies think about the integration of VR at the first time, they usually face the following questions:
-
Can my company take more opportunities in the relevant market through the usage of VR technologies?
-
How can VR be used in practise? Which use cases are relevant for my company?
-
Which parameters should be considered by choosing a suitable VR technology?
-
What investments, benefits and monetary success can my company expect by analysing different VR systems?
The WAVE model allows a step by step approximation of this complex issue without the need of initial knowledge about VR technologies. It also involves a lot of interdisciplinary divisions in order to obtain comprehensive statements about a future VR usage. In addition to the insights on possible improvements in the company, a concrete VR solution is also identified by a risk-based efficiency analysis optimised for the specific company.
3.1 General Approach of the WAVE Methodology
This chapter describes the general approach of the Efficiency Analysis of VR environments, so called WAVE methodology (see Fig. 1). The evaluation of the VR technology potential is divided in 8 steps followed by the integration of the optimal VR system.

General approach of WAVE methodology
Step 1: Needs Identification.
The aim of the first step is to develop a general understanding of the current situation of the company. Therefore, an internal interdisciplinary team analyses the actual situation. The identification of the general needs is based on a SWOT analysis [12]. The further analysis is continued only if the identified needs can be satisfied using VR technologies (see Sect. 4).
Step 2: Requirement Analysis.
For the requirements analysis an extensive questionnaire ware developed. Employees from all relevant departments should participate in the survey, so that the result is as representative as possible. The questionnaire is intended for participants with a little background knowledge regarding VR. Thus questionnaire is designed for the participants to develop a deeper understanding of VR technologies during reading and answering the survey.
It begins with the questions about basic and general trends of the particular company. These include the extent of the hardware and the desired level of support by using the novel technology (11 questions).
The second part of the questionnaire deals with the applications and their benefits (90 questions). This part is based on an extensive literature review and is heavily influenced by the work of Kunst [11]. A nearly complete list of all applications sorted by the product life cycle phases utilise this previous findings. The applications comprise from the design phase through product development to sales and recycling. It highlights issues such as the early internal collaboration, the visualisation of assembly processes, the use of VR at fairs and the testing of services in respective environments. Besides the identification of relevant applications, participants can examine the relevance of benefits as well.
In the third part the participant evaluates the function and features of VR software with the principle of the classification scheme for VR systems from Weidig et al. [3] (41 questions). Finally, additional comments can be specified (3 questions).
The evaluation of the requirement analysis uses profiling (Average, Maximum and Minimum profile). The approach of profiling is different for the different types of scale (see Table 1). How to apply the profiling is described in Sect. 4 (see Table 3).
Step 3: Derivation of VR Systems.
The third step involves the evaluation of the requirements analysis. For this step one or more VR experts (e.g. provider, consulting or research institution with focus on VR technologies) analyse the response profile (average, maximum, minimum) and create different scenarios. The methodology is scalable in its design, because the number of different evaluation scenarios is unrestricted. In this way a company can evaluate only one VR system or compare various VR systems.
Step 4: Costs Evaluation.
The determination of costs includes both one-time and ongoing costs. For example, maintenance and external support are a part of running costs. They were estimated by the VR system provider with 5 % of the one-time hardware cost and 15–20 % of software costs both for updates and training. However, the estimates are increased hardware costs due to unplanned outages by involving risk levels which are illustrated in Table 2. Further cost aspects were derived on the basis of the response profile. For example, a profile that focused the company as a pure user of VR (not developer) included lower costs for training and instruction. However, in this case cost factors such as the data preparation should be applied higher assessment. Attention should be paid to the one-time hardware cost. The VR system providers calculated not only the costs for hardware, but planning and implementation costs.
On this basis, further analysis will be carried out under optimistic and pessimistic aspects. The pessimistic case assumes that for instance a projector lamps used-up before the end of operating life. These additional potential costs are dependent on the levels of risk. This concept of risk levels distinguishes form OTT’s method [9]. So the costs data are transferred to another array. For each VR configuration the costs are divided into largely known, estimable and hard tangible costs with respect to realisation opportunities (high, medium, low). Table 2 illustrates the segmentation. This procedure corresponds to Ott [9] method, except the allocation and structuring of costs were adjusted to VR technology. For the subsequent analysis the risk levels (1–9) are added to each other. Risk level 1 considers all possible costs. With increase of risk levels (optimistic view) only the largely known and estimable costs with high realisation chance are involved.
Step 5: Utility Evaluation.
The benefits of using Virtual Reality (VR) can be assessed both in monetary and qualitative terms. For this reason, the benefit is calculated in two different ways, with monetary and qualitative focus. For monetary consideration a standardised procedure is not recommended, because the design and the amount vary for each business context. On the one hand there are different benefits depending on the industry sector, e.g. using of product prototypes. On the other hand, the collection of data through the company’s internal documentation and various data quality can be difficult. The problems are often the mere lack of availability of information, such as for costs, projects, events and resources. Basically, the company-specific dimensions can be calculated with the direct, indirect and strategic benefit categories. This calculation is structured like the cost evaluation. Only the sum of the risks levels are exactly the other way round. In the pessimistic case (risk level 1) only largely known benefits consider with most realisable opportunities.
The second way to evaluate utility is a non-monetary benefit analysis. This based on the requirement analysis from step 2. The benefit factors are assessed for each VR system of one or more experts on a scale from 0 to 100 using the questionnaire already used in step 2. The evaluation of each VR system forms the basis of the analysis and determination of the utility values in step 6. A purely utility-based analyse is reasonable, because it is difficult to estimable monetary aspects.
Step 6: Efficiency Analysis.
All necessary data are collected in the previous steps. The efficiency analysis is now divided in three analytical parts:
-
1.
Pure cost-based consideration: involves a comparison of net present value (NPV) of the various VR systems (see Fig. 2 and Table 5).
Fig. 2. 
Cost trends of VR alternatives
-
2.
Pure utility-based consideration: includes benefit analyses based on requirements analysis and involves a comparison of a developed capital-benefit value of the various VR systems (see Figs. 3 and 4).
Fig. 3. 
Spider chart of the 6 most important properties (0- inadequate; 100- perfect)
Fig. 4. 
Visualisation of capital-benefit value of the VR configuration
-
3.
Mixed benefit- and cost-based consideration with inclusion of risk levels: inspired by the WARS model [9] and includes more analysis like amortization of the various VR systems (see Figs. 5, 6, 7, 8, 9 and Table 6).
Fig. 5. 
Benefit and cost consideration of Mobile based on WARS model
Fig. 6. 
Benefit and cost consideration of Low Cost based on WARS model
Fig. 7. 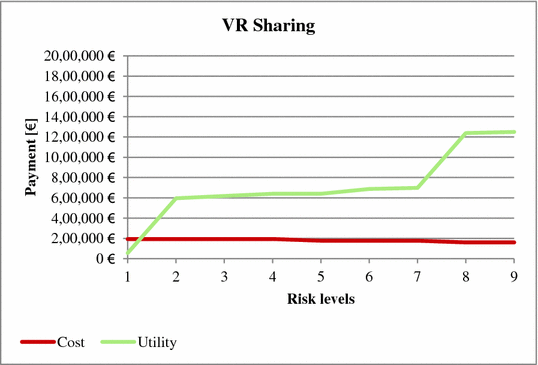
Benefit and cost consideration of VR Sharing based on WARS model
Fig. 8. 
Benefit and cost consideration of 3D based on WARS model
Fig. 9. 
Comparison of payback periods of VR alternatives


A deeper understanding of the efficiency analysis could be gained in Sect. 4.6 where it is applied and described in details.
Step 7: Selection of VR System.
A preliminary decision is made in this step. The resulted rankings of last step are compared. The selection is easy if all rankings of the analysis parts follow the same pattern. If different rankings exist, there are various options. In the second analysis part, the alternatives were sorted by an index called capital-benefit value. This index results from division of utility value by NPV. Because of low costs, the called capital-benefit values can be very high despite small utility values. However, alternatives with utility values below 50 do not fulfil the requirements. This guideline will help in final decision. Furthermore alternatives with lower costs and benefits are to be preferred if the company is risk-averse.
Step 8: Stability Analysis.
The stability analysis is used to check the robustness of the results. The stability of the model is essential, because the required data is collected under high uncertainty. Many of the cost factors and especially the benefit factors are based on estimations. Therefore, relevant parameters of the model are varied in order to check whether they affect the decision. The following list is a selection of parameters that can be used:
-
Stability of the present values:
-
variation of interest rate
-
variation of the duration of use of a VR configuration
-
-
Stability of the cost-benefit analysis:
-
variation of weighting of the utility analyses
-
change of expert reviews in the most important features
-
-
Stability of the WARS model: variation in risk assessment
-
costs are probably and benefits improbably
-
-
Stability of the payback period:
-
Pessimistic: costs exist earlier and benefits generate later
-
Optimistic: cost generate later and benefits exist earlier
-
If the selection of the VR configuration does not change after the stability test, this configuration is the optimal solution. If the stability analysis results in a changing configuration by only a small variation of parameters, the reason of the volatile result should be identified. In the simplest case the selection always changes between two models. This suggests that both VR systems are suitable for the given requirements. In this case the decision should be taken in regard to qualitative aspects. A review of each step is necessary if the variation causes a random change between the different alternatives. One possible explanation for that phenomenon is that for the company the use of VR is not economical. There is also the possibility that the company has placed demands on a VR system that cannot be realised by any particular configuration. In this case a combination of several solutions is possible.
Virtual Reality Integration.
After the selection of the optimal VR system the integration starts. Therefore, indicators, which are specific to the company, should be designed to check the efficiency. Thus, an easier analysis is possible in case the VR system does not become reliable and profitable. Therefore, problems and obstacles can be solved at early stage of development. After all, the experts agree: The correct use of a VR system brings great benefits, which are often difficult to quantify.
4 Validation of the WAVE Methodology
The following section describes explicitly the approach on the basis of a validation. The general validation is based on one company (see company A in Table 3) from mechanical engineering sector. Only in one part of the validation (step 2: requirement analysis) another company from the same trade is involved in order to demonstrate variety of results.
Step 1: Needs Identification.
The findings of the validated company derived from a group discussion with employees from the departments of sales, market analysis, IT and technical production. The following areas were identified as needs:
-
Image improvement and sales support
-
Knowledge collection
-
Knowledge transfer
-
New services
In those areas VR can be used to improve the actual situation of the company. So the analysis can continue.
Step 2: Requirement Analysis.
In carrying out the WAVE model at different companies, it came to different requirements and therefore also to different profiles. As an example Table 3 demonstrates a comparison between two companies of a same sector. The numbers in brackets describe the average of participant’s evaluation on a scale where 10 represents perfect matching and 1 represents the opposite.
It can be seen that the requirements are set differently to the VR systems. In particular, the applications and benefits differ.
Step 3: Deduction of VR Systems.
Five possible VR systems were configured in the validation (for company A). These are based on offers from VR system providers, according to the results of the requirement analysis:
-
1.
High End: A customised three-sided CAVE with wide-ranging software based on the Maximum profile.
-
2.
Mobile: a mobile system consisting of a 3D projector, tracking system, screen and software with basic functions on the basis of the Average profile.
-
3.
Low Cost: an inexpensive self-assembled system consisting of 84-inch 3D TV, tracking system and open source software on the basis of Minimum profile.
-
4.
VR Sharing: No purchase of hardware. In this particular case the company rents VR technologies next to company’s location and for trade shows.
-
5.
3D: Just a 3D system consists of a 3D projector without tracking (for verification of the added value of VR).
Step 4: Costs Evaluation.
The cost evaluation involves both company-internal and external cost. The external consideration includes hardware, software and service costs. Experts estimated the costs for each VR configuration on basis of offers (High End, Mobile, Low Cost, VR Sharing, 3D). It is important to differ between one-time and running cost.
The company-internal cost includes especially manpower for system integration and reorganisation actions. Moreover the company had to calculate the running costs for example room and energy cost.
Step 5: Utility Evaluation.
Following use cases with important benefit aspects are included from the company (see Table 4). They are derived from the requirement analysis. The company sells large, complex machines and presents them on fairs. If a VR system is used, direct cost savings by fairs are, for example, lower transport costs, lower costs for personnel (staff, travel, accommodation costs, fees, etc.) and smaller stand space at the fair. In addition, it also increases the chance of new orders (indirect benefits), because of the unique selling point.
In addition, other strategic benefits arise. The innovative technique can go along with an improved image and increased awareness. If a company use VR for customer presentations, it can also improve the image. In both cases the image improvement is estimated by increased sales.
The bracketed fields could not be considered on the basis of the collected data. The monetary evaluation was based on internal information. Then the risk levels are considered in the same way as in the cost evaluation.
Step 6: Efficiency Analysis.
After collection of all relevant data the efficiency analysis, which is divided in three parts, can be applied.
-
1.
Pure cost-based consideration
The first step is to create a visualisation to get a first impression of the cost of the VR systems. Hence, the costs of each configuration are displayed over time (see Fig. 3).
Furthermore the present value should be determined (see Table 5). This corresponds to the calculation of the net present value (NPV) except that deposits are not observed. Configurations with small negative NPV are more advantageous. In this example the 3D, VR Sharing and Low Cost perform well.
-
2.
Pure utility-based consideration
The utility-based consideration includes three (classical) benefit analyses, which are combined by weighting. The appraisal criteria (of any cost-benefit analysis) bases on the requirement analysis. The weighting of the evaluation criteria set by the participants (company) in the questionnaire. A high weighting of appraisal criteria concerns in a greater assessment of this aspect in step 2. The assessment of experts was carried out in the previous step on a scale from 0 to 100. A spider chart is created for the most important five to ten properties. This underlines the advantages and disadvantages of the different alternatives. In Fig. 4, the results are shown.
Now a ranking of the resulting utility values of each VR configuration, which range between 0 and 100, can be established. This analysis part enables first interpretations to the suitability of a VR model. We developed an index to concretise the results, which relate utility values to NPV of the cost-based consideration. This capital-benefit value (German acronym: Kapital-Nutzen-Wert) is illustrated in Fig. 5. Therefor the capital-benefit value is resulting from division of utility value by NPV. High negative capital-benefit values are interpreted positively.
High End was excluded based on these results, because the Mobile solution has a similar utility and in the same time is much cheaper.
-
3.
Mixed benefit- and cost-based consideration
The benefit- and cost-based consideration bases on WARS model [9]. This analysis is realised by the calculation of costs and utility from step 4 and 5.
The monetary benefits are based on one year. We have to calculate the present values to compare them with the costs. The result of this step is a slightly different benefit matrix. The risk levels of benefits matrix can be assigned to the standard division of OTT (see Table 2).
The benefit and cost curve for each VR system is plotted on a graph (see Figs. 6, 7, 8 and 9). Intersections between the two curves are possible, because the utility-function increase and the cost-function decrease with increasing of risks levels. This intersection is used for interpretation. In addition, the intersections of each VR configuration can be displayed in one diagram to make statements about the ranking of suitability. The intersections are listed in Table 6.
The VR Sharing achieved the best results. The curves intersect at a low risk level and a moderate amount of costs and benefits. The Mobile alternative is profitable from a low level of risk, but costs are higher. In this case a decision for one of the two alternatives depends on the corporate strategy. In the case of Mobile alternative the company has invested more than VR Sharing, but higher monetary benefits are realisable.
Moreover an amortization calculation is realised. The data of annual costs and benefits have already been completed. They are depending both on the risk level. For each risk level the payoff time is calculated. It is important that the values of final stages of the WARS model are not used, because they are present values and don’t concern on years. For the interpretations of each payoff time all risk levels are relevant (for each VR configuration). Optionally, this can be represented in a graph (see Fig. 10). So it is easier to compare the curves of VR alternatives on the risk levels (x-axis) and amortization year (y-axis).
The VR Sharing alternative amortizes from the second risk level in the first year. The system is fastest profitable in comparison to the other alternatives with the highest probability.
In summary VR Sharing compare favourably with the other alternatives. Mobile achieved second best results. 3D and Low Cost achieved only moderate to poor results.
Step 7 & 8: Selection of VR System and Stability Analysis.
High End was excluded for the particular company due to the poor results in the utility-based consideration. The prime selection is VR Sharing followed by Mobile, Low Cost and 3D.
At last, the stability analysis supports the previously made selection and the organisation can begin the process of integration. In the validation, some examples for stability parameters are variation of estimated useful life of each VR alternatives, interest rate of present value, weightings and expert assessments of benefit analysis. The selection was stable over all variations.
5 Conclusion and Further Work
This paper shows that the economic analysis of VR investments includes complex aspects. Already existing approaches support VR investment decisions, but they are not yet qualified to be applicable for SME. The qualitative economic statements from VR users are not sufficient valid.
In this paper a methodology for an efficiency analysis of industrial VR integration was presented. The user-oriented analysis allows companies to access a deeper understanding of VR, while working on the analysis. The result is a customised VR system, which was compared with other VR systems derived from the internal company requirements. So the proposed economic methodology is scalable. Moreover SMEs can easily apply the cost-effective method. It was validated with two companies from machinery and plant engineering industry. The validation underlines that this approach is very useful for decision making of VR integration.
In the future, more validations with other sectors will follow to improve the methodology. There are also planned implementations in form of computer-based tool. So a smooth process is granted.
References
Nunatak (n.d.). Forecast revenue for virtual reality products worldwide from 2014 to 2018 (in million U.S. dollars). In Statista - The Statistics Portal (2016). http://www.statista.com/statistics/426276/virtual-realiy-revenue-forecast-worldwide/
Dücker, J.: Analyse der Wirtschaftlichkeit der Virtual Reality Technologie im Kontext von Industrie 4.0. Master thesis, Karlsruhe Institute of Technology (2015)
Weidig, C., Mestre, D.R., Israel, J.H., Noel, F., Perrot, V., Aurich J.C.: Classification of VR interaction techniques, based on user intention. Eurographics Digital Library (2014)
Rizzo, A.A., Kim, G.J.: A SWOT analysis of the field of virtual reality rehabilitation and therapy. Presence 14(2), 119–146 (2005)
Kalawsky, R.S.: VRUSE—a computerised diagnostic tool: for usability evaluation of virtual/synthetic environment systems. Appl. Ergon. 30(1), 11–25 (1999)
Favaro, J.: A comparison of approaches to reuse investment analysis. In: ICSR, p. 136. IEEE (1996)
Saaty, T.L.: How to make a decision: the analytic hierarchy process. Eur. J. Oper. Res. 48(1), 9–26 (1990)
Mishan, E.J., Quah, E.: Cost-Benefit Analysis. Routledge, London (2007)
Ott, H.J.: Wirtschaftlichkeitsanalyse von EDV-Investitionen mit dem WARS-Modell am Beispiel der Einführung van CASE. Wirtschaftsinformatik 35(6), 522531 (1993)
Klocke, F., Straube, A.M., Pypec, C.: Vorsprung durch Virtual Reality. Management Summary. IPT, Aachen (2003)
Kunst, S.: Konzeption eines Modells zur Bewertung der Wirtschaftlichkeit von Virtual-Reality-Systemen in der Digitalen Fabrik. Diploma thesis, Hochschule Wismar (2005)
Hill, T., Westbrook, R.: SWOT analysis: it’s time for a product recall. Long Range Plan. 30(1), 46–52 (1997)
Author information
Authors and Affiliations
Corresponding author
Editor information
Editors and Affiliations
Rights and permissions
Copyright information
© 2016 Springer International Publishing Switzerland
About this paper
Cite this paper
Dücker, J., Häfner, P., Ovtcharova, J. (2016). Methodology for Efficiency Analysis of VR Environments for Industrial Applications. In: De Paolis, L., Mongelli, A. (eds) Augmented Reality, Virtual Reality, and Computer Graphics. AVR 2016. Lecture Notes in Computer Science(), vol 9768. Springer, Cham. https://doi.org/10.1007/978-3-319-40621-3_5
Download citation
DOI: https://doi.org/10.1007/978-3-319-40621-3_5
Published:
Publisher Name: Springer, Cham
Print ISBN: 978-3-319-40620-6
Online ISBN: 978-3-319-40621-3
eBook Packages: Computer ScienceComputer Science (R0)