
Abstract
The crater-lake Pavin, located in Auvergne and dated 6740 years BP, is the youngest volcano and one of the two acidic maars in metropolitan France. Field missions to the Pavin area were conducted for the past 5 years, leading to a better understanding of the Pavin tephrostratigraphy and geological history. Based on field textures, componentry and SEM morphoscopy of juvenile ash particles, a new complete tephrostratigraphy of the Pavin volcanic deposit is defined with a new reference section named Clidères. The 26 tephra beds and bed sets correspond to 4 volcanic units. The deposits are composed of high energy basal surges, lapilli fall and mixed dynamisms. The vertical variations of the maar deposits provide a way to access the fluctuating eruptive conditions related to changing magma-water interactions of the 4 main phases. The changes are associated to simultaneous variations of three factors: the pulsating mass eruption rates, the depth of fragmentation and the aquifer yield.
Based on the combination of two geophysical methods, ground penetrating radar and electrical resistivity surveys, the boundaries of the volcanoclastic deposits are visualized and the average thickness of the formation is followed from proximal to intermediate locations. Including the combination of field observations of near 50 trenches of 1–2 m depth, a core drilling and geophysical profiles, the total volume of deposits is now estimated at 5.2 × 10⁷ m3 which is 31 % less than previously estimated.
Access provided by Autonomous University of Puebla. Download chapter PDF
Keywords
1 Introduction
Depending on the chemical and physical nature of the erupting magma and the environment around the vent (dry or wet), the mode of eruption varies widely. In general, formation of pyroclasts derived from the fragmentation of magma which results in the exsolution of volatile phases during decompression when it rises toward the Earth’s surface. The fragmentation depends essentially on compositional and physical characteristics of magma, such as viscosity and volatile content. In this case, explosive eruptions are called magmatic eruptions, and lead to formation of vesicular pyroclasts. In contrast, phreatomagmatic explosive volcanism results from the interaction of magma with external water, that is groundwater or surface water, close to or at the Earth’s surface. The gas phase is mainly steam derived from ground or surface water (Lorenz 1973, 1987; Wohletz and Sheridan 1983). Different interaction sites and variations of the magma/water mass ratio may result in a spectrum of eruption efficiency, eruptive styles and emplacement mechanisms (Wolhetz 1986; Houghton et al. 2000; White and Houghton 2000; Carrasco-Nunez et al. 2007).
Maars are one of the landforms caused by phreatomagmatic explosive volcanism. Maars consist of a crater, which reaches or extends below general ground level and is considerably wider than deep, and in a surrounding rim constructed of material ejected from the crater (Ollier 1967, p.66). The resulting predominant base surge and subordinate ballistic and pyroclastic fall deposits of phreatomagmatic eruptions consist of both juvenile and comminuted country-rock material (Lorenz 1973). Generally, such eruptions are characterized by a basaltic magma. Explosive interaction between magma and external water may occur during vesiculation (thus juvenile clasts may have a low degree of vesiculation) or prior to it (thus juvenile clasts are dense) (Lorenz 1986).
Two conceptual models have been proposed to explain the formation and evolution of magma-water explosions: the Lorenz’s model (Lorenz 1986) and the Valentine and White’s model (Valentine and White 2012). In the Lorenz model, the magma interacts explosively with groundwater via molten fuel-coolant interaction (MFCI; Büttner and Zimanowski 1998). Such thermohydraulic explosions start only at shallow initial depth below preeruptive ground because a hydrostatic pressure barrier limits the occurrence of MCFI at low pressure (2–3 MPa). Repeated explosions induce the ejection of hydroclasts and in part the evaporation of groundwater. This mechanism induces the water table drawdown and the associated downward migration of explosion chambers. Deep-seated country rock lithic clasts are derived from direct ejection of the deepest explosions. This explains the presence of progressively deeper-seated country rock lithics in the upper parts of the tephra ring stratigraphy. The repeated ejection of the fragmented country rocks causes the instability of the walls and roof of the root zone. Moreover, the overlying rocks collapse into the partially evacuated root zone, forming a cone of subsidence: the diatreme. At the surface, the maar crater is the result of the subsidence (Lorenz 1986, 2007). In the Valentine and White’s model, the deepening cone of depression in the water table is not a necessary condition because explosions can happen at any depth where hydrostatic pressure is less than critical pressure. This second model suggests the water table remains relatively constant because permeability limitations prevent the rapid draining in the diatreme and because the diatreme material is water-saturated. Analog experiments show that shallow explosions are more likely to erupt and are more effective at depth < 100 m. Also, clasts from shallow country rock should be more frequent in the tephra deposits. The deep-seated country rocks can be present in the tephra ring if repeated deep explosions have mixed subcrater deposits (upward mixing) and later shallow explosions have ejected these lithics (Valentine and White 2012).
The Pavin maar offers the opportunity to study one of the rare and best examples of acidic maar. After the geological setting presentation, we describe new field data with two reference cross-sections to establish the stratigraphy of the deposit. Then, in order to perform subsurface imaging between outcrops and realize three-dimension visualization, we establish long geophysical profiles thanks to two methods: Electrical Resistivity Tomography (ERT) and Ground Penetrating Radar (GPR) . The results are used to estimate the eruption volume and to understand the evolution of the eruption with the two conceptual models.
2 Geological Setting
The Pavin system is the youngest volcanic group in metropolitan France. It was formed around 6740 years BP (Juvigné and Miallier 2016) with the eruption of four volcanoes (Fig. 6.1): two strombolian cones (Montchal and Montcineyre), a basaltic maar (Estivadoux) and the Pavin lake, a trachy-andesitic maar that is one of the rare examples of acidic maar within French Holocene volcanoes (Camus et al. 1973).

Simplified geological map of the Pavin volcanic system (Goër de Herve 1997)
The nature of Pavin remained unclear until the publications of Henry Lecoq (1835) and Philippe Glangeaud (1916), who established the relations between the volcanoes and the bedrock (see Boivin and Jouhannel 2016; Fig. 6.2). According to Thonat et al. (2015), the bedrock of the Holocene volcanism period consist of three main geological units, from the base to the top:

Geological cross-section showing relations between the basement, the Montchal volcanic formations and the Pavin maar (with an actualized traduction, after Glangeaud 1916)
-
the crystalline basement, formed mostly of cordierite-rich migmatite, muscovite-biotite leucogranite and biotite-sillimanite-garnet gneiss,
-
the Cézalier Pliocene volcanic formations (e.g. Cocudoux, Jansenet),
-
the Guéry and Sancy plio-pleistocène volcanic formations (e.g. Pertuysat, Fig. 6.1).
In the area of puy de Pertuysat, the Holocene stratigraphic column is as follows (from oldest to youngest; Bourdier 1980):
-
glacial moraine,
-
white clay-altered trachytic tephra bed of debated origin,
-
Montcineyre black lapilli,
-
Estivadoux basaltic bedded tuffs,
-
Montchal red lapilli,
-
Pavin deposit,
-
Topsoil
The Pavin crater is roughly subcircular with a rim diameter between 900 m and 1000 m and with a mean slope of 45° toward the center which is filled by a lake located 60 m below the summit of the rim. This lake has a diameter of 750 m and a maximum depth of 92 m. The lake represents the surface expression of the regional groundwater table in the volcanic terrains. The Pavin crater cut the variscan granitic-gneissic rocks of the basement, the Sancy basic tranchyandesitic to trachytic lava flows, a Sancy trachytic pumiceous pyroclastic flow (named “Rioubes-Haut”, Ménard 1979) and the base of the Montchal scoria cone with its trachybasaltic lava flow (Glangeaud 1916; Bourdier 1980). The Pavin maar (“Lac Pavin”) is surrounded by gently outward-sloping tephra ring with beds of mostly unconsolidated deposits, except on the southwest where the crater is dominated by the older Montchal scoria cone (formerly “Puy de Montchalm”) (Glangeaud 1916; Bourdier 1980).
The formation of the crater is due to an eruption with complex dynamism which has both plinian and phreatomagmatic characteristics. Ejecta have been dispersed by aerian clouds giving air fall deposits and by basal blasts producing base surge deposits (Bourdier and Vincent 1980). The deposits have a phreatomagmatic origin with polylithological composition characterized by association of basement clasts (granitic-gneissic rocks, basaltic to trachy-andesitic lavas, scoria…) and two types of K-benmoreitic juvenile clasts: commonly pumice lapilli and less frequently poorly-vesiculated dense glassy lapilli (Camus et al. 1973). When its thickness is greater than 50 cm, the deposit has a regular stratification near-parallel to the surface of the substratum, suggesting fall beds. However, some layers have low-angle cross stratifications which characterize surge deposits. When the deposit is thinner than 50 cm, it is generally an unstratified homogeneous ashy matrix with some centimetric to millimetric pumice fragments, interpreted as pyroclastic flow or surge deposits (Bourdier 1980; Boivin et al. 1982).
500 m from the crater, a drilling called “Drilling Pavin 1979” intersected 10.9 m of Pavin trachy-andesitic pumice deposit (PD) based on 1.1 m of Montchal strombolian pyroclastic fall and 18 m of Montchal lava flow. Within the drilling the deposits are characterized by the absence of lithic with great size (>5 cm). Furthermore, the main features are a large variation in the proportion of xenoliths (20–75 %) depending on the level, the initial products being particularly lithic-poor. An abrupt compositional change is localized near 4.9 m from the bottom, with an increase of lithics in the ejecta from 20 to 60 % (mostly from the basement). Simultaneously, the proportion of pumice lapilli decreases. Moreover dense glassy lapilli seem more frequent at the end of eruption (Bourdier 1980).
PD covers an elliptic area of 17 km × 6 km with a NNW-SSE major axis (Bourdier and Vincent 1980; Boivin et al. 1982) The total area was estimated to be 95 km2. Its extension is limited by Super-Besse to the north, Chirouzes to the east, Lake Chambedaze to the west and exceeds the Godivelle to the south (Fig. 6.3). The deposit asymmetric area appears to extend far to the south and southeast (up to 14 km from Pavin) and slightly to the north (only 3 km). The deposit close to the crater is 15 m thick and the total eruption volume was estimated to be 75 × 106 m3 (Bourdier 1980; Bourdier and Vincent 1980; Boivin et al. 1982).

Isopach map of the trachy-andesitic pumiceous flow from the Pavin (thickness in meters) (Bourdier 1980)
3 General Methodology
In this volcanic province, natural outcrops are very rare due to the relatively recent age and nature of the eruptions. The volcanic ash deposits soften the reliefs, creating smooth shaped hills that are typical of Auvergne countryside. The lack of uncovered volcanic deposits, due mostly to vegetation or man-made constructions, is a serious brake on the studies of these deposits. For studying and mapping the PD boundaries, two methods are used:
-
Near 50 trenches of 1–2 m depth in the intermediate to distal area,
-
Combination of core drilling (up to 50 m) and geophysical sections in the proximal to intermediate area of the deposit (Fig. 6.4).
Fig. 6.4 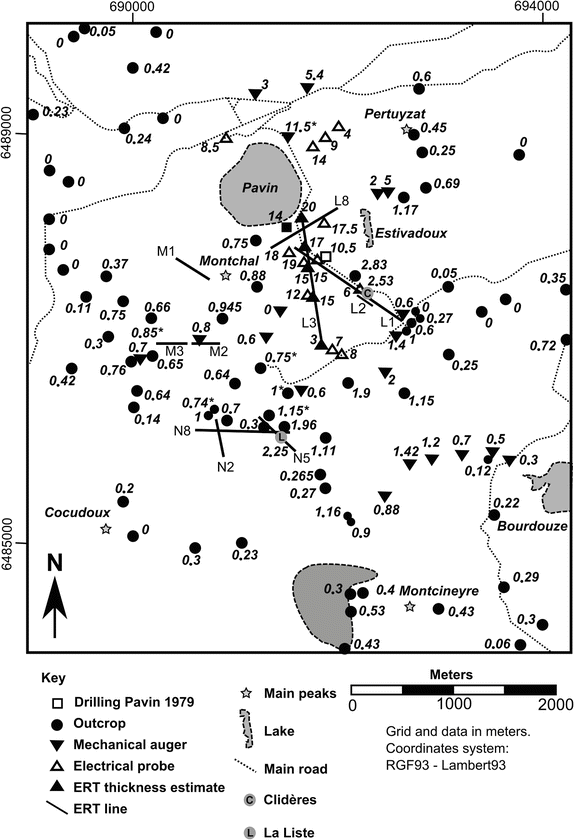
Synthetic map of the geological and geophysical data on the Pavin proximal and intermediate volcanic deposits

Among the common geophysical methods, two are particularly interesting for the study of pyroclastic deposits: the Electrical Resistivity Tomography (ERT) and the Ground Penetrating Radar (GPR).
For instance Russel and Stasiuk (1997) showed that GPR can be extremely effective in defining the bases of volcanic deposits and has tremendous potential for quantifying distributions, thicknesses, and volumes of volcanic deposits. Cagnoli and Ulrych (2001a, b) point out that an amplitude decrease in the GPR signal probably reflects lateral facies variation of base surge deposits (decrease in grain size). Gómez-Ortiz et al. (2007), in a joint application of GPR and ERT in Tenerife, showed that ERT usually provides a good definition of the boundaries between the volcanic units and allows to locate structures such as lava tubes and faults, whereas GPR is most effective to characterize the internal structure of the volcanic deposits.
In the present study, the ERT is mostly used to estimate the width of the different units (greater penetration depth) and the GPR allows to image sedimentary features (better resolution). Note that a compromise has been made between the profile localization, length, the type of antennae (500 MHz shielded, 100 MHz unshielded) and the duration of the measurements.
3.1 Field Observation and Description
First, a new reference section named “Clidères” is described in order to define a detailed lithostratigraphic column for the PD, which has never been done in previous works. A second reference section, named “La Liste” is compared and correlated. These two reference sections were chosen for the good quality of the outcrops, their very interesting geographical locations and the possibility of studying the deposit in different orientations with a 7–10 m extended side. Clidères and La Liste outcrops are located respectively 1.5 km south-east and 2.4 km south from the vent (Fig. 6.4) in the intermediate area of PD. They are located at the appropriate distance from the vent to observe the bulk of sedimentary structures, that is to say neither too proximal (thus the deposit is unstratified and too thick to reach the basement) or too distal (where energy is too low to observe any sedimentary structure). By describing structural, petrological and geometrical features of each tephra bed, the two sections units can be correlated and the main evolution of eruptive dynamics defined. We estimate the roundness and sphericity of grains using the visual chart of Krumbein and Sloss (1956). These outcrops, associated with the 1979 Pavin drilling, are used to calibrate the geophysical data: Electrical Resistivity Tomography (ERT) and Ground Penetrating Radar (GPR).
3.2 Electrical Resistivity Tomography
The ERT is an electrical method based on the measurement of the apparent resistivity ρa (Ω.m) in the ground after the injection of a direct current IAB using two electrodes (A for the injection and B for the reception). The voltage difference ΔVMN is measured with two others electrodes (M and N) along a line. The apparent resistivity is then calculated with the following equation: \( {\rho}_{\mathrm{a}}=\mathrm{k}\frac{\varDelta {\mathrm{V}}_{\mathrm{MN}}}{{\mathrm{I}}_{\mathrm{AB}}} \)
where \( \mathrm{k}=2\pi {\left[\frac{1}{\mathrm{AM}}-\frac{1}{\mathrm{MB}}-\frac{1}{\mathrm{AN}}+\frac{1}{\mathrm{NB}}\right]}^{-1} \) is the geometric factor.
Electrical Resistivity Tomography (ERT) measurements were undertaken with a multi-electrode 2D device (ABEM TERRAMETER SAS 4000), using 64 electrodes with spacing depending on the desired resolution and depth. We used a spacing of 0.5 m above the outcrops (high resolution but low depth) and a spacing of 5 m for the prospective lines. We usually used a gradient array to obtain both high resolution and satisfactory depth (1252 points of measure, 45 m depth) and occasionally pole-dipole array in order to increase the investigation depth (588 points, 70 m depth). Each prospective line was acquired using several 315 m ERT sections, according to a roll-along procedure, with a half-covering. Prior to the acquisition, a check-up of the electrodes has been realized consisting in an injection of 20 mA (ABEM Instrument 2006).
The injection current intensity was adjusted automatically according to the signal-to-noise ratio between 10 mA and 200 mA. Reciprocal measurements (Electrode A is changed in electrode B and vice versa) were taken to check for reproducibility of data. For average reciprocal errors above 1 %, four reciprocal data were measured. The topographic variations were also measured using a level and a rod ruler, and the lines were positioned using a GARMIN GPS with a 3 m precision and remarkable places (e.g. cross-roads, altimetric marks, topographic peaks, canyon’s entry or working face).
The data, once recorded, were transferred to and presented in the form of pseudo-sections, which show the apparent resistivity according to levels. These sections were then processed on a computer. Inversion of the apparent resistivity data is indeed required to obtain a model of the subsurface resistivity in 2D vertical section. The sections were inverted with the standard Gauss-Newton code Res2dinv described by Loke and Barker (1996) and Loke (2003), taking into account topographic variations. A standard constraint was chosen as the dataset wasn’t particularly noisy.
The code divides the 2D model into a number of rectangular blocks. The purpose of the data inversion is to determine the resistivity of the rectangular blocks that will produce an apparent resistivity pseudo-section that agrees with the actual measurements. The optimization tries to reduce the difference between the calculated and measured apparent resistivity values by adjusting the resistivity of the model blocks. The root-mean-squared (RMS) error allows measuring this difference. To obtain a resistivity model in agreement with the geology, the most prudent approach is to choose the model at the iteration after which the RMS error does not change significantly (generally between the 3rd and 5th iterations). If the RMS error is high (typically more than 10 %), some points corresponding to a high error values can be deleted, and the inversion has to be computed with this new data set (Loke and Barker 1996).
3.3 Ground Penetrating Radar (GPR)
The GPR is a geophysical method based on the propagation and reflection of electromagnetic waves in the ground. The waves are transmitted into the ground by an antenna. The wave propagates until reaching a contrast in the dielectric parameters (permittivity and conductivity), then a part of the wave energy is refracted whereas the other part is either reflected towards the surface and captured by the receiver antenna or absorbed by the medium. This method uses the contrasts of dielectric permittivity ε (F/m) and electric conductivity σ (mS/m) to characterize the subsurface (Fauchard and Mériaux 2004).
The primary goal of investigation is to differentiate subsurface interfaces. The reflectivity of radar energy at a boundary between volcanic formations is a function of the magnitude of the difference in relative dielectric permittivity and electric conductivity between the two deposits. The greater the contrast in dielectric properties, the greater the velocity change, and the stronger the reflected signal (Sellmann et al. 1983). In volcanic deposits, velocities are generally between 0.04 and 0.14 m.ns−1. They are controlled principally by porosity, water content and matrix composition (presence of organics, clays, etc.) (Olhoeft 1984; Gómez-Ortiz et al. 2007).
The field work was performed using Ramac GPR system (Malå Geoscience). Two kinds of GPR’ sections were realized:
-
Common-offset profiles (COP) in order to obtain 2D time sections showing the different reflectors;
-
Common-midpoint profiles (CMP) to estimate the velocity of the electromagnetic waves underground, and then convert the 2D time sections into 2D depth sections.
In COP surveys, both antennae are regularly moved along a line, while maintaining constant antennae offset. The mid-point is also regularly moved forward. In CMP surveys, the receiver and the transmitter are moved in opposite directions to regularly increase the antennae offset.
Two different types of antennae were used in this study: 100 MHz frequency unshielded antennae and 500 MHz frequency shielded antennae. The shielding avoids air wave emission and associated noise and allows achieving a greater acquisition speed (shielded antennae have a wheel coder and are pulled whereas unshielded antennae are regularly moved along a decameter). The antennae frequency is chosen according to the required investigation depth and resolution, and the other acquisition parameters depend on the frequency (Tables 6.1 and 6.2).
Ground penetrating radar signal attenuation occurs as waves pass through the earth. The maximum effective depth of radar wave penetration depends mainly on the frequency of the radar waves and the physical characteristics of the volcanic deposits. A higher groundwater and/or clay content (high dielectric constant ε, high electrical conductivity σ) leads to a stronger attenuation and, therefore, a markedly reduced penetration depth. In ashy tephra deposits, the 100 MHz frequency antenna was used to obtain an investigation depth of approximately 15 and 30 m while the 500 MHz frequency antenna was used to investigate the first 1–4 m (Smith and Jol 1992; Schrott and Sass 2008).
The raw data is expressed in terms of propagation time to amplitude of the wave. To obtain a radar section in terms of depth, the raw data must be processed and the wave velocity in the ground has to be estimated using “Common Mid-Point” (CMP) data using unshielded 100 MHz antennae. The processing was realized using REFLEX W Software (Sandmeier Software) and consists in several stages described in the tables (Tables 6.3 and 6.4).
4 The Pavin Deposits
4.1 The Components
According to Bourdier (1980), the Pavin deposit (PD) is typically composed of three main types of particles: glass, lithics and minerals (Fig. 6.5). The glass corresponds to juvenile pyroclasts, which include pumices and dense glassy lapilli. The lithics consist of particles from the crystalline basement and old lavas (dense or vesiculated).

Photomicrographs of the Pavin’s juvenile melt. (a) is the PPL photomicrograph and (b) is the same photograph in XPL. (1) Typical paragenesis showing brown hornblende (Hb), clinopyroxenes (Cpx), plagioclase (Pl), apatite inclusions (Ap) and opaques (O). (2) Destabilization structure in a twinned and zoned plagioclase. (3) Shearing of an amphibole during the phreatomagmatic eruption
4.1.1 Juvenile Pyroclasts (JP)
The PD is characterized by the presence of pumices and glassy lapilli in all units. Juvenile pyroclasts are found at many scales from the fine fraction (ash) to blocks. Pumices are grey but frequently take a yellow color due to alteration. On hand specimens, phenocrysts are amphibole, pyroxene, plagioclase and opaque.
Mean mineral content estimates from 17 thin sections give 26 % of phenocrysts: 7 % brown hornblende (Fig. 6.5), 7 % clinopyroxenes (including augite and aegyrinic augite), 6 % plagioclases (andesine) and 3 % opaques. The groundmass includes 52 % glass and 22 % microcrysts with 15 % feldspars, 3 % hornblende, 3 % clinopyroxene, 2 % apatite, 1 % sphene and 1 % opaque (Melet 2009; Lêvèque and Vaillant 2010; Jaillard and Zylberman 2012). Microscopic textural criteria indicate two plagioclase populations: the first typically show disequilibrium textures such as sieved, spongy and different types of oscillatory zoning (2a and 2b, Fig. 6.5). Abundant melt inclusions varying from elongate to circular shapes result in coarse sieved texture. The second population represents an equilibrium texture with normal oscillatory zoning. Pumices can contain two main forms of vesicles: tubular microvesicles that can impart a fibrous fabric, and spherical to subspherical vesicles resulting from high vapor pressure during eruption. Sometimes glass splinters can be observed within the matrix, in particular on the periphery of vesicles. It is also important to notice that the vesicle content can vary widely. This was already noted by Bourdier (1980) who identified dense juvenile pyroclasts in some parts of the deposit.
4.1.2 Lithic Pyroclasts
The lithic pyroclasts consist of particles from the crystalline basement and old lavas. Three types of basement clasts (noted B) are identified: (1) cordierite-bearing migmatite (2) muscovite leucogranite with an assemblage of muscovite + biotite + perthitic microcline + oligoclase + quartz and (3) sillimanite-biotite-garnet gneiss with foliated texture made up of granular mineral grains, with an assemblage composed of rare cordierite + late muscovite + oxides + garnet + sillimanite + biotite + perthitic microcline + oligoclase +quartz (Bourdier 1980; Lêvèque and Vaillant 2010). The old lavas are subdivided in dense lavas (noted DLP for Dense Lithic Pyroclasts) and black to red scoria (noted VLP for Vesiculated Lithic Pyroclasts).
4.1.3 Minerals (Mnls)
Free minerals in the PD are diverse in nature. Two categories of free minerals have to be distinguished: xenocrysts from the basement (quartz, some feldspars and micas) and free minerals from the juvenile magma (feldspar, amphibole and pyroxene). Minerals are often found broken. The amounts vary widely depending on the fractions’ size.
4.2 The Clidères Section
The Clidères section is located 1.5 km south-east from the vent. By creating three study stations with different orientations, the Clidères outcrop allows an optimal characterization of the sedimentary structures in the PD (Fig. 6.6). Station n°1 shows the regional tephrostratigraphy of the Pavin group whereas the two other stations include only the Pavin deposit and a part of its direct basement layer as a reference level (i.e. Montchal trachy-basaltic lapilli deposit, noted BML). The Montcineyre basaltic lapilli are not present at this distance from the vent.

The Clidères outcrop. (a) Location of the Pavin’s reference outcrops; C – Clidères, L – La Liste, The topographic map is from IGN, 2006. (b) Photography of the Clidères outcrop and localization of the 3 study stations. (c) Station 1. (d) Station 2. (e) Station 3
Stratigraphic subdivisions were performed according to petrographical, sedimentological and grain size data. 26 tephra beds are grouped in four main units in the PD, which has a total thickness of 2.53 m at the Clidères outcrop (Fig. 6.7). The nomenclature used to describe the geological formations is as follows: P refers to the Pavin deposit, which is then subdivided in 4 units numbered from the oldest to the youngest (e.g. P1 is the first unit formed and P4 the last). Then, each of these units is detailed in a set of tephra beds named with letters where “a” is the oldest bed.

Lithostratigraphic column of the Pavin deposit
Some key features identified for each unit are described below (Table 6.5):
P1 unit is generally fine-grained and grey. The mean thickness is 58 cm varying laterally between 30 and 62 cm. It is subdivided in 9 beds with sharp contacts and horizontal bedding (Fig. 6.7). Beds with coarser grain-size have a red color on the top and around lapilli and blocks. The largest pumice measures 20 × 10 cm (bed P1g) and the largest basaltic bomb measures 14 × 11 cm (bed P1d). Sedimentary structures are rare. U-type erosional channels are found in P1e and are associated with a filling characterized by a normal graded deposit in P1c (Fig. 6.8, 3a and 3b). Moreover, some beds bevel laterally which explains the difference of bed number with other colleagues (Boivin et al. 2010). The beds have a bimodal grain-size distribution, except the bed P1b. For example, in P2e the two pics correspond to −2 ϕ and 2 ϕ. The lithological composition varies with the size fraction; the coarser is a pumice-rich fraction and the finer is an ash and mineral-rich fraction. Based on the lapilli + blocs fractions (> 1 mm), the relative proportions between juvenile clasts and lithics are estimated to 67–33 % in the coarser beds (1d, 1j) and near 33–67 % in finer beds (1a, 1f). We interpret this difference due to the fragmentation mechanisms. The poor-sorting associated with bimodal grain-size distribution and the sedimentary structures are typical of surge deposits. Furthermore, sedimentary structures such as bombsags (beds 1c, 1d, 1f and 1 g) are typical of ballistic deposits. Using the visual chart (Krumbein and Sloss 1956), the pumices have an average roundness/sphericity ratio of 0.4/0.5. In this unit, no accretionary lapilli are detected on the field but Boivin et al. (2010) have described proto-accretionary lapilli at a microscopic scale in beds 1a and 1 f.

The five main types of sedimentary structures of the Pavin deposit. Each number is accounting for a type of structure. (a) is the sedimentary structure as observed on the outcrop. (b) is the interpretation. (1) Anti-dunes and associated second order ripples. (2) Cross-stratifications. (3) U-type erosional channels. (4) Normal grading. (5) Impact-sags
P2 unit is grey, coarse-grained and has a 32 cm mean thickness (between 20 and 36 cm). It is composed of three beds (Fig. 6.7). This unit has an intermediate thin bed consisting of finer clasts (P2b) separating two thicker beds with reverse graded-bedding composed of lapilli. The beds P2a and P2c are well-sorted (pic: -3 ϕ), composed of 85 % lapilli clasts with a rare ashy matrix (15 %). The largest clast is a basaltic bloc measuring 23 × 13 cm (bed P2c). The pumices have an average roundness/sphericity ratio of 0.6/0.7. Based on the lapilli and block fractions (> 1 mm), the relative proportions between juvenile and lithic clasts are estimated to 80–20 % in the P2c bed. The lithic fraction is composed of dense basaltic to trachyandesitic lava, red and black scoriaceous lapilli and variscan gneiss and granites. In the lithic fraction, the ratio lavas/basement is near 3/2. This unit has typical characteristics of a volcanic fall deposit.
P3 unit is partially indurated and very fine-grained. It has a mean thickness of 86 cm (variation between 82 and 95 cm). Due to the presence of many cross beddings and discontinuities, we have distinguished only four main beds (or bedsets). P3 is mainly grey with some pinkish levels. This unit is well sorted, because the matrix represents more than 90 % of the deposit, but the grain-size distribution is bimodal because some lapilli and blocks are isolated in the ashy matrix (Fig. 6.7). The pic of the ash population is between 3 ϕ (bed P3b) and 2 ϕ (bed P3c) while the pic of the coarse population is −3 ϕ. The ratio juvenile/(juvenile + lithics) on the lapilli + bloc fraction is difficult to estimate, varying between 30 % (bed P3d) and 60 % (bed P3c). Sedimentary structures typical of surge deposits are more frequent than in other layers. Some channels , filled by coarser ash and characterized by diminishing grain-size towards the margin, are interpreted as erosional features of the pyroclastic surges. Cross-stratifications are observed in the P3b bed (Fig. 6.8, 2a and 2b) as well as a dune prograding to azimuth 70° overlapping oblique stratifications in which coarser beds are found (bottom left of the photography). This structure indicates that the main flow direction is near 160° azimuth (perpendicular to the photography). Antidunes and associated ripples (Fig. 6.8, 1a and 1b) were observed at study station n°2 with a 190° azimuth orientation in the P3b and P3c beds. These high-energy structures are characterized by the shortest side closer to the vent. Based on a wavelength (λ) and an amplitude (A), two main types of antidunes are distinguished: first, simple antidunes with low amplitude and short wavelength (A ≈ 5–10 cm; λ ≈ 20 cm) located in the P3d bed (labeled 1 in Fig. 6.8, 1b) and, second, complex antidunes with large amplitude and long wavelength (A ≈ 20–40 cm; λ ≈ 50 cm) with second order ripples (A ≈ 1.5 cm; λ ≈ 5 cm) themselves affected by third order ripples (A ≈ 0.5 cm; λ ≈ 1 cm) located in the P3b bed (labeled 2 in Fig. 6.8, 1b). Furthermore, sedimentary structures such as impact sags under blocks are typical of fall deposits. The largest basaltic lithic bomb (45 cm × 35 cm) cuts the P2 and P1 units and induces deformation of the Montchal trachy-basaltic lapilli deposit; the bombsag, filled with P3 material, has 0.8 m depth and 1.3 m large (Fig. 6.9). Bombsag deformation within the P3b bed (station n°2, Fig. 6.8, 5a and 5b) indicates a movement towards the south-east (N120). In this unit, no accretionary lapilli are detected.

Bombsag block at the station n°3 on the Clidères outcrop
P4 unit has a grey coarse-grained base (P4a to P4g) and an upper yellow fine-grained part (P4h to P4j). The thickness varies between 55 and 92 cm with a mean value of 77 cm (Fig. 6.7). At station n°3, it is subdivided into 10 beds that are less individualized than in P1. The beds have a poor sorting and, generally a bimodal grain-size distribution. For example, the P4d has a population centered on -3 ϕ and a second population around 1 ϕ. The lithological composition varies with the size fraction; the coarser is a pumice-rich fraction and the finer is an ash and mineral-rich fraction. Based on the lapilli + bloc fractions (> 1 mm), the ratio juvenile/(lithic + juvenile) varies around 60 % (55–75 %). In the lithic fraction, granitic gneissic xenoliths proportions are higher than in the P3 layer. P4 pumices also appear to be denser and less vesiculated than pumices of other levels. Moreover, they have a more yellowish color due to alteration. The pumices have an average roundness/sphericity of 0.5/0.7. Normal graded-beddings were observed in P4b (Fig. 6.8, 4b). We do not identify the presence of another unit on the top of the section (unit 5 in Boivin et al. 2010): due to the much higher clay and iron oxide-hydroxide content, we consider that the last P4 bed has undergone pedogenetic processes leading to weathering of primary volcanic materials (especially volcanic glass) and clay illuviation. In the P4 unit, the poor-sorting associated with bimodal grain-size distribution and the sedimentary structures are typical of surges deposits. In this unit, no accretionary lapilli are detected.
Contacts between the four units are sharp and clearly visible, relatively horizontal even if irregular at a smaller scale. No paleosol is detected between the units and with the Montchal lapilli fall.
4.3 The La Liste Section
The second reference section is located 2.4 km south of the Pavin maar in the La Liste area, beyond the west side of a small stream (Fig. 6.6, A, noted L). The PD covers the Montchal deposit with no paleosol. The total thickness of the section is 250 cm. Based on the sharp grain-size variations (or proportion of matrix) and the material composition, the section can be subdivided in 4 units similar with the Clidères section. The common characteristics are the coarser grain size of P2 and P4 units, the greater abundances of pumices in P2 and basement lithics in P4, as well as the lower abundance of scoria in P1. Moreover, the relative proportions between juvenile clasts and lithics in the lapilli + block fractions (> 1 mm) are similar to the Clidères section in the two coarser grain units (J% = 81–100 % in P2 and 59–81 % in P4).
However, some differences are observed. The first difference is the variation of the thickness of each unit: P1 and P3 units are thinner and P2 and P4 units are thicker. The second difference is the finer average grain-size distribution of the 4 units as indicated by the matrix proportion. The third difference is the size of the largest clasts: no pumice measures more than 16 × 10 cm and no lithic exceeds 10 × 7 cm. The fourth difference is the greater juvenile proportions in P1 (J% = 90–100 %) and P3 units (77–80 %) compared to the Clidères section, which comprises respectively 33–61 % and 30–57 %. The fifth difference is the lesser proportions of gneissic rocks in the lithic fraction (mostly 0–10 %). The last difference is the quasi-absence of sedimentary structures in the deposit, which is essentially planar.
These differences can be explained by the distance between the Pavin crater and the localization of the two sections: 2400 m for La Liste and 1500 m for Clidères . With distance, the average grain size, the size of the largest clasts and the thickness of units decrease while the pumice proportion increases in the coarser fraction due to their lower density. The greater thickness of P2 and P4 units could be linked to the greater southward extension of the dispersion area. The maar deposits range from thick, structureless and commonly block-rich beds near the vent to well-developed intermediate cross-bedding and duneform beds and thin distal planar beds.
5 Geophysical Study of the Pavin Deposit
5.1 Calibration of Geophysical Sections
First, we calibrate ERT and GPR results using the profiles above the two reference sections, allowing correlations between geophysical and geological sections (Fig. 6.4). We also used the results of the Pavin Drilling, located near the section L1 (square in Fig. 6.4). All the figures of the ERT and GPR surveys have vertical exaggeration.
The velocity value used for each GPR section is estimated from the CMP located nearby (Table 6.2). The method cannot resolve the thickness of beds thinner than approximately onefourth of the radar wavelength in the best case. For a 0.06 m.ns−1 velocity, the vertical resolution limits in volcanic deposits range between 15 cm for 100 MHz antenna and 3 cm for 500 MHz antenna. Where strata are thinner than this resolution limits, the GPR sections do not yield to an image showing the correct geometry of beds.
Above the Clidères outcrop (Line L2), the ERT maximum investigation depth is about 5 m with 0.5 m spacing between each electrode (Fig. 6.10). The model discretization yields to blocks with a width of 25 cm and a height between 18 and 62 cm (equivalent to the horizontal and vertical resolution).

Southeast-Northwest L2 ERT section above Clidères (Depth in meters)
On the ERT section L2 achieved above the Clidères outcrop, the PD has three sectors with lateral extension: an intermediate part with high resistivity values, between 3000 and 13,000 Ω.m framed by lower and upper parts with low resistivity values, between 300 and 3000 Ω.m (Fig. 6.10). At this scale of investigation, the P1-P2-P3 units are a set characterized by high resistivity values according to the total thickness of the very fine grained P1 and P3 units (near 160 cm) relative to the thinner P2 coarse-grained unit (about 25 cm). In this case, the low-resistivity values of the upper part are characteristic of the P4 unit and the low-resistivity values of the lower part are associated with Montchal and Estivadoux coarser deposits.
GPR section shows some reflectors that are well correlated with the depth and the thickness of deposits (Fig. 6.11). First, the trace clearly shows the air and surface waves with perfect horizontal reflections up to a time of 20 ns. The main reflector near 2.6 m depth represents the limit between the Montchal trachy-basaltic lapilli fall deposit and the PD (red arrows). The PD units form a stratified deposit near parallel to the surface. Moreover, near a depth of 2 m, two reflectors are near parallel to the surface (black arrows) and separate units characterized by oblique reflectors interpreted as cross bedding of base surge deposits (surrounded areas). The two reflectors could be interpreted as P2 lower and upper limits. The reflector near the depth of 6 m can be interpreted as the base of Estivadoux surges deposits.

Southeast-Northwest L2 GPR section above Clidères (Depth in meters)
For the La Liste outcrop (line N5 on Fig. 6.4, oriented NW-SE), the ERT investigation depth is about 10 m with a 1 m spacing between each electrode. The resolution values are also twice less than those of the Clidères section. At this scale of investigation, the P2 unit is undistinguishable and the higher resistivity (3000–13,000 Ω.m) is associated with the finest-grained deposits (P1-P3). The P4 layer is characterized by low resistivity values, between 1300 and 3000 Ω.m (Fig. 6.12).

Northwest – Southeast N5 ERT Section above La Liste (Depth in meters)
The GPR section is oriented NW-SE (Fig. 6.13). Using the 100 MHz antenna, the depth of investigation is a dozen meters. The main reflector has a depth between 2 and 2.2 m. Above this limit, reflectors tend to be fairly continuous and horizontal while just below there are many diffraction hyperbolas.

Southeast–Northwest N5 GPR section above La Liste (Elevation in meters) Northwest–Southeast GPR section above La Liste (Depth in meters). Without Kirchoff migration
On the first two meters deep, there are in average six subhorizontal and sub-parallel reflectors. Each reflector is near 35 cm thick. The two first reflectors and the base of the top reflector are continuous over the entire length of the section. The other three reflectors have some lateral discontinuities, marked by oblique reflectors; for example, at the points 10 m, 17 m, 33 m and 49 m (black ovals). The above-described reference geological cross-section is located between 28 and 38 m.
The boundary between subhorizontal reflectors domain and the hyperbolae domain corresponds to the contact between the Holocene volcanic deposits and the bedrock which corresponds to glacial moraine deposits. The hyperbolae therefore represents the blocks within the moraine, whose size is greater than 15 cm to be detectable as a point of diffraction with the conditions used (100 MHz, unshielded, v = 0.059 m/ns). This interpretation is consistent with field observations and bibliographic data (Van Overmeeren 1998).
Among the Holocene volcanic deposits (upper part), the outstanding features are the absence of diffraction with hyperbolae which indicates the quasi-absence of ballistic blocks with size larger than 15 cm in these deposits according to the lithological data. There are also oblique or undulating reflectors diagnostic of surge deposits (Cagnoli and Ulrych 2001a, b). These reflectors correspond to the P3 deposit (fine material with dunes and cross-bedding). However, we must remain cautious because the device used is near the limit of detection of objects (small dunes measuring a few decimeters).
5.2 Long Geophysical Transverses from Proximal to Intermediate Area
ERT data was collected from three transverses (L1, L3, L8) over long unexposed fields to estimate thickness variations of the PD from proximal to intermediate area. The ERT sections were carried out with a 5 m spacing between electrodes leading to an investigation depth of about 45 m (Fig. 6.14). Section L1 is a geophysical line of 1275 m oriented towards the SE along the road between the Pavin crater and the Costes outcrop. This section is calibrated with the Clidères outcrop (this study) and the 1979 Pavin Drilling. The L3 section follows the GR30-GR41 trail with a N-S orientation over a distance of 1275 m. Finally, the section L8 extends 795 m in a SW-NE direction.

Pseudo-3D representation of the L1, L3 and L8 resistivity sections
At this scale of investigation, the PD has resistivity values compatible with the reference sections (3000–13,000 Ω.m) in the proximal area. On ERT sections, the PD has a thickness of about 15 m in the proximal zone which decreases less rapidly to the south than to the southeast. In fact, at 1.2 km from the crater rim, the thickness of the deposit reaches 7–10 m southwards whereas it is only 1 m to the SE. On distal area, the decrease in thickness explains the low resistivity values because the horizontal resolution is 2.5 m and the vertical one varies between 1.8 m and 6 m. Moreover, in the proximal area, the PD covers the Montchal lava flow which is characterized by a high resistivity (> 3000 Ω.m). In this sector, the Montchal lava flows northward from the point 700 m on the L3 section. A second Montchal lava flow appears at the southern end of the L3 section, between 1175 and 1245 m. On the section L1, the Montchal lava flow is located between 1250 m (proximal) and 645 m. The abnormal change in the flow geometry between 900 m and 600 m could be attributed to the edge of the Estivadoux maar.
A GPR
survey was conducted on the road with a direction parallel to ERT L1 sections (except for the 200 first meters with a direction parallel to ERT
L3). The beginning of the GPR survey is the edge of the crater. Data collected with the 500 MHz antennae allow high resolution images of the subsurface and highlight bedding features from the surface to about 3.6 m (Fig. 6.15). In the proximal area (0–700 m), the topographic surface has a gentle slope near 2°. The continuous radar section shows the upper part of the P4 unit, according to the Pavin drilling located at 325 m. The deposits are characterized by subhorizontal reflectors (except near 200 m) and by the presence of diffraction with hyperbolae and attenuated area just below which indicates the presence of ballistic blocks. Of particular interest, the area between 400 and 500 m is littered with metric blocks which represent the last explosion (one example is surrounded). This is consistent with our field observations along the profile and the localization of the largest ejected blocks with a diameter of 4.5 m (Lorenz 2007). Between 550 and 750 m, the northwest dip is an artefact because no topographic correction is done here; this area corresponds to a natural higher slope (10–15°) associated with the eastern boundary of the Montchal lava flow. In the intermediate and distal area (700–1350 m), three reflectors are well marked: at a depth of 1 m, 2 m and 2.7 m. According to the Clidères
section (point 950 m), they correspond respectively to the boundaries between P4-P3, P3-P2 and P1-Montchal. Surprisingly, the P4 deposit partially molds and fills an undulating topography composed of subparallel reflectors of P1-P2-P3 deposits. The attenuated reflection area near the base of P4 is explained by the water content of this permeable unit and the impermeable behavior of the P3 fine ash unit. The P4 unit has characteristics of pyroclastic surges because it fills the topographic lows, have oblique reflectors corresponding to cross-bedding (surrounded area near 1090 m and 1200 m) and some little blocks with hyperbola reflections.

GPR section near parallel to ERT L1 section (Zero is near Pavin crater and 1350 is near Costes outcrop). Two velocities are applied (0–540 m: 0.0736 m/ns; 540–1340 m: 0.0582 m/ns) because of lateral velocity variation revealed by CMP. As no topographic correction is made, the zero depth is the ground surface
6 Discussion
6.1 The Pavin Eruption Dynamics
The Pavin layers are characterized by alternating base surge associated with ballistic blocks and ash fall beds which represent instantaneous pulses of explosive activity during the formation of the crater. Consequently, a detailed study of the vertical variations of the maar deposits, based on field textures, componentry, SEM morphoscopy of juvenile ash particles and geometry of beds provides a way to access the changes in dominant eruptive styles. During the Pavin eruption, the 4 main units occurred in a relatively short period of time, almost simultaneously at the geological scale (no paleosol).
According to the Lorenz’ model (1986), the Pavin maar could result from fluctuating eruptive conditions related to changing magma-water interactions.
P1 unit is a typical period of alternating base surge and ash fall. In this case, the ascending trachy-andesitic magma enters in contact with water. During the P2 phase, the magmatic component is more expressed, with fragmentation and eruption driven by exsolved magmatic volatiles, resulting in the generation of a sustained plume with a subplinian intensity. The fallout products mostly consist of pumice lapilli-rich deposits, relatively lithic-poor. During the P3 sequence, depending on the Lorenz’s model, the largest water availability in the aquifer just above the basement could lead to the best conversion rate of energy into fragmentation, thus resulting to fine particles and to a stratified pyroclastic surges sequence. Then, a dramatic change occurs: within P4, fragments from the basement are more abundant, indicating deeper magma-water interactions. Lithic clasts data show that the depth of magma-water explosive interaction was in the order of a few 100 m based on the presence of granitic gneissic lithic rocks in the deposit. According to the Pavin drilling, the depth of the Variscan basement is inferred near an altitude of 1050 m, i.e. 170–200 m below the top of the tuff ring (Bourdier 1980). In the basement, there is a quasi-absence of aquifer. The evolution could confirm the enlargement of the diatreme, and its deeper evolution with time, as indicated by Lorenz (2007).
However, interacting with the depth of fragmentation, pulsating mass eruption rates control the fluctuating magmatic-hydromagmatic activity (Sheridan and Wohletz 1983; White and Houghton 2000). So, the P2 phase coincides with the highest magmatic eruption rate. Moreover, the evolution towards increased fragmentation and a more hydromagmatic character during P3 may reflect the progressive depletion of magmatic volatiles and a decrease in conduit pressure during the last stage of the eruption. The P4 unit could reflect a decrease of the mass eruption rate with a better crystallized magma composed of less volatiles.
The last interdependent factor that can control the fluctuating magmatic-hydromagmatic activity is the aquifer yield. Generally, maars are found in subaerial areas underlain with hard rocks of varying compositions where groundwater is usually located in hydraulically active zones of structural weakness such as the Eifel in Germany (Lorenz and Büchel 1980) or they occur in soft rock environments as grabens with synsedimentary volcanism such as the Limagne basin in France (de Goër 2000). The localization of the Pavin maar belongs to the first category. The aquifer was formed in fractured rocks of predominantly volcanic lavas and granitic gneissic basement. The maar is in exact coincidence with the ancient valley floor corresponding to the Montchal lava flow. This suggests that stream water entering from above, or ground water circulating along joints or faults below the valley floor, provided the source for the large amounts of gas required to eject the juvenile rocks and wall-rock debris. During the eruption, the hydrogeological conditions changed with the nature of the country rocks and the wall rock collapsed in the diatreme zone. Moreover, abundant basement clasts in the upper part of the deposit (P4) could indicate that the Pavin maar formed during the downward migration of foci explosions as the depression cone formed in a shallow aquifer according to the Lorenz’s model.
Another interpretation of the Pavin eruption dynamics can use the results of the scaled subsurface blast experiments with variable explosion depths, and presence or absence of preexisting crater (Valentine and White 2012; Valentine et al. 2012, 2014; Graettinger et al. 2014). In recent experimental subsurface explosions (Goto et al. 2001; Valentine et al. 2014), the crater morphology and ejecta dynamics are largely determined by scaled depth, D sc = d. E -1/3, where d is the physical depth of the explosion site and E is the mechanical energy (J) produced by the explosion. For the optimal scaled depth (D sc ≈ 0.004 m J-1/3), the crater has its largest value. With an increase of the scaled depth relative to the optimal depth of burial for a given explosion energy, the resulting craters are smaller until D sc ≈ 0.008, which marks the approximate transition to non-eruptive explosion (Graettinger et al. 2014; Valentine et al. 2014). Because most phreatomagmatic explosions have energies between 109 and 1013 J, the non-eruptive depth calculated from the equation is in the range between 8 and 172 m. So, the explosions mostly occur at depth < 200 m and explosions that contribute most to tephra ring deposits are likely to occur at depths < 100 m (Valentine et al. 2014). This is consistent with our field data because (1) the depth of the gneissic basement is 170–200 m below the highest top of the Pavin tuff ring and near 100 m below the lowest top of the tuff ring, (2) the gneissic lithics are rare or absent in P1 and (3) the shallow-derived lava lithics are between 60 and 80 % of the lithic fraction of P2, P3 and P4 deposits at Clidères (Fig. 6.7). However, note that the presence of granitic gneissic lithics in the tephra beds does not mean that the explosion occurred at the basement depth, but rather, according to Valentine and White (2012), that some prior explosions occurred at depth and mixed the lithics upward until they could be ejected by shallow explosions.
In the field-scale analog experiments, the explosion jets have heights and shapes that are strongly controlled by scaled depth and by the presence or absence of a crater. Jet properties influence the distribution of ejecta deposits outside the craters. As explosion depth increases from optimal depth (largest crater) to non-eruptive explosion depth, the eruption jets become increasingly vertically focused. In this case, the vertical core of the jet is associated with rapid fall and sedimentation of coarse material in the crater. The fall induces the formation of dilute fine-grained pyroclastic density currents outer the crater (Valentine et al. 2012; Graettinger et al. 2014). This mechanism could explain the P3 deposits characterized by very fine-grained clasts associated with rare ballistic blocks. In comparison with P1, the abundance of surges in P3 could result in the deepening of explosions or in the presence of a deeper crater after the sub-plinian P2 phase. This mechanism could also explain the greater relative abundance of granitic gneissic lithics in P4, because the ballistic blocks, vertically focused, fallback in the crater during P3 phase.
Finally, in the blast experiments, the deep-seated materials are not ejected as far as shallow-seated materials (Graettinger et al. 2014). This is consistent with the difference between the two reference sections and the Pavin drilling. The La Liste section, 2.4 km distant from the crater, contains less granitic gneissic rock in the lithic fraction (mostly 0–10 %) than the Clidères reference section, localized 1.5 km from the crater, which has between 20 and 33 % granitic gneissic lithics and the Pavin drilling (500 m from the crater) with 20–50 % granitic gneissic lithics.
6.2 Dispersal Area and Volume of the Pavin Volcanic Deposit
After defining the main characteristics of the deposit, a mapping campain was performed in order to map the area of dispersion and to build an isopach map for the Pavin deposit (Fig. 6.4).
Data available from previous studies (Bourdier 1980; Melet 2009; Lêvèque and Vaillant 2010; Davesne and Demoulin 2010; Batailler and Jallais 2012; Jaillard and Zylberman 2012) was collected and synthesized on a map built with the ArcGIS software (©ESRI, 2010). To this data were added some thickness measures from the significant work carried out by Lavina (Lavina 2002; Lavina and del Rosso d’Hers 2006, 2009; del Rosso d’Hers et al. 2008) for the achievement of the geological map of the Pavin area (Thonat et al. 2015). Some thickness values estimated from ERT sections or from digging were also added to the map (Lêvèque and Vaillant 2010; Davesne and Demoulin 2010; Batailler and Jallais 2012; Jaillard and Zylberman 2012).
Based on the data, an isopach map is proposed for the Pavin deposit (Fig. 6.16). The extension of the volcanic cloud to the south-east is coherent with Bourdier’s result (1980). This extension axis is also consistent with information given by sedimentary structures such as cross-bedding and impact sags. However, the new map shows a more irregular and asymmetrical shape, with locally important thickness variations. Those changes are mostly reflecting the variability of the topography before eruption (Montchal scoria cone and lava flows with rootless cones) but also last eruptive dynamics dominated by surges deposits controlled by the topography, even if significant variations may be due to later erosional processes. To avoid at the maximum the effect of post-eruptive erosional processes, some anomalous points with very low thickness values were not taken into account.

Isopach model of the Pavin deposit (thickness and grid in meters, RGF93 – Lambert93)
Most important thickness variations result in isopachs undulations (see isopachs 0.5 m and 1 m east to the Pavin, and between the Montchal and Montcineyre cones). Such geometry cannot only result from a unique dynamism such as wind-controlled ash fall deposits. Thus, it is likely that this phenomenon expresses when some particular volcanic dynamism such as base surges flow on an irregular topography at intermediate distances from the vent. The bulk of sedimentary structures, such as cross-stratification, are also mostly found in this zone which is consistent with this observation.
On the Fig. 6.16, dashed isopach curves indicate that the drawing is not based on measured thicknesses but that it is either an interpretation from this study (to the west) or based on other observations: to the south and east, dashed isopach curves are based on Bourdier (1980), and to the north it is based on observations from Lavina who found rare outcrops of preserved fine trachytic particles attributed to the Pavin (Thonat et al. 2015).
Based on the digitalized isopachs surfaces (Surfer 8, Golden Software Inc., 2002), the calculated total area is 146 km2 and the calculated total volume 5.2 × 10⁷ m3. This new area is 51 km2 bigger (54 %) and the volume is 2.3 × 10⁷ m3 lesser (31 %) than previously estimated with 95 km2 and 7.5 × 10⁷ m3 (Bourdier 1980), which is mainly due to the estimation of a thinner proximal deposit. However, it is today known that fine particles from the Pavin eruption extended far beyond what was previously thought: to the south, up to 60 km on the Cantal and Cézallier reliefs (Juvigné and Gilot 1986; Gewelt and Juvigné 1988) and to the north, up to 30 km on the Chaîne des Puys s.s. (Juvigné et al. 1988; Juvigné and Stach-Czerniak 1998). The amount of ash loss during maar eruption is difficult to estimate; in Italian examples, it was estimated to 50 % (Giaccio et al. 2007; Sotilli et al. 2012), then the estimated total volume could be near 7.8 × 10⁷ m3. The Pavin maar has a volume of erupted products in the range typical of maar and tuff-ring volcanoes 1 × 10⁵ – 1 × 10⁹ m3 (White and Ross 2011).
Based on the recent geomorphology section of the lake (Chapron et al. 2012), the crater volume yields a value of 3.7 × 10⁷ m3. For comparison, within the deposits, the proportions of lithic clasts are approximately 40 and 33 % in proximal outcrops and 33–20 % on distal outcrops. So, the excavated volume is estimated to the third of the total volume of deposits, that is approximately 1.7 × 10⁷ m3 (if 50 % of ash loss, 2.6 × 10⁷ m3). Probably the proportions of lithic clasts are underestimated in the proximal area (according to the experiments of Valentine et al. 2012), the excavated volume could be the half of the total volume of the deposits, i.e. 2.6 × 10⁷ m3 (and near 3.7 × 10⁷ m3 if 40 % of ash was lost). Also, the estimated volume for the lithic component in the erupted products corresponds broadly to the excavated volume if we consider 40 % of ash loss.
The asymmetry of the disposal area could be induced by laterally shifting explosion sites during the eruption. In analogy with the migration of explosions in field subsurface experiments (Valentine et al. 2015), a tilted-jet can result from the localization of the explosion site near one side of the crater. In this case, the material is mostly dispersed in the same direction than the jet and in the opposite direction of the nearest crater wall. Even if the experiments are most directly related to early phase of maar development, Valentine et al. (2015) expect that the phenomena will be similar to a mature maar. Application to the Pavin deposit could indicate that the major site of explosions is near the northwest crater wall.
7 Conclusion
A new complete tephrostratigraphy of the Pavin volcanic deposit is defined with a new reference section named Clidères . The 26 tephra beds and bed sets correspond to four volcanic units. The deposits are composed of high energy basal surges, ballistic blocks, lapilli fall and mixed dynamisms. The vertical variations of the maar deposits provide a way to access the fluctuating eruptive conditions related to changing magma-water interactions of the four main phases. The changes are associated to simultaneous variations of three factors: the pulsating mass eruption rates, the depth of fragmentation and the aquifer yield. However, a more comprehensive study of facies associations and their lateral distributions is needed to reconstruct the explosion conditions that occurred during the eruptive sequence.
In comparison with trachytic or benmoreitic volcanoes of the Chaîne des Puys, the Pavin maar shows the particularity that no extrusion of a gas-poor magma took place within the crater at the end of the eruption. It seems thus likely that a gas-poor part of the magma was not able to reach the surface but now rests at a shallow depth (Bourdier and Vincent 1980). The last phase, P4, has some biotite-rich juvenile fragments which could correspond to the north cloud identified by Juvigné and Miallier (2016). A more detailed mapping of proximal to intermediate products is necessary to identify the extension of deposits of each phase.
Based on the combination of two geophysical methods, ground penetrating radar and electrical resistivity surveys, the boundaries of the volcanoclastic deposits are visualized and the average thickness of the formation is followed from proximal to intermediate locations. Including the combination of field observations of near 50 trenches of 1–2 m depth, a core drilling and geophysical profiles, the total volume of deposits is now estimated at 5.2 × 10⁷ m3.
The geophysical study could be improved by longer profiles along the main N-S dispersal axis and orthogonal E-W axis. In particular, using 50 or 100 MHz antennae and a 5 m electrode spacing in the thicker proximal deposits could achieve to a higher investigation depth and using 500 MHz antennae and a 1 m electrode spacing in the distal thinner deposits could achieved to a better resolution.
References
ABEM Instrument (2006) Instruction Manual – Terrameter SAS 4000 – SAS 1000
Batailler A, Jallais N (2012) Origine des dépressions subcirculaires énigmatiques de la plaine de La Liste (Massif Central français) volcanique, glaciaire ou anthropique ? Caractérisation des formations et apports de la géophysique. Mémoire d’Initiation à la Recherche n°570, Unpublished data. Institut Polytechnique LaSalle Beauvais, p 124
Boivin P, Jouhannel S (2016) The origin of lake Pavin: 200 years of controversy. Chapter 5, this book
Boivin P, Bourdier J-L, Camus G, de Goër de Herve A, Gourgaud A, Kieffer G, Mergoil J, Vincent PM, Auby R (1982) Influence de la Nature des Magmas sur l’Activité Phréatomagmatique: approche Volcanologique et Thermodynamique. Bull Volcanol 45:25–39
Boivin P, Besson JC, Ferry P, Gourgaud A, Miallier D, Thouret JC, Vernet G (2010) Le point sur l’éruption du lac Pavin il y a 7000 ans. Rev Sc Nat Auvergne 74:47–58
Bourdier JL (1980) Contribution à l’étude volcanologique de deux secteurs d’intérêt géothermique dans le Mont-Dore: le groupe holocène du Pavin et le massif du Sancy. Thèse de doctorat Sciences de la Terre : Université de Clermont-Ferrand. 196p
Bourdier JL, Vincent PM (1980) A geological and geothermal approach of the Pavin area, southern chaîne des Puys (France). Advances in European Geothermal Research, In: Proceedings of the second international seminar on the results of EC geothermal energy research, 238–249 Springer Netherlands: Amsterdam.
Büttner R, Zimanowski B (1998) Physics of thermohydraulic explosions. Phys Rev E Stat Nonlinear Soft Matter Phys 57:5726–5729
Cagnoli B, Ulrych TJ (2001a) Downflow amplitude decrease of ground penetrating radar reflections in base surge deposits. J Volcanol Geotherm Res 105:25–34
Cagnoli B, Ulrych TJ (2001b) Ground penetrating radar images of unexposed climbing dune-forms in the Ubehebe hydrovolcanic field (Death Valley, California). J Volcanol Geotherm Res 109:281–300
Camus G, (de) Goër De Herve A, Kieffer G, Mergoil J, Vincent PM (1973) Mise au point sur le dynamisme et la chronologie des volcans holocènes de la région de Besse-en- Chandesse (Massif Central français). C R Acad Sci 27:629–632
Carrasco-Nunez G, Ort MH, Romero C (2007) Evolution and hydrogeological conditions of a maar volcano (Atexcac crater, Eastern Mexico). J Volcanol Geotherm Res 159:179–197
Chapron E, Ledoux G, Simonneau A, Albéric P, St-Onge G, Lajeunesse P, Boivin P, Desmet M (2012) New evidence of holocene mass wasting events in recent Volcanic Lakes from the French Massif Central (Lakes Pavin, Moncineyre and Chauvet) and Implications for natural hazards. In: Yamada Y. et al. (ed), Submarine Mass Movements and their Consequences, pp 255–264
Davesne JM, Demoulin M (2010) Volcanologie du système Pavin: caractérisation du puy de Montchal et de ses produits. Mémoire d’Initiation à la Recherche n°49, Unpublished data. Institut Polytechnique LaSalle Beauvais, p 156
(de) Goër De Herve A (1997) Volcans d’Auvergne: la menace d’une éruption ? Editions Ouest-France, Luçon, 64 p
del Rosso d’Hers T, Lavina P, Levy-Faict TW (2008) Le complexe volcanique Montchal – Pavin – Montcineyre: caractérisation des risques naturels associés. 18ème réunion Annuelle des Sciences de la Terre, Nancy.
Fauchard C, Mériaux P (2004) Méthodes géophysiques et géotechniques pour le diagnostic des digues de protection contre les crues – Guide pour la mise en œuvre et l’interprétation. Cemagref Editions, Paris, 124p
Gewelt M, Juvigné E (1988) Téphrochronologie du tardiglaciaire et de l’holocène dans le Cantal, le Cézallier et les Monts Dore (Massif Central, France): résultats nouveaux et synthèse. Bulletin de l’Association française pour l’étude du Quaternaire 1:25–34
Giaccio B, Sposato A, Gaeta M, Marra F, Palladino DM, Taddeucci J, Barbieri M, Messina P, Rolfo MF (2007) Mid-distal occurences of the Albano Maar pyroclastic deposits and their relevance for reassessing the eruptive scenarios of the most recent activity at the Colli Albani volcanic district, central Italy. Quat Int 171–172:160–178
Glangeaud P (1916) Le cratère-lac Pavin et le volcan de Montchalm (Puy-de-Dôme). C R Acad Sci 162:428–430
Goër De Herve A (de). (2000) Peperites from the Limagne trench (Auvergne, French Massif Central): a distinctive facies of phreatomagmatism pyroclastics, history of a semantic drift. In: Leyrit H, Montenat C (eds) Volcaniclastic Rocks, from magmas to sediments. Gordon and Breach Science Publisher, Amsterdam, pp 91–110
Gómez-Ortiz D, Martín-Velázquez S, Martín-Crespo T, Márquez A, Lillo J, López I, Carreño F, Martín-González F, Herrera R, De Pablo MA (2007) Joint application of ground penetrating radar and electrical resistivity imaging to investigate volcanic materials and structures in Tenerife (Canary Islands, Spain). J Appl Geophys 62:287–300
Goto A, Taniguchi H, Yoshida M, Ohba T, Oshima H (2001) Effect of explosions energy and depth to the formation of blast wave and crater: field explosion experiment for the understanding of volcanic explosion. Geophys Res Lett 28:4287–4290
Graettinger AH, Valentine GA, Sonder I, Ross P-S, White JDL, Taddeucci J (2014) Maar-diatreme geometry and deposits: subsurface blast experiments with variable explosion depth. Geochem Geophys Geosyst 15:740–764, doi: 10.1002/2013GC005198
Houghton BF, Wilson CJN, Smith RT, Gilbert JS (2000) Phreatoplinian eruptions. In: Sigurdsson H (ed) Encyclopedia of volcanoes. Academic, San Diego, pp 513–525
Jaillard A, Zylberman W (2012) Caractérisation géophysique et pétrologique des dépôts volcaniques du cratère-lac Pavin. Nouvelle estimation du volume de la nuée. Mémoire d’Initiation à la Recherche n°591, Unpublished data. Institut Polytechnique LaSalle Beauvais, p 126
Juvigné E, Gilot E (1986) Ages et zones de dispersion de téphra émises par les volcans du Montcineyre et du lac Pavin (Massif Central, France). Zeit der deutschen geologischen Ges 137:613–623
Juvigné E, Miallier D (2016) Distribution, tephrostratigraphy and chronostratigraphy of the widespread eruptive products of Pavin volcano. Chapter 8. This book
Juvigné E, Stach-Czerniak A (1998) Etude sédimentologique et palynologique des dépôts lacustres tardiglaciaires et holocènes du Gour de Tazenat (Massif Central, France). Quaternaire 9(1):15–23
Juvigné E, Lousberg N, Gewelt M (1988) Evolution morpho-sédimentaire de la Narse d’Espinasse. Rev Sc nat d’Auvergne 53:7–14
Krumbein WC, Sloss LL (1956) Stratigraphy and sedimentation. Freeman and Company, San Francisco
Lavina P (2002) Rapport d’activité de l’année 2001–2002 pour le levé de la carte géologique de Besse n°741: cartographie géologique et campagne de sondages à la tarière
Lavina P, del Rosso d’Hers T (2006) Les éruptions volcaniques holocènes du système Montcineyre – Montchal – Pavin: les nouvelles découvertes. 16ème réunion Annuelle des Sciences de la Terre, Dijon.
Lavina P, del Rosso d’Hers T (2009) Le système volcanique du groupe Montchal – Pavin: nouvelle stratigraphie des formations volcaniques et volcano-sédimentaires et nouvelles datations, volcanologie dynamique et structurale. Colloque International Lac Pavin et autres lacs méromictiques, Besse-et-Saint-Anastaise
Lecoq H (1835) Description pittoresque de l’Auvergne, le Mont Dore et ses environs. Baillière ed, Paris, 437p
Lêvèque Y, Vaillant M (2010) Système Pavin: caractérisation de la dynamique éruptive du cratère-lac Pavin. Mémoire d’Aptitude à la Géologie n°511. Unpublished data. Institut Polytechnique LaSalle Beauvais, p 121.
Loke MH (2003) RES2DINV Rapid 2-D Resistivity and IP inversion using the least squares method. Manual. Geotomo Software, Penang
Loke MH, Barker RD (1996) Rapid least-squares inversion of apparent resistivity pseudosections by a Quasi-Newton method. Geophys Prospect 44:131–152
Lorenz V (1973) On the formation of Maars. Bull Volcanol 37:183–204
Lorenz V (1986) On the growth of maars and diatremes and its relevance to the formation of tuff rings. Bull Volcanol 48:265–274
Lorenz V (1987) Phreatomagmatism and its relevance. In: Bottinga Y, Mathieu J-C (eds) Liquid Silicates, vol 62, Chem Geol., pp 149–156
Lorenz V (2007) Syn- and posteruptive hazards of maar-diatreme volcanoes. J Volcanol Geotherm Res 159:285–312
Lorenz V, Büchel G (1980) Zur Vulkanologie der Maare und Schlackenkegel der Westeifel. Mitt Pollichia 68:29–100
Melet C (2009) Montcineyre – Groupe Montchal – Pavin: Nouvelle caractérisation des formations et apport à la téphrochronologie du système Pavin. Mémoire d’Aptitude à la Géologie n°473. Unpublished data. Institut Polytechnique LaSalle Beauvais, 215 p.
Ménard JJ (1979) Contribution à l’étude pétrogénétique des nappes de ponces du massif volcanique du Mont-Dore. Thèse 3° cycle, Université Paris-Sud.
Olhoeft GR (1984) Applications and limitations of ground-penetrating radar. In: Expanded abstracts of the 54th Annual SEG International Meeting and Exposition. Atlanta, pp 147–148
Ollier CD (1967) Maars: their characteristics, varieties and definition. Bull Volcanol 31:45–75
Russel JK, Stasiuk MV (1997) Characterization of volcanic deposits with ground-penetrating radar. Bull Volcanol 58:515–527
Schrott L, Sass O (2008) Application of field geophysics in geomorphology: Advanced and limitations exemplified by case studies. Geomorphology 93:55–73
Sellmann PV, Arcone SA, Delaney AJ (1983) Radar profiling of buried reflectors and ground water table. Cold Regions Research and Engineering Laboratory Report 83-11, pp 1–10
Sheridan MF, Wohletz KH (1983) Hydrovolcanism: basic considerations and review. J Volcanol Geotherm Res 17:1–29
Smith DG, Jol HM (1992) Ground-penetrating radar investigation of a Lake Bonneville delta, Provo level, Brigham city, Utah. Geology 20:1083–1086
Sotilli G, Palladino DM, Gaeta M, Masotta M (2012) Origins and energetics of maar volcanoes: examples from the ultrapotassic Sabatini Volcanic Distric (Roman Province, Central Italy). Bull Volcanol 74:163–186
Thonat A, Blein O, Feybesse JL, Chévremont P, Morel M, Bouillier R et Lavina P (2015, in press). Carte géologique de Besse n°741. BRGM-SDG édition
Valentine GA, White JDL (2012) Revised conceptual model for maar-diatremes: Subsurface processes, energetics, and eruptive products. Geology 40:1111–1114
Valentine GA, White JDL, Ross P-S, Amin J, Taddeucci J, Sonder I, Jonhson PJ (2012) Experimental craters formed by single and multiple buried explosions and implications for volcanic craters with emphasis on maars. Geophys Res Lett 39, L20301. doi:10.1029/2012GL053716
Valentine GA, Graettinger AH, Sonder I (2014) Explosion depth for phreatomagmatic eruptions. Geophys Res Lett 41:3045–3051
Valentine GA, Graettinger AH, Macorps E, Ross P-S, White JDL, Döhring E, Sonder I (2015) Experiments with vertically- and laterally-migrating subsurface explosions with applications to the geology of phreatomagmatic and hydrothermal explosion craters and diatremes. Bull Volcanol 77:15. doi:10.1007/s00445-015-0901-7
Van Overmeeren RA (1998) Radar facies of unconsolidated sediments in The Netherlands: a radar stratigraphy interpretation method for hydrogeology. J Appl Geophys 40:1–8
White JDL, Houghton B (2000) Surtseyan and related phreatomagmatic eruptions. In: Sigurdsson H (ed) Encyclopedia of volcanoes. Academic, San Diego, pp 495–513
White JDL, Ross PS (2011) Maar-diatreme volcanoes: a review. J Volcanol Geotherm Res 201:1–29
Wohletz KH, Sheridan MF (1983) Hydrovolcanic explosions II: evolution of basaltic tuff rings and tuff cones. Am J Sci 283:385–413
Wolhetz KH (1986) Explosive magma-water interaction: thermodynamics, explosive mechanisms, and filed studies. Bull Volcanol 48:248–264
Acknowledgements
This work was funded by the Institut Polytechnique LaSalle Beauvais. We give special thanks to field technicians Antoine Auffray, Thibaut Allary and Camille Dufeu and to engineering students, without whom digging and carrying geophysical equipment would not be so easy. We thank Alexandra Batailler, Erika Döhring, Nolwenn Jallais, Caroline Melet, Jean-Marie Davesne, Mathieu Demoulin, Yowen Lévêque, and Matthieu Vaillant for useful discussions and sharing observations and opinions in the field.
We are grateful to Lahcen Zouhri and Claire Podevin for discussions on hydrogeological characteristics in volcanic fields. We wish to thank Philippe Rocher (BRGM-Auvergne, Clermont-Ferrand), Philippe Rossi and Olivier Blein (BRGM-CDG, Orléans) providing us the authorization to use the drilling results on mecanical augers and share mapping data from Pierre Lavina to the geological map Besse N°741 (Thonat et al. 2015, in press). The paper greatly benefited from the thorough revision of Jean-Louis Bourdier and Franck Donnadieu.
Author information
Authors and Affiliations
Corresponding author
Editor information
Editors and Affiliations
Rights and permissions
Copyright information
© 2016 Springer International Publishing Switzerland
About this chapter
Cite this chapter
Leyrit, H., Zylberman, W., Lutz, P., Jaillard, A., Lavina, P. (2016). Characterization of Phreatomagmatic Deposits from the Eruption of the Pavin Maar (France). In: Sime-Ngando, T., Boivin, P., Chapron, E., Jezequel, D., Meybeck, M. (eds) Lake Pavin. Springer, Cham. https://doi.org/10.1007/978-3-319-39961-4_6
Download citation
DOI: https://doi.org/10.1007/978-3-319-39961-4_6
Published:
Publisher Name: Springer, Cham
Print ISBN: 978-3-319-39960-7
Online ISBN: 978-3-319-39961-4
eBook Packages: Biomedical and Life SciencesBiomedical and Life Sciences (R0)