
Abstract
In the past, Kienböck’s disease (lunatomalacia, osteonecrosis, or aseptic necrosis of the lunate) was diagnosed exclusively by plain radiography. New capabilities of computed tomography (CT) and magnetic resonance imaging (MRI) have improved image quality due to both spatial resolution and contrast resolution with the use of gadolinium in MRI. At the same time, knowledge in pathology (altered biomechanical load of the wrist, disturbed bone metabolism, and reparative mechanisms of the osteonecrotic bone) has increased. Consequently, early diagnosis and classification of Kienböck’s disease are now significantly influenced by the use of CT and MR imaging. High-resolution CT is used for evaluating the osseous microstructure of the lunate, whereas contrast-enhanced MRI is perfectly suited for assessing the viability of the bone marrow. When synoptically considering the pathoanatomic processes and high-resolution imaging, the Kienböck’s disease process can be visualized in all its stages, beginning with its precursors and initial reaction of the lunate, proceeding with osteosclerotic and collapsing changes and finally terminating in perilunate osteoarthritis. CT and MR imaging also allows the clinician to consider the differential diagnosis, the lunate viability and secondary changes following surgery. Advanced imaging methods should focus on early stages with respect to best treatment options. In this chapter, the imaging capabilities of CT and MRI in Kienböck’s disease are summarized and correlated with the underlying pathology.
Access provided by Autonomous University of Puebla. Download chapter PDF
Keywords
- Bone marrow
- Classification
- Computed tomography
- Histopathology
- Kienböck’s disease
- Lunate
- Magnetic resonance imaging
- Osteonecrosis
- Perfusion
- Radiography
- Wrist
Pathoanatomic Fundamentals of Imaging
To enhance the basic understanding of the imaging findings, we have briefly summarized the multifactorial etiology and underlying mechanisms of pathology in Kienböck’s disease [1].
Etiology
The etiology of Kienböck’s disease remains controversial, and there remains no evidence-based explanation. The pathogenesis of Kienböck’s disease can’t be attributed to a single cause. It seems more likely that a combination of at-risk factors, trigger mechanisms, and modulating factors are required for the initiation and development of the disease [2, 3]. Many hypotheses have been suggested, with vascular, mechanical (extrinsic and intrinsic), and metabolic factors being the most probable factors:
-
Anatomically, there is a unique vascularization pattern of the lunate, characterized by a retrograde intraosseous vascularization [4]. Vessels branching from the radial and anterior interosseous arteries enter the lunate via the dorsal pole. Branches of the radial, ulnar, and anterior interosseous arteries, as well as branches from the recurrent deep palmar arch reach the palmar pole of the lunate. The normal nutrient intraosseous vessels are in different configurations, including a Y-shaped (59 %), I-shaped (31 %), or X-shaped (10 %). The vessel density is continuously decreasing from their distal entry sites, to the proximal lunate, which is supplied by only the terminal vessels. The proximal lunate subchondral bone is supplied by only the terminal vessels and is considered the “terminal zone of vascularization” with an increased risk of ischemia if small intraosseous arteries are interrupted by trauma or thromboembolism [4, 5]. A single palmar vessel exists in 7 % of lunates, which theoretically carries a greater risk for avascular necrosis in a traumatic event [6]. Pathoanatomically, the lunate “at risk” is defined either by either a single vessel or by a limited intraosseous collateral network of vessels [3].
-
Obviously, carpal injuries play an important role in the onset of Kienböck’s disease [7]. Sprains, contusions, and subluxations may lead not only to ligamentous lesions, but also to occlusions of the nutrient vessels to the lunate. Since the dominant hand of males in manual jobs is predominantly affected, chronic repetitive traumas have been thought to be responsible for vascular occlusions, mainly by thrombosis of the intraosseous arteries. Acute injuries of the lunate—mainly impaction or avulsion fractures—can also trigger Kienböck’s disease; however, the fracture theory is controversial, as lunate fractures often appear secondarily in the natural course of osteonecrosis. Finally, compromised venous drainage should be mentioned as a possible cause of Kienböck’s disease, because increased intra-osseous pressure has been documented, particularly in extended wrists [8].
-
Among mechanical risk factors , the short ulna is thought to be the most important contributing for the development of osteonecrosis of the lunate [9]. In negative ulnar variance, which is observed in about 78 % of patients suffering from Kienböck’s disease, axial force transmission along the radius-lunate-capitate column is focused onto the radial portion of the lunate, creating an uneven high internal load, whereas the ulnolunate compartment is unloaded. These focal intraosseous strains are considered as the main reason for the preferential manifestation of Kienböck’s disease on the radial aspect of the lunate [10]. Furthermore, negative ulnar variance may be associated with a triangular shape of the lunate [11]. However, the causative factor of negative ulnar variance in Kienböck’s disease is questioned nowadays [12, 13]. Other mechanical features predisposing to osteonecrosis include decreased radial inclination, a reduced radiolunate contact area [14], the spherical shape of the lunate characterized by large proximal and small distal surfaces, the triangular or square geometry of the lunate [11], and finally the particular architecture of the trabeculae which make the lunate susceptible to fractures under axial load [11, 15].
-
In addition, Kienböck’s disease has been reported as an infrequent association with neural, metabolic, and endocrine conditions.
Pathology
Pathoanatomically, Kienböck’s disease is not merely a nonreactive, nonviable tissue (“dead bone”), but a dynamic, viable remodeling process of the bone and bone marrow, as has been confirmed in animal experiments [16–18]:
Following the influence of traumatic triggers and modulators on the lunate, cellular repair, and revascularization mechanisms immediately arise from the maintained viable bone marrow [17–20]. As necrotic areas appear, small vessels invade from the periphery of the adjacent living bone. New vessels as well as fibrovascular tissue develop within a hyperemic repair zone, which is interposed between the proximal necrotic (nonviable) tissue and the normal (viable) bone marrow on its distal aspect. This new angiogenetic activity leads to osteoclastic resorption of necrotic bone and laying down of osteoblastic new bone.
The osteonecrotic history of Kienböck’s disease can be subdivided into four pathoanatomical phases [19, 20]:
-
Phase of edema: Any form of ischemia within the lunate induces intercellular edema of the bone marrow with their cells being compromised by an increased water content. Medullary fat cells survive ischemia for only 2–5 days.
-
Phase of cellular necrosis: After this period, the medullary cells within the lunate die.
-
Phase of repair: The regenerative processes are initiated already in the phases of edema and necrosis. The first repair mechanism is neogenesis of fibrous and vascular tissues with the presence of fibroblasts and the formation of new vessels. The lunate must be at least partially vascularized for initializing the repair and revascularization processes. Then, the remaining vessels vasodilate and viable bone becomes hyperperfused.
-
Phase of bone remodeling: Finally, the remaining bone, as well as the rebuilt fibrovascular tissue undergo a remodeling processes. During this phase the osteoblasts and osteoclasts are intensively activated. On histology, areas of osteonecrosis alternate with areas of new bone formation.
By definition, potentially reversible ischemia must be differentiated from irreversible necrosis of the bone marrow. Ischemia is a hypoxic condition of the tissues caused by problems with blood vessels, and characterized by insufficient oxygen and nutrition supply needed for cellular metabolism. Dysfunction of tissue and damage can be the consequences. Ischemic tissue can develop in a reversible manner, if restricted perfusion is eliminated by the onset of repairing mechanisms. Necrosis is characterized by severe cell injury and cell death after vascular and tissue repairing has failed [21]. Without intervention, external ischemia may progress to necrosis of the bone marrow and bone substance. In contrast to ischemia, necrotic tissue is definitely irreversible with regard to “ad integrum” healing.
Three different zones can be differentiated in histopathology as well as in contrast-enhanced MRI [19, 22, 23]:
-
Zone of necrosis: The site of the most intense and frequent osteonecrosis is at the proximal-radial circumference of the lunate. Pathoanatomically, this area is the terminal zone of vascular supply. When reparative vascularization has failed, bone conversion leads to dense osteosclerosis due to an imbalance of osteoblasts with residual activity and insufficient osteoclasts. Osteonecrotic tissue is identified by vacuoles free of osteocytes, sparse osteoid, removal of debris leading to osseous cavities, and comminuted fractures. The articular cartilage of the lunate remains intact for a long time, but is usually damaged in advanced Kienböck’s stages [24].
-
Zone of repair: Microscopic analysis of specimens reveals fibroconnective tissue and shards of bone trabeculae both being suggestive of an ischemic condition. Fibrovascular reparation tissue is found in the middle layer of the lunate, which is characterized by hyperemia, cellular infiltration, granulation tissue, and also by phagocytosis, removal processes, decalcification, and pathologic fractures. In the zone of repair, which resembles a space of osseous nonunion, osteonecrotic foci are alternating with areas of viable bone and new bone formation. There is an attempt to balance the resorption of necrotic bone and the formation of new bone.
-
Zone of viability: The distal aspects of the lunate, particularly the palmar and dorsal poles, preserve viable bone marrow and bone tissue the longest. Specimens of viable bone have abundant osteoid and osteocytes. The distal aspect of the lunate becomes necrotic in only the advanced stages of Kienböck’s disease.
On principle, the new developed repair tissue can take quite different courses with respect to bone viability:
-
At its best, the fibrovascular repair tissue is subsequently transformed into fibrous bone tissue, and later into normal lamellar bone. This positive outcome results in a “restitution ad integrum” recovery of Kienböck’s disease, and is most often seen in children and adolescents [25, 26], but also in adults under best treatment conditions.
-
For reasons not really understood, fibrovascular repair tissue is often not transformed into fibrous and lamellar bone. This progressive event follows a unidirectional course with a “point of no return” pattern that is not clearly determinable in development of osteonecrosis. The final stage is characterized by necrotic (nonviable) bone, osteosclerosis, and formation of sequestra. It is assumed that an increase in vascularization (hyperemia) produces a focal demineralization in the repair zone [27], and this focal osteopenia induces a pathologic fracture of the lunate. The fracture is usually on the proximal aspect or alternatively can be a coronal fracture. Theoretically, a fracture can be the primary event, although this in not thought to be common.
-
Fractures of the necrotic lunate lead to a loss of height of the lunate, and a synchronous proximal migration of the capitate and consequently a loss of height of the proximal carpal row. The final stage is characterized by progressive radiocarpal and midcarpal osteoarthritis (Kienböck’s disease advanced collapse), which usually occurs within 5 years, if the wrist is left untreated. Reactive synovitis may be associated.
Imaging in Kienböck’s Disease
The treatment decision in Kienböck’s disease is mainly based on four parameters: (1) the stage of the disease, (2) the ulnar variance, (3) the presence of carpal osteoarthritis, and (4) the patient’s age. By defining the first three parameters, imaging basically constitutes the main decisive components in the therapeutic concepts of Kienböck’s disease. The diagnostic capabilities of CT and MR imaging are emphasized in this text, whereas conventional radiography is only briefly mentioned, because it is covered in another chapter of this book (see Chapter 10).
Conventional Radiography
True dorso-palmar and true lateral X-ray views are basic imaging tools for assessment of wrist pathology. In most cases of Kienböck’s disease (particularly the advanced stages), the diagnosis is made on plain X-rays [7, 28]. But, early in the course of the disease, radiographs may actually be normal. Although being inferior to CT and MRI, X-rays are useful for grading Kienböck’s disease and for distinguishing it from other pathologic conditions of the lunate, i.e. the ulnolunate impaction syndrome, intra-osseous ganglion cysts, post-traumatic conditions, lunotriquetral coalitions, and others.
The position of the distal ulna in relation to the distal radial surface changes with varying degrees of forearm rotation. Therefore, it is essential that the dorso-palmar is obtained with the true neutral position, to allow for an exact measurement of the degree of ulnar variance [10, 29].
Computed Tomography (CT)
The introduction of multi-slice (multidetector) spiral CT has fundamentally improved the capabilities of imaging the osseous anatomy. High-resolution CT is a very powerful tool in evaluating the osseous microstructure of the lunate and the perilunar joints in Kienböck’s disease [22, 30].
Acquisition and Post-processing Techniques in CT Imaging
High-resolution techniques of both acquisition and reconstruction are recommended for CT imaging of the lunate (Fig. 11.1):

Acquisition technique of carpal computed tomography (CT). (a) Positioning for transaxial CT imaging. The patient is standing beside the CT gantry, and the pronated forearm and hand are placed flat and in longitudinal direction on the gantry table. (b) Planning of coronal and sagittal MPR (multiplanar reconstruction) on this transaxial image. The coronal MPR images are planned on the transaxial image with a tangent drawn on the palmar aspect of the scaphoid and pisiform (yellow line). Sagittal MPR images (blue line) are then perpendicular to the yellow line. (c) The coronal MPR plane is parallel to the colinear radius-lunate-capitate axis (yellow line)
-
First, a volumetric data-set is acquired (voltage 120 kV, current 100 mA, field of view 60 mm, slice thickness 0.5 or 0.6 mm, pitch factor 0.9).
-
In the post-processing procedure, transaxial, overlapping source images are reconstructed (slice thickness 0.5 or 0.6 mm, increment 70 %, high-resolution bone kernel)
Sagittal and coronal images are reconstructed (slice thickness 0.5 or 0.6 mm, increment 100 %, high-resolution bone kernel). It must be emphasized that thin slices (0.5–1.0 mm) and overlapping increment are important prerequisites for multiplanar reconstructed (MPR) images. For these reasons CT imaging is superior to X-rays in assessing the fine osseous morphology [23, 30].
Findings in CT Imaging
Sagittal and coronal MPR images are best for assessing the proximal circumference of the lunate. These MPR images are high-resolution and without any out-of-field and streaking artifacts (these artifacts are often seen in images which have been acquired with primary scans in the sagittal or coronal plane).
-
Evidence of stage II: Due to the better resolution, CT imaging is able to display mild osteosclerosis of the cancellous bone and pseudo-cystoid inclusions better than plain radiographs (Fig. 11.2). Therefore, stage II of Kienböck’s disease is discernible earlier and with more precision in CT imaging.
Fig. 11.2 
Plain radiology and CT scan of a 49-year-old female with wrist pain for 3 months. (a, b) Dorsopalmar and lateral radiographs demonstrate osteosclerosis and flattening of the proximal lunate. This would be defined as a Lichtman stage II. (c, d) Coronal and sagittal MPR (1-mm slices) demonstrate cystic inclusions, and osteosclerosis is better visualized due to the superior resolution. Additionally, an impacted fracture of the proximal lunate is identified, which would re-define to a Lichtman’s stage IIIa
-
Evidence of stage IIIa: CT imaging is useful to demonstrate fracture or fragmentation of the lunate. The early phase of stage IIIa is characterized by subtle linear fracture lines and small zones of impacted fragments at the proximal-radial circumference of the lunate. These findings can often be occult with plain radiography. Discrete fractures and impaction at the proximal circumference are reliably detected with high-resolution technique (Fig. 11.3). Osteosclerosis and lunate collapse may be the consequence of revascularization [18, 27]. However, it is not clear whether a fracture seen in advanced stages is the primary cause of Kienböck’s disease or occurs later in the natural history as the result of revascularization, bone resorption, and structural weakness. Furthermore, CT imaging allows proper visualization of the coronal fracture, which can be overlooked with MRI, particularly when the signal height of the lunate is heavily compromised in the fracture area [23]. Coronal fractures are comprehensively depicted in sagittal MPR images. Evidence of proximal and/or sagittal fractures definitely confirms stage IIIa of Kienböck’s disease. Carpal instability in Kienböck’s disease (stage IIIb) does not constitute an indication for CT imaging, as instability criteria are sufficiently confirmed with the use of radiographs (Youm’s index, radioscaphoid angle) for differentiating stages IIIa and IIIb [31–33].
Fig. 11.3 
CT imaging for visualizing fracture lines in stage IIIa of Kienböck’s disease. Patient is a 57-year-old male with painful wrist and reduced range of motion. (a, b) Dorsopalmar and lateral radiographs demonstrate a sclerotic lunate, but fracture lines are not clearly identified. (c, d) Coronal and sagittal MPR CT images (1-mm slices) reveal an oblique lunate fracture and dense osteosclerosis. An impacted fragment causes straightening of the proximal lunate
-
Evidence of stage IV: Initial stages of perilunar osteoarthritis are reliably detected with CT imaging demonstrating small osteophytes, subchondral osteosclerosis, cysts, and asymmetry of the radiocarpal and midcarpal joint spaces (Fig. 11.4). Thus, a CT exam should be ordered in suspected stage IIIb of Kienböck’s disease when osteoarthritis (stage IV) must be ruled out in surgical treatment planning [23]. However, the CT exam is not required in advanced cases when osteoarthritis is clearly visible on plain radiographs.
Fig. 11.4 
CT imaging for demonstrating osteoarthritis in stage IV of Kienböck’s disease. Patient is a 57-year-old male with progressive wrist pain over the last 3 months, who now has a marked restriction in his range of motion. (a, b) Dorsopalmar and lateral radiographs demonstrate an osteosclerotic and fractured lunate, with loss of carpal height. Osteoarthritis of the distal radioulnar joint is a secondary finding. (c, d) Coronal and sagittal CT MPR images demonstrate advanced chondropathia of the palmar aspect of the radiolunate joint. The lunate is coronally fractured and osteosclerotic. Note: The visual impression of these MPR images is different from Figs. 11.1 and 11.2, because a slice thickness of 2 mm has been used in post-processing


In conclusion, CT identifies the advanced stages of Kienböck’s disease more precisely than plain radiography and MRI. If osteonecrosis has already been diagnosed with another imaging procedure (i.e. X-ray, MRI), CT should also be performed to determine the exact disease stage according to the osseous morphologic criteria. Thus, CT imaging should be an inherent part of the diagnostic work-up in Kienböck’s disease.
Magnetic Resonance Imaging (MRI)
Magnetic resonance imaging (MRI) is used for imaging of the lunate bone marrow and for determining its viability in Kienböck’s disease [16, 17, 22, 23, 34, 35].
Acquisition Techniques in MRI
High-resolution MRI sequences must be applied to sufficiently visualize the bone marrow of the lunate. We recommend the following parameters [23]:
-
The 1.5 or 3.0 T MRI scanner is required. The low- and midfield scanners (0.2–1.0 T) have a lower field strength, which do not provide adequate spatial and contrast resolution due to the poor signal-to-noise ratios (SNR) and contrast-to-noise ratios (CNR).
-
The application of a multichannel, phased-array wrist coil has become standard in MRI of the extremities (Fig. 11.5). The phased-array coils have the advantage of “parallel imaging technology,” which significantly expands the possibilities of MRI techniques by acquiring either high-resolution images in the same time or by producing the images with a reduced acquisition time. Of course, the high-resolution MRI of the wrist is favorable in Kienböck’s disease.
Fig. 11.5 
Acquisition technique of wrist MR imaging. (a) In-center positioning of the wrist. The patient is lying on the MRI table in the “superman position” (i.e., lying prone, with the arm overhead and the hand pronated). The hand is placed in a 16-channel, phased-array coil dedicated for high-resolution wrist and hand MRI. (b, c) Coronal and sagittal localizers (scouts) for planning a coronal acquisition volume (“slab”) of 8 cm × 8 cm in-plane size. Active coil elements are displayed on the right side. Saturation pulses are placed proximal and distal to the acquisition volume to minimize vascular flow artifacts as well as fold-over artifacts. Arrows indicate the phase encoding direction
-
The optimal geometric scan parameters for wrist MRI are: Field of view 80 mm, slice thickness 2 mm without gap (interleaved acquisition order) when acquiring 2D sequences, and slice thickness 0.5 mm in acquisition of 3D sequences.
-
The sequences should be acquired in all three orthogonal planes, with the coronal and sagittal being most important in Kienböck’s disease.
-
Acquisition of these sequence types is recommended:
-
PD-weighted FSE with fat-saturation (coronal plane)
-
PD-weighted FSE with fat-saturation (transaxial plane).
-
T1-weighted FSE nonenhanced (coronal plane)
-
T1-weighted FSE with fat-saturation after intravenous gadolinium (coronal plane)
-
T1-weighted FSE with fat-saturation after intravenous gadolinium (sagittal plane).
-

MRI of the Normal Bone
With regard to the signal height in MRI, bone can be subdivided into two compartments [36]:
-
The calcified bone compartment comprises the compact bone of the peripheral cortex and the central cancellous (trabecular) bone, which serves as architectural framework for bone marrow. The calcified bone substance which is mainly composed of the osteoid matrix and calcium phosphate complexes does not provide any signal with MRI, and has therefore a low (“dark”) signal intensity on both T1 and T2-weighted sequence types.
-
The medullary bone compartment is composed of the bone marrow and is embedded between the trabecular (cancellous) bone. The bone marrow consists of red (hematopoietic) and yellow (fatty, adipose) cells that are dispersed through the trabecular bone framework. The percentage of yellow marrow increases with age. MRI provides direct assessment of the hematopoietic and fatty marrow of cancellous bone. The yellow marrow has a similar MRI signal to subcutaneous fat—high on T1 and intermediate on T2-weighted images. Red marrow has lower signal intensity than yellow marrow on T1-weighted images. In the normal bone marrow, the high intensity MRI signal is due to the predominance of the medullary fat cells.
-
The perfusion state of the bone marrow can be assessed with tissue-dependent relaxation times. In studies correlating MRI and pathohistologic findings of the bone, a close relationship has been found between the MRI signal heights of the calcified bone substance and the bone marrow [20]. Thus, any changes in the signal intensity of the bone marrow indirectly indicate an underlying pathology or disturbance of the bone metabolism. This phenomenon is one of the basic assumptions in reading MRI of Kienböck’s disease.
MRI in Kienböck’s Disease
MRI is able to distinguish areas of viable and nonviable bone within the lunate. The capability of MRI in identifying osteonecrosis is based on the physical principle that magnetic relaxivity of the bone marrow is changed in ischemic, reparative as well as in necrotic tissue areas, allowing the differentiation of different states of bone viability [16, 17, 20, 23, 34, 36]:
-
Phase 1—Ischemia: Ischemia leads to edema of the bone marrow. In the initial stage, signal intensity of the fatty bone marrow is increased in T2-weighted, fat-saturated sequences, and slightly decreased in T1-weighted sequences. Depending on the degree of the ischemic process, signal changes are either limited to the proximal circumference or extended throughout the entire lunate.
-
Phase 2—Necrosis: The ischemic medullary fat cells survive for 2–5 days. After this time the medullary signal intensity decreases in T1- and T2-weighted images, to create hypointense signal height.
-
Phase 3—Repair: The reparative process with mesenchymal neogenesis of fibrovascular repair tissue begins soon after onset of compromised vascular perfusion. This produces a further signal reduction in both T1- and T2-weighted sequences.
-
Phase 4—Remodeling; Activated osteoblasts induce remodeling and osteosclerosis of the trabecular bone and thereby induce a further decrease of the signal intensity in T1- and T2-weighted sequences. Additionally, signal loss is generated by fragments at the proximal circumference of the lunate.
In the literature, two different MRI approaches have been reported for assessing the viability of the bone marrow: The traditional approach utilized standard MRI. The new approach utilizes intravenous gadolinium enhancement which creates a high intensity signal in the vascularized tissue.
Unenhanced MRI
In traditional MRI [16, 17, 20, 34, 35], viability of the bone marrow is assumed in the presence of high-signal intensity in plain (unenhanced) T1- and T2-weighted sequences (Fig. 11.6). Viable bone marrow is also assumed in the presence of bone marrow edema, which presents with high signal intensity in fat-suppressed T2-weighted images. The underlying theory is that bone marrow edema can develop if the vascular supply is either unaffected or moderately compromised, only [17]. In contrast, nonviable bone marrow is assessed in unenhanced MRI by means of hypointense areas both in T1 and T2-weighted sequences indicating loss of the fatty marrow as well as the absence of any vascularity. Two degrees of signal defect can be differentiated on MRI [34, 35]: Focal signal loss on the radial half of the lunate on T1-weighted images as well as normal or increased signal height on T2-weighted images suggests early ischemic involvement and a better prognosis, whereas generalized signal loss in T1 and T2-weighted images on the entire lunate is diagnostic for advanced osteonecrosis of the lunate.

Schematic diagram of bone marrow viability in unenhanced (traditional) MRI. In the traditional MRI approach, normal, ischemic, and necrotic bone marrow is differentiated by means of plain T2- and T1-weighted FSE sequences. The lunate is shown in lateral views. (a) Normal bone marrow (viability unaffected). The signal height is homogeneously dark in fat-saturated T2-w FSE, and homogeneously bright in T1-w FSE. (b) Ischemic bone marrow (viability maintained). Mainly due to bone-marrow edema, the proximal pole of the lunate is hyperintense in fat-saturated T2-w FSE, and hypointense in T1-w FSE. Bone-marrow edema is regarded as an indirect sign of persistent perfusion in unenhanced MRI. (c) Necrotic bone marrow (viability lost). There is no bone-marrow present in fat-saturated T2-w FSE at the proximal circumference which is marked hypointense in T1-w FSE. In plain MRI, necrosis is characterized by the absence of both bone-marrow edema (T2-w) and fatty bone marrow (T1-w)
Although proved only in scaphoid nonunion and not in Kienböck’s disease, the concept of unenhanced MRI is limited in assessing osteonecrotic bone for several reasons [37, 38]. Firstly, unenhanced MRI uses the combination of T1- and T2-weighted sequences for determining bone-marrow viability, with the presumption that viability is maintained in the presence of bone-marrow edema. However, differentiation of intercellular (reversible) edema and intracellular (irreversible, cytotoxic) edema is not possible with T2-weighted sequences. Signal height on T2-weighted sequences does not allow the differentiation of necrotic, reparative, and normal bone marrow [37]. For this reason, high-signal areas in T2-weighted images are seen in viable as well as in nonviable bone marrow [38]. Secondly, the necrotic zone cannot be reliably discerned from the neighbored repair zone, because these zones can have the same signal intensity on both T1- and T2-weighted sequences. Low-signal-intensity areas on unenhanced T1-weighted images do not closely correlate with the extent of the necrotic areas and may oversize the necrotic area. Thus, with unenhanced T1-weighted images, the true osteonecrotic area will be overestimated, as the repair zone also appears to be necrotic [19]. Thirdly, the unenhanced MRI does not assess the repair zone which is considered essential in the pathoanatomy of osteonecrosis.
Gadolinium-Enhanced MRI
In MRI, the perfusion state of the bone marrow can be assessed with tissue-dependent relaxation times and the effect of intravenous gadolinium [22, 37]. If there is significant contrast enhancement in the bone marrow, the T1 relaxation time is shortened by the influence of the paramagnetic gadolinium resulting in increased signal intensity in fat-saturated T1-weighted sequences.
By applying the intravenous contrast agent, a new concept was developed for assessing bone-marrow viability [22, 37]. The following section reviews the role of contrast-enhanced MRI (ceMRI) in the assessment of the pathoanatomic course of Kienböck’s. This includes the three-layered zones, seen at the time of repair of the necrotic proximal lunate (Fig. 11.7).

Schematic diagram of bone-marrow viability in gadolinium-enhanced MRI. In the contrast-enhanced MRI approach, normal, ischemic, partially necrotic, and completely necrotic bone marrow is differentiated by means of contrast enhancement in fat-saturated T1-weighted FSE sequences independent of the presence of bone-marrow edema in T2-weighted FSE sequences. The lunate is shown in lateral views. (a) Normal bone marrow (viability is unaffected). The signal height is homogeneously dark in fat-saturated T2-w FSE, and homogeneously bright in T1-w FSE. No contrast-enhancement within a homogeneously dark lunate is characteristic in fat-saturated T1-w FSE after intravenous gadolinium. (b) Ischemic bone marrow (viability is maintained, MRI pattern A). The proximal pole of the lunate is hyperintense in fat-saturated T2-w FSE, and hypointense in T1-w FSE due to bone-marrow edema. In fat-saturated T1-w FSE, there is a homogeneous gadolinium enhancement pattern of the entire proximal zone directly indicating maintained perfusion. (c) Partially necrotic bone marrow (viability is partially lost, MRI pattern B). The proximal pole of the lunate is hyperintense in fat-saturated T2-w FSE, and hypointense in T1-w FSE. Both necrotic and repairing zones are present. Differentiation is possible only on the basis of gadolinium enhancement: The repairing zone is marked by an intense enhancement, which characteristically is missing in the necrotic zone. (d) Completely necrotic bone marrow (viability is completely lost, MRI pattern C). Independent of present or missing bone-marrow edema in fat-saturated T2-w FSE, no enhancement is seen at all in fat-saturated T1-w FSE after gadolinium when compared to plain T1-w FSE
Viable Bone Marrow
The bone marrow is viable in the following cases; normal bone marrow, ischemic bone marrow when it is initially compromised, (before necrosis) and reparative vascularized bone marrow. In ceMRI, areas of hyperenhancement are characteristic of reparative mechanisms in Kienböck’s disease.
Normal bone marrow: In normal bone marrow, the yellow fat cells are exclusively responsible for the high signal in both T1- and T2-weighted images. An increased signal height is characteristic of the viable bone marrow displaying the bone marrow “white” in both unenhanced sequence types, and “dark” in fat-saturated sequences. With ceMRI, there is no contrast enhancement in the normal (unaffected) bone marrow.
Repair tissue: Viable bone tissue is also present in fibrovascular repair tissue which is located in the transition area between the necrotic zone and the zone of viable bone. The reparative area is characterized by the invasion of leucocytes, fibroblasts, and new vessels. The inflammation-like processes and the marked hyperemia, produce hyperenhancement in T1-weighted FSE sequences after 3–5 min following gadolinium injection [22, 37]. Its viability is measured by rating the degree of contrast-enhancement. Time-resolved, fast 2D- or 3D-GRE sequences can be applied for calculating a time-signal diagram over an interval of about 5 min (Fig. 11.8). These diagrams allow quantitative analysis of the local perfusion pattern and also the prognosis of the altered bone marrow in follow-up studies. However, the benefit of time-resolved enhanced MRI has recently been questioned, at least in assessing the bone-marrow viability in scaphoid nonunion [39].

Dynamic perfusion MRI in stage IIIb of Kienböck’s disease in the follow-up after free-vascularized osteochondral bone grafting. Patient is a 30-year-old female with advanced Kienböck’s disease following vascularized bone grafting of the diseased lunate. (a, b) Dorsopalmar radiograph and MRI perfusion study (coronal 3D fast GRE sequence every 20 s after gadolinium injection) 4 months after grafting and hardware removal in the meantime. Contrast enhancement is inhomogeneous and increased at the ulnar side of the lunate where the vascular bundle inserts. (c) Perfusion study 9 months after grafting (same dynamic MRI sequence). Contrast enhancement has become more homogeneous. Later, a dorsal osteophyte was removed, and the lunate healed with moderate proximal deformity
Nonviable Bone Marrow
As stated above, the unenhanced T1-weighted images, may over-interpret the zone of bone marrow necrosis, as the zone of repair will also have a low signal intensity [19]. Following gadolinium, the repair zone will be enhanced and the nonperfused necrotic zone will still have a low signal intensity [23, 37].
Possible signal changes and patterns of contrast enhancement in Kienböck’s disease are summarized in Table 11.1.
Three-Layered Anatomy
By determining bone marrow viability with the use of ceMRI, three geographic zones are discernable in the lunate [22, 23]:
-
In the proximal zone, osteonecrosis is characterized by decreased signal height in T1-weighted sequences, and no hyperenhancement pattern after application of gadolinium.
-
In the middle zone, fibrovascular repair tissue is visualized by means of an intensive hyperenhancement in T1-weighted fat-suppressed sequences after application of gadolinium—independent of the presence of a bone-marrow edema.
-
The distal zone is displayed with normal signal heights of the unaffected bone marrow.
Accompanying joint effusions and a synovial thickening showing marked contrast enhancement are mostly seen in advanced MRI stages of Kienböck’s disease. Characteristically, the radiolunate compartment is spared from osteoarthritis over a long period of time in the natural course.
Viability Patterns in ceMRI
In Kienböck’s disease, the degree of contrast enhancement in the endangered proximal segment constitutes the most relevant prognostic parameter [22, 23]. In close correlation to histopathological findings, three patterns of contrast enhancement of the lunate can be differentiated with plain (unenhanced) and enhanced T1-weighted MRI sequences (Table 11.2):
-
MRI pattern A: There is homogeneous , intense, and territorial enhancement after gadolinium at the proximal circumference or entire lunate (Fig. 11.9). The pathology is bone marrow edema with intact osteocyte function, maintained or reorganized perfusion of the bone marrow, and a normal bone structure.
Fig. 11.9 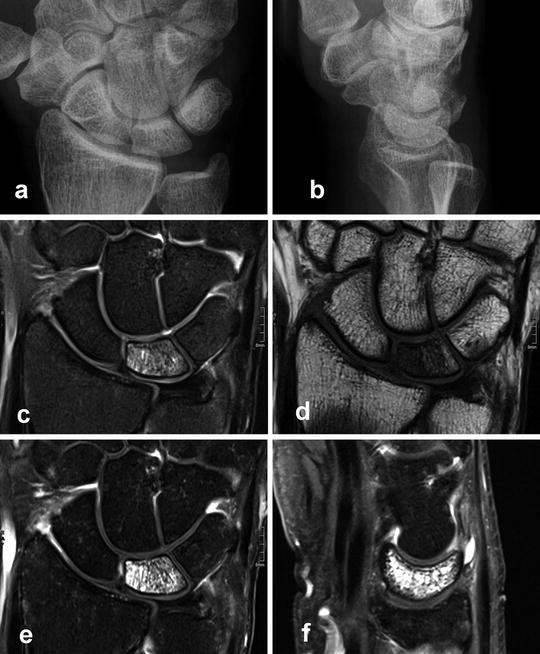
Ischemic lunate (MRI pattern A) in stage I of Kienböck’s disease. Viability is maintained in edematous bone marrow of the lunate. 34-year-old male suffering from spontaneous onset of pain without previous wrist injury or overuse. (a, b) Dorsopalmar and lateral radiographs are normal and not suspicious of Kienböck’s disease. Negative ulnar variance. (c) Territorial bone-marrow edema in the entire lunate (coronal PD-w FSE fat-saturated). (d) The radial and central parts of the lunate are of inhomogenously low signal (coronal T1-w FSE). (e, f) With intravenous gadolinium there is an intense enhancement within the lunate (coronal and sagittal T1-w FSE fat-saturated after gadolinium)
-
MRI pattern B: An inhomogeneous contrast enhancement pattern is characteristic with three different zones of perfusion, (i.e. proximal necrosis, middle reparative, and distal normal). The pathology is localized at the proximal lunate osteonecrosis with no vascular perfusion. Therefore there is no enhancement of the nonviable bone (Fig. 11.10). The middle reparative zone has dense cell proliferation and is hypervascular, therefore has marked contrast enhancement (“hyperenhanced” zone). The distal aspect of the lunate—particularly the dorsal and palmar poles—have normal signal height in unenhanced and enhanced MRI due to normal bone marrow, enhancement with contrast is not seen.
Fig. 11.10 
Partial lunate necrosis (MRI pattern B) in stage IIIb of Kienböck’s disease. Patient is a 56-year-old male with a painful swollen wrist. Both necrotic and repair zones are located side by side. (a, b) In dorsopalmar and lateral radiographs, the lunate is diffuse osteosclerotic and flattened at its proximal circumference. (c) The hypointense proximal zone of the lunate is evident, while there is marked bone-marrow edema in the middle and distal parts (coronal PD-w FSE fat-saturated). Type II lunate with degeneration at the lunohamate joint. (d) In the T1-weighted sequence, the lunate is inhomogenously hypointense in its whole territory (coronal T1-w FSE). (e, f) With intravenous gadolinium, the proximal circumference of the lunate remains hypointense, whereas the middle part shows marked hyperenhancement, and the distal poles only have low hyperenhancement (coronal and sagittal T1-w FSE fat-saturated after intravenous gadolinium). Adjacent synovitis is remarkable
-
MRI pattern C: Generalized signal loss in T1-weighted sequences is seen in advanced necrosis cases with typically no contrast enhancement at all. Interestingly, bone-marrow edema can be found infrequently despite the absence of perfusion and contrast enhancement (Fig. 11.11). In most cases of advanced Kienböck’s disease however, there is also a signal loss in T2-weighted sequences (Fig. 11.12). Irreversible osteonecrosis of MRI pattern C is either focally limited to the proximal circumference or territorially extended to the entire lunate. Complete osteonecrosis (“dead bone”) is present without any repairing areas. Histopathological slices are characterized by empty osteocyte vacuoles, territorial removal of debris, formation of bone cavities, and comminute fracture zones. The nonviable lunate has a poor prognosis, of course.
Fig. 11.11 
Complete lunate necrosis (MRI pattern C) in stage IIIc of Kienböck’s disease. Patient is a 51-year-old male with a painful wrist and reduced range of motion as a result of a crushing injury of the hand 5 years before. Necrosis is manifest in the fractured lunate in the presence of bone-marrow edema. (a, b) Dorsopalmar and lateral radiographs show minor osteosclerosis and negative ulnar variance. (c) Patchy bone-marrow edema in the center of the lunate (coronal PD-w FSE fat-saturated). (d) The lunate, which is slightly changed in shape, is of inhomogeneous low signal (coronal T1-w FSE). (e, f) No hyperenhancement is present within the lunate, suggesting complete necrosis. The dorsal pole is fractured and displaced (coronal and sagittal T1-w FSE fat-saturated after intravenous gadolinium). Note diffuse carpal synovitis
Fig. 11.12 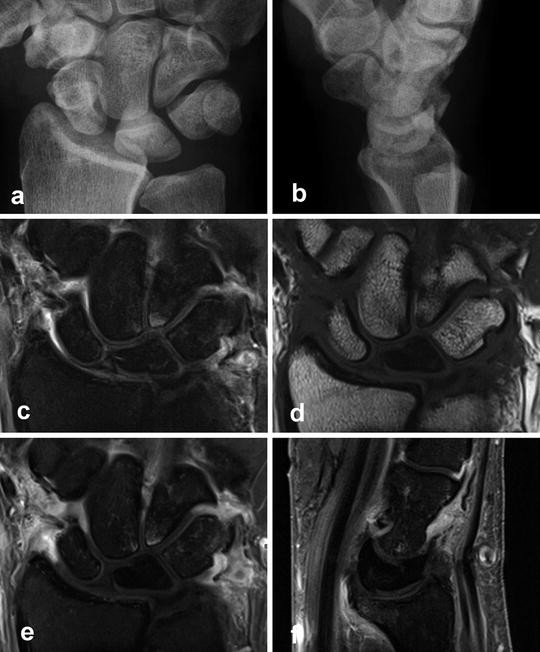
Complete lunate necrosis (MRI pattern C) in stage IIIc of Kienböck’s disease. Patient is a 52-year-old male who has been suffering from severe wrist pain for 2 years. Necrosis is manifest in the absence of bone-marrow edema. (a, b) Dorsopalmar and lateral radiographs show slight lunate osteosclerosis. There is a negative ulnar variance and suspicion of a dorsal pole fracture. (c) The lunate is without any evidence of bone-marrow edema. The proximal pole is flattened, and horizontal fracture lines can be assumed. Hyperintense degenerative changes at the proximal poles of the hamate and capitate (coronal PD-w FSE fat-saturated). (d) On this T1-weighted image, the lunate has no signal, demonstrating there is no medullary fat (coronal T1-w FSE). (e, f) There is no hyperenhancement following gadolinium. The lunate is coronal fractured in the center and also at the proximal circumference. Marked synovitis is present (coronal and sagittal T1-w FSE fat-saturated after intravenous gadolinium)


In advanced stages of Kienböck’s disease, synovitis is present around the lunate in ceMRI.
Classification Systems
The classic staging system of Kienböck’s disease was introduced on the base of X-ray findings [7, 28]. Later, the X-ray-based classification has been modified several times with inserting imaging aspects of MRI and carpal biomechanics. Firstly, bone marrow edema identified on MRI [40]. Secondly, the subcategories of the stable and instable wrist were included, depending upon the radioscaphoid angle (RSA) [41]. The RSA is less than 60° in Lichtman stage IIIa, and greater than 60° in stage IIIb [32].
Thirdly, a new stage IIIc was introduced to assess the coronal fracture type of the lunate [33]. The inclusion of these different approaches led to the current osseous radiographic classification of Kienböck’s disease. Indeed, this current classification is of value for clinical use and management decisions; however, it is incomplete with respect to assessing the vascularity of the lunate.
Other than the radiographic classification , the MRI patterns in signal intensity and contrast enhancement describe functional tissue parameters, i.e., the relaxivity of the bone marrow before and after application of gadolinium. Relaxivity is the ability of magnetic compounds to increase the relaxation rates of the surrounding water proton spins. Since different physical conditions are measured (X-ray absorption versus MRI relaxivity), there is no congruence between the radiographic and MRI classifications. While projection radiography and CT depict the osseous anatomy of the lunate and the perilunate joints, ceMRI exclusively covers the bone and bone-marrow viability. The assessment modalities do not compete in the evaluation of Kienböck’s disease, but complement one another to achieve a comprehensive staging system of Kienböck’s disease.
Therefore, it is recommended to apply both the X-ray classification [40] and the MRI classification system [22] side-by-side for exactly describing the stages of Kienböck’s disease. For example, the pathoanatomic constellation of a proximal lunate fracture, with a stable wrist (RSA < 60°), and an active repair zone in the middle section of the lunate is classified in the proposed system as “Kienböck’s stage IIIa, MRI pattern B”.
There is actually the real necessity for a new and comprehensive classification system of Kienböck’s disease [33]. Such a basically revised classification system should merge the traditional and all new imaging aspects (CT and contrast-enhanced MR imaging) as well as the arthroscopic evaluation of the articular cartilage for determining the exact degree of involvement in Kienböck’s disease and for choosing appropriate treatment decisions [24].
“Teenböck’s”: Pediatric and Juvenile
The prognoses of adult and younger Kienböck’s disease are different. There is a high potential for spontaneous remodeling and revascularization in pediatric patients (up to 12 years) and juvenile patients (12 to skeleton maturity). In these patients , the condition is often self-limiting and the prognosis is considerably better, even in the advanced stages of the disease. In juvenile patients older than 16 years, this phenomenon is not as reliable as in the younger children. Unloading of the lunate is the treatment of choice [25, 26]. Usually there is bony healing of the lunate, but mostly with deformity. Temporary transfixation of the scaphotrapezoidal joint with titanium K-wires made from titanium is an ideal therapeutic option, as it allows MRI imaging and is reversible as soon as the lunate is healed [25]. Normalization of the MRI signal can be expected with the return of proximal blood flow, fat cells, and hematopoietic elements (Fig. 11.13).

Healing of juvenile Kienböck’s disease (stage I) in the follow-up after temporary STT fusion. Patient is a 14-year-old female adolescent with progressive wrist pain following a fall onto her outstretched hand 7 months before. (a–d) Pre-therapeutic baseline imaging (external MRI). Patchy osteosclerosis and bone-marrow edema of the lunate (hyperintense in T2-, hypointense in T1-weighted images) are eye-catching. (e–h) Imaging 4 months after temporary STT fusion. Osteosclerosis has advanced, but signal changes and gadolinium enhancement of the lunate are significantly improved. (i–l) Imaging 10 months after temporary STT fusion and hardware removal. Osteosclerosis has decreased, and signal changes and gadolinium enhancement of the lunate have completely normalized. Image order: Dorsopalmar radiographs in the left column, coronal PD-w FSE fat-saturated MRI in the second column, coronal T1-w FSE MRI in the third column, and sagittal plain T1-w FSE resp. T1-w FSE fat-saturated MRI after intravenous gadolinium in the fourth column
Differential Diagnoses
There is considerable variability of MRI presentation of Kienbock’s disease (Fig. 11.14). However Kienböck’s disease needs to be distinguished from other causes, particularly in the early stages, when radiographs may be negative. When interpreting MR images, one should keep in mind that only about 25 % of all signal-compromised lunates are caused by Kienböck’s avascular necrosis [42]. There is a broad spectrum of differential diagnoses that account for the remaining 75 % [27, 42]. By evaluating the clinical, biomechanical, and imaging findings, the following pseudo-Kienböck’s entities should be identified:

Collection of five different appearances of Kienböck’s disease (all in stages IIIa or IIIb). (a, b) Hypervascularized repair zone (MRI pattern A). Sagittal CT and MRI (T1-w FSE fat-saturated after intravenous gadolinium) of a 24-year-old female suffering from wrist pain over 1 year. There is extensive central osteolysis and an impacted fragment at the distal circumference. The repair zone covering most of the lunate is extensivelyFig. 11.14 (continued) vascularized. Bleeding bone marrow was found at surgery (cancellous bone grafting and temporary STT fusion). (c, d) Progressively vascularized repair zone (MRI pattern B). Preoperative and follow-up MRI (both exams with T1-w FSE fat-saturated after intravenous gadolinium) in an 18-year-old male with severe wrist pain. Extensive vascularized repair tissue and an ossified island have developed 7 months after temporary SST fusion and radial shortening (artifacts caused by the radial plate). Carpal synovitis is resolving. (e, f) Avascular repair zone (MRI pattern C). Lateral radiogram and sagittal MRI (T1-w FSE fat-saturated after intravenous gadolinium) in a 35-year-old male suffering from exertional wrist pain. Repair zones at coronal and proximal fractures are without any enhancement and thus avascular. Patchy enhancement is present in the dorsal pole of the lunate, only. (g, h) Free-vascularized osteochondral bone graft. Sagittal CT and MRI (T1-w FSE fat-saturated after intravenous gadolinium) in a 22-year-old male treated with osteochondral bone graft which is fixed with a dorsal k-wire to the remaining lunate (CT imaging 1 month after surgery). After hardware removal, MRI nicely depicts a central fissure in the articular cartilage of the lunate (20 months later). (i, j) Healed Kienböck’s disease in an adult. Sagittal CT and MRI (T1-w FSE fat-saturated after intravenous gadolinium) in a 64-year-old female with carpal discomfort for decades. The concave defect of the proximal circumference of the lunate is partially covered by articular cartilage, but there is a deep chondral defect at the palmar pole. No signal changes were detectable on plain T1- and T2-weighted sequences (not shown)
-
Ulnolunate impaction syndrome: In contrast to Kienböck’s disease, the maximum of the signal changes are located at the proximal-ulnar circumference of the lunate [43, 44]. Mostly, but not always, a positive ulnar variance is the cause of the biomechanical impaction of the ulnar head and the proximal-ulnar aspect of the lunate. For the same reason, degenerative TFC perforations are associated. Cystic and osteosclerotic lesions are accompanied by perifocal bone marrow edema in symptomatic patients. Figure 11.15a, b illustrates a case of ulnolunate impaction without positive ulnar variance and without perforated TFC.
Fig. 11.15 
Differential diagnoses of Kienböck’s disease. (a, b) Ulnar carpal impaction syndrome. Patient is a 44-year-old female with ulnar-sided wrist pain. Dorsopalmar radiograph is unremarkable. In fat-saturated PD-w FSE, subchondral bone-marrow edema is located at the proximal-ulnar circumference of the lunate. This ulnar-sided edema is different in localization from radial-sided signal changes in Kienböck’s disease. Note, TFC is not perforated by degeneration. (c, d) Intraosseous ganglion cyst originating from the scapholunate ligament. Patient is a 16-year-old female with dorsal wrist pain. A 6-mm ganglion cyst, originating from the scapholunate ligament, is both extra- and intraosseous. Surrounding bone-marrow edema is seen in fat-saturated PD-w FSE (left),Fig. 11.15 (continued) while a cortical defect at the communicating site is best visualized in plain T1-w FSE (right). (e, f) Osteoarthritis including the radiolunate and ulnolunate articulations. Patient is a 30-year-old male with malunited distal radius fracture. On the CT scan the subchondral changes of post-traumatic arthritis are seen at the radiolunate, ulnolunate and distal radioulnar joints. So-called “vacuum phenomenon” is seen in coronal CT. The MRI demonstrates the edema and the torn TFC (fat-saturated PD-w FSE). (g, h) Lunotriquetral coalition, fibrocartilaginous subtype (Minaar type I). Incidental finding in a 34-year-old male after crush injury of his midhand. Congenital synchondrosis is characterized by a narrowed and irregular lunotriquetral joint space as well as by hyperintense signal inclusions on the ulnar side of the lunate in fat-saturated PD-w FSE
-
Intraosseous ganglion cysts: These cystoid lesions are located within the lunate, adjacent to the scapholunate (SL) and lunotriquetral (LT) ligaments inserts (Fig. 11.15c, d). Ganglion cysts develop from hypertrophy of the synovia enveloping the ligament, and form radiolucent cysts with a surrounding sclerotic rim. If there is a focal signal change on MRI, the differential diagnosis should include an intraosseous ganglion cyst. Then CT imaging should be performed for detailed visualization of the cystoid cavity surrounded by a sclerotic rim and connected to the interosseous ligament by a transcortical channel [45]. On MRI, a hyperintense, dumbbell-shaped lesion is obvious on T2-weighted images. In symptomatic cases, a perifocal edema is present.
-
Posttraumatic lesions: Traumatic bone contusions (“bone bruises”), fractures, nonunions, and posttraumatic osteoarthritis (Fig. 11.15e, f) can mimic signal changes of Kienböck’s disease [27]. Differentiation is usually possible by the history of a previous injury.
-
Lunotriquetral synchondrosis: Characteristic of fibrocartilaginous coalition (Minaar type I) are irregularities of the subchondral bone substance, narrowed or absence of the LT joint space, and hyperintense signal changes of the subchondral bone marrow of the lunate and triquetrum (Fig. 11.15g, h) [46].
-
Inflammatory conditions: With arthritis there are often subtle erosions surrounded by focal bone-marrow edema. Examples include rheumatoid arthritis, seronegative spondylarthropathies, and calcium pyrophosphate dehydrate (CPPD) arthropathy. Clinical presentation, typical involvement of several joints and pannus-like synovial thickening are indicative of the inflammatory arthritis.

Differentiation of the underlying pathology is possible in over 80 % of the signal-compromised lunates, when clinical, biomechanical, and imaging aspects are evaluated synoptically [42].
Limitations of Imaging
CT and MRI have significantly pushed the capabilities of advanced imaging in Kienböck’s disease; however, some limitations are still present and evident:
Firstly, we strongly recommend high-resolution approaches for CT as well as for MR imaging with the use of thin slices (0.5 mm resp. 2 mm) and high image matrices (512 × 512 resp. 384 × 384) as introduced earlier in this chapter. The necessity of high-resolution imaging is anatomically based on the extension of the lunate of less than 2 cm. CT and MRI scans performed with lower resolution would potentially hide essential information required to accurately determine management.
Secondly, the necessity of including intravenous gadolinium in MRI for Kienböck’s disease must be emphasized. As presented earlier in this chapter, there are compelling arguments for including contrast-enhanced MRI over plain MRI. However scientific evidence is yet to be provided with respect to gadolinium in the early stages and final outcome of Kienböck’s disease. In the early stages of the disease, patients are often treated with immobilization, radial shortening, or STT fusion, so it has been difficult to obtain sufficient biopsies for histological correlation. However our unpublished data demonstrates an excellent correlation between the histology and three-zones seen with enhanced MRI.
Radiology-pathology correlation is much easier with the proximal fragment of a scaphoid nonunion. In a prospective study of 88 scaphoid nonunions, we compared the unenhanced MRI, contrast-enhanced MRI, and intraoperative bleeding from the proximal scaphoid [38]. Bone-marrow edema in unenhanced MRI was assessed as an inferior indicator of bone viability, and contrast-enhanced MRI provided significant higher sensitivity in detecting nonviable proximal fragments. A nearly equivalent approach has been reported for MRI and the tetracycline calcium complexes in the uptake of bone mineralization. Normal MRI signal of the bone marrow was shown to correlate with the presence of the osteoid and osteocytes, whereas absence of tetracycline label was noted in areas of focal osteonecrosis [16, 17].
And finally, we have suggested an expensive imaging protocol to diagnosis and stage Kienböck’s disease. The costs are important, especially in the current health environment. However we believe cost-effectiveness is optimized when the best treatment is based on the best diagnostic information.
Diagnostic Algorithm
Based on the different diagnostic capabilities of conventional radiography, CT, and MRI, the following algorithm is recommended for imaging and staging of Kienböck’s disease:
-
Historically, radiography is the first line of imaging. The radiographic views should be acquired in the neutral position to provide a standardized assessment of ulnar variance. The diagnosis of advanced Kienböck’s disease is primarily established through radiographs. No further imaging is required in stage IV disease, because only salvage procedures would be indicated.
-
Plain radiographs are also valuable in detecting or excluding a broad spectrum of the differential diagnoses.
-
Plain radiography will not identify the early marrow changes of Kienböck’s disease. An MRI is therefore recommended if Kienböck’s disease is suspected, despite normal radiographs. In stage I Kienböck’s disease, MRI is the only modality that will provide a diagnosis.
-
Generally, ceMRI is useful in Kienböck’s stages I to III to assess bone-marrow viability (MRI patterns A to C). It should be used in conjunction with X-rays and CT imaging which will provide a better appreciation of the macroscopic osseous changes. Additionally, ceMRI provides the unique capability to assess the perfusion and degree of repair, and can therefore is of some prognostic value in the healing process (see Fig. 11.8).
-
Once the diagnosis of Kienböck’s disease is established, determination of the degree of involvement should be made in order to guide the management options. In the intermediate stages, CT imaging is essential to determine the precise osseous changes of the lunate and the perilunar joints.
-
This includes assessment of trabecular osteosclerosis (stage II), small fractures of the proximal lunate (stage IIIa), coronal fractures (stage IIIc) and identify perilunar osteoarthritis (stage IV).
-
Bone scintigraphy is not currently recommended for assessing Kienböck’s disease, because of its low specificity.
In summary, both contrast-enhanced MRI and high-resolution CT imaging are important in Kienböck’s disease due to their different capabilities: CT imaging is needed for osseous morphology, MRI is essential for assessing bone and bone-marrow viability. Both procedures should be applied in equivocal diagnostic and therapeutic cases. Once armed with this advanced imaging information, the clinician is better placed to assess the differential diagnosis and stage the vascular, osseous, and articular cartilage of the lunate. This assists the clinician to interpret the clinical problem, assess the healing potential, and create an informed treatment algorithm. The individual treatment options are discussed in detail later in the book. Some examples are presented in Figs. 11.8, 11.13, and 11.15.
References
Kienböck R. Über traumatische Malazie des Mondbeins und Kompressionsfracturen. Fortschr Röntgenstr. 1910;16:77–103.
Irisarri C. Aetiology of Kienböck’s disease. J Hand Surg Br. 2004;29:281–7.
Lluch A, Garcia-Elias M. Etiology of Kienböck disease. Tech Hand Surg. 2011;15:33–7.
Gelberman RH, Bauman TH, Menon J, Akeson WH. The vascularity of the lunate bone and Kienböck’s disease. J Hand Surg Am. 1980;5:272–8.
Panagis JS, Gelberman RH, Taleisnik J, Baumgaertner M. The arterial anatomy of the human carpus. Part II. The intraosseous vascularity. J Hand Surg Am. 1983;8:375–82.
Lee M. The intraosseous arterial pattern of the carpal lunate bone and its relation to avascular necrosis. Acta Orthop Scand. 1963;33:43–55.
Stahl F. On lunatomalacia (Kienböck’s disease), a clinical and roentgenological study, especially on its pathogenesis and the late results of immobilization treatment. Acta Chir Scand. 1947;126(Suppl):1–133.
Schiltenwolf M, Martini AK, Mau HC, Eversheim S, Brocai DR, Jensen CH. Further investigations of the intraosseous pressure characteristics in necrotic lunates (Kienböck’s disease). J Hand Surg Am. 1996;21:754–8.
Hultén O. Über anatomische Variationen der Handgelenkknochen. Acta Radiol. 1928;9:155–68.
Gelberman RH, Salamon RB, Jurist JM, Posch JL. Ulnar variance in Kienbock’s disease. J Bone Joint Surg Am. 1975;57:674–6.
Antuna Zapico JM. Kienböck’s disease. Rev Ortop Traumatol. 1993;37IB(Suppl I):100–13.
Nakamura R, Tanaka Y, Imaeda T, Miura T. The influence of age and sex on ulnar variance. J Hand Surg Br. 1991;16:84–8.
Chung KC, Spilson MS, Kim MH. Is negative ulnar variance a risk factor for Kienböck’s disease? A meta-analysis. Ann Plast Surg. 2001;47:494–9.
Razemon JP. Kienböck’s disease radiology. Ann Radiol. 1982;25:353–8.
Owers KL, Scougall P, Dabirrahmani G, Wernecke G, Jhamb A, Walsh WR. Lunate trabecular structure: a cadaveric radiograph study of risk factors for Kienböck’s disease. J Hand Surg Eur Vol. 2010;35:120–4.
Desser TS, McCarthy S, Trumble T. Scaphoid fractures and Kienböck’s disease of the lunate: MR imaging with histopathologic correlation. Magn Reson Imaging. 1990;8:357–62.
Trumble TE, Irving J. Histologic and magnetic resonance imaging correlations in Kienböck’s disease. J Hand Surg Am. 1990;15:879–84.
Aspenberg P, Wang JS, Jonsson K, Hagert CG. Experimental osteonecrosis of the lunate. Revascularization may cause collapse. J Hand Surg Br. 1994;19:565–9.
Hashizume H, Asahara H, Nishida K, Inoue H, Konishiike T. Histopathology of Kienboeck’s disease. Correlation with magnetic resonance and other imaging techniques. J Hand Surg Br. 1996;21:89–93.
Ogawa T, Nishiura Y, Hara Y, Okamoto Y, Ochiai N. Correlation of histopathology with magnetic resonance imaging in Kienböck’s disease. J Hand Surg Am. 2012;37:83–9.
Raffray M, Cohen GM. Apoptosis and necrosis in toxicology: a continuum or distinct modes of cell death? Pharmacol Ther. 1997;75:153–77.
Schmitt R, Heinze A, Fellner F, Obletter N, Strühn R, Bautz W. Imaging and staging of avascular osteonecroses at the wrist and hand. Eur J Radiol. 1997;25:92–103.
Schmitt R, Kalb KH. Imaging in Kienböck’s disease. Handchir Mikrochir Plast Chir. 2010;42:162–70.
Bain GI, Begg M. Arthroscopic assessment and classification of Kienböck’s disease. Tech Hand Up Extrem Surg. 2006;10:8–13.
Kalb K, Pillukat T, Schmitt R, Prommersberger KJ. Die Lunatumnekrose im Kindes- und Jugendalter. Handchir Mikrochir Plast Chir. 2010;42:187–97.
Irisarri C, Kalb K, Ribak S. Infantile and juvenile lunatomalacia. J Hand Surg Eur Vol. 2010;35:544–8.
Arnaiz J, Piedra T, Cerezal L, Ward J, Thompson A, Vidal JA, et al. Imaging of Kienböck disease. Am J Roentgenol. 2014;203:131–9.
Decoulx P, Marchand M, Minet P, Razemon JP. La Maladie de Kienböck chez le mineur. Lille Chir. 1957;12:65–81.
Palmer AK, Glisson RR, Werner FW. Ulnar variance determination. J Hand Surg Am. 1982;7:376–9.
Friedman L, Yong-Hing K, Johnston GH. The use of coronal computed tomography in the evaluation of Kienböck’s disease. Clin Radiol. 1991;44:56–9.
Youm Y, McMurtry RY, Flatt AE, Gillespie TE. Kinematics of the wrist. Part I – an experimental study of radial-ulnar deviation and flexion-extension. J Bone Joint Surg Am. 1978;60:423–31.
Goldfarb CA, Hsu J, Gelberman RH, Boyer MI. The Lichtman classification for Kienböck’s disease: an assessment of reliability. J Hand Surg Am. 2003;28:74–80.
Lichtman DM, Lesley NE, Simmons SP. The classification and treatment of Kienböck disease: the state of the art and a look at the future. J Hand Surg Eur Vol. 2010;35:549–54.
Reinus WR, Conway WF, Totty WG, Gilula LA, Murphy WA, Siegel BA, et al. Carpal avascular necrosis: MR imaging. Radiology. 1986;160:689–93.
Sowa DT, Holder LE, Patt PG, Weiland AJ. Application of magnetic resonance imaging to ischemic necrosis of the lunate. J Hand Surg Am. 1989;14:1008–16.
Vande Berg BC, Malghem J, Lecouvet FE, Maldague B. MRI of the normal bone marrow. Skeletal Radiol. 1998;27:471–83.
Cerezal L, Abascal A, Garcia-Valtuille R, García-Valtuille R, Bustamante M, del Piñal F. Usefulnes of gadolinium-enhanced MR imaging in the evaluation of the vascularity of scaphoid nonunions. Am J Roentgenol. 2000;174:141–9.
Schmitt R, Christopoulos G, Wagner M, Krimmer H, Fodor S, van Schoonhoven J, et al. Avascular necrosis (AVN) of the proximal fragment in scaphoid nonunion: is intravenous contrast agent necessary in MRI? Eur J Radiol. 2011;77:222–7.
Donati OF, Zanetti M, Nagy L, Bode B, Schweizer A, Pfirrmann CW. Is dynamic gadolinium enhancement needed in MR imaging for the preoperative assessment of scaphoidal viability in patients with scaphoid nonunion? Radiology. 2011;260:808–16.
Lichtman DM, Ross G. Revascularization of the lunate in Kienböck’s disease. In: Gelberman RH, editor. The wrist. New York, NY: Raven; 1994. p. 363–72.
Lichtman DM, Alexander AH, Mack GR, Gunther SF. Kienböck’s disease – update on silicone replacement arthroplasty. J Hand Surg Am. 1982;7:343–7.
Schmitt R, Christopoulos G, Kalb K, Coblenz G, Fröhner S, Brunner H, et al. Differential diagnosis of the signal-compromised lunate in MRI. Fortschr Röntgenstr. 2005;177:358–66.
Imaeda T, Nakamura R, Shionoya K, Makino N. Ulnar impaction syndrome: MR imaging findings. Radiology. 1996;201:495–500.
Cerezal L, del Piñal F, Abascal F, García-Valtuille R, Pereda T, Canga A. Imaging findings in ulnarsided wrist impaction syndromes. Radiographics. 2002;22:105–21.
Magee T, Rowedder AM, Degnan GG. Intraosseous ganglia of the wrist. Radiology. 1995;195:517–20.
Stäbler A, Glaser C, Reiser M, Resnick D. Symptomatic fibrous lunato-triquetral coalition. Eur Radiol. 1999;9:1643.
Acknowledgement
We cordially thank Dr. Gregory Bain for enhancing the style of the original manuscript.
Author information
Authors and Affiliations
Corresponding author
Editor information
Editors and Affiliations
Rights and permissions
Copyright information
© 2016 Springer International Publishing Switzerland
About this chapter
Cite this chapter
Schmitt, R.R., Kalb, K. (2016). Advanced Imaging of Kienböck’s Disease. In: Lichtman, D., Bain, G. (eds) Kienböck’s Disease. Springer, Cham. https://doi.org/10.1007/978-3-319-34226-9_11
Download citation
DOI: https://doi.org/10.1007/978-3-319-34226-9_11
Published:
Publisher Name: Springer, Cham
Print ISBN: 978-3-319-34224-5
Online ISBN: 978-3-319-34226-9
eBook Packages: MedicineMedicine (R0)