
Abstract
There are many tools available to aid in creating, organizing, and analyzing quality improvement projects. This section demonstrates the value of several fundamental tools and incorporates the running model of the lemonade stand to aid in visualization.
Access provided by Autonomous University of Puebla. Download chapter PDF
Keywords
- Global 8D
- Brainstorming
- Brainwriting
- Affinity diagram
- Visual mapping
- Relationship diagram
- Pareto chart
- Fishbone diagram
- Ishikawa diagram
- Cause
- Effect
- Quality tools
- Check sheet
- Control chart
- Histogram
- Bar graph
- Bins
- Scatter diagram
- Flowchart
- Run chart
- Stratification diagram
- Decision-making
- Nominal group technique
- Delphi
- Cost-benefit analysis
- Multivoting
- Force-field diagram
- Force-field analysis
- Interrelationship diagram
- Implementing
- Initiating
- Gantt chart
- Tree diagram
Global 8D, Brainstorming, Brainwriting, Affinity diagram, Relationship map, Pareto chart, Fishbone diagram, Ishikawa diagram, Check sheet, Control chart, Histogram, Flowchart, Scatter diagram, Nominal group technique, Delphi, Cost-benefit analysis, Multivoting, Force-field diagram, Force-field analysis, Interrelationship diagram, Gantt chart, Tree diagram
There are many tools available to aid in creating, organizing, and analyzing quality improvement projects. This section demonstrates the value of several fundamental tools and incorporates the running model of the lemonade stand to aid in visualization.
Project Management Skills and Visual Tools
-
(a)
Initiation/start – The beginning is often prompted by a goal or problem. Development of the project is discussed elsewhere in this handbook although the stages of any project often include initiating, planning, executing, monitoring and controlling, and closing [1]. The degrees of initiation vary greatly and are dependent on the needs of the team/leaders and the nature of the problem:
-
(i)
“Magic formula” – In this scenario, the problem is defined and a decision is then made regarding how to solve the problem.
-
1.
The difficulties with this method are obvious as the task is oversimplified and not intuitively informative.
-
2.
The “magic formula” is simple and can be applied universally and quite rapidly as exemplified below:
-
(i)
Problem: Individuals arriving after closing would like to be served
-
(ii)
Solution: an on-the-spot decision is made to stop serving 5 min after closing time and without further analysis or data collection on the problem
-
(i)
-
1.
-
(ii)
“More traditional” – Here, the problem is defined, data is collected, solutions are developed, and the most appropriate solution is chosen. The winning solution is being subsequently implemented.
-
(iii)
“More complex” – These techniques involve greater detail. An example in this case might look like the “Eight Disciplines Problem Solving” or “Global 8D” [2]:
-
1.
A general outline follows the “plan-do-check-act” cycle, which has been used for years in the product development and improvement process:
-
(i)
D0 – Initial planning stage
-
(ii)
D1 – Establishment of a team
-
(iii)
D2 – Problem description and goal identification
-
(iv)
D3 – Problem containment stage to isolate the problem
-
(v)
D4 – Identification of the root cause
-
(vi)
D5 – Search for corrections to the problem
-
(vii)
D6 – Implement corrective actions analysis
-
(viii)
D7 – Prevent recurrence of the problem
-
(ix)
D8 – Team reward for a job well done
-
(i)
-
1.
-
(i)
-
(b)
Initial planning and simple visualization:
-
(i)
-
1.
This is a commonly used forum for idea generation.
-
2.
Several people in a group are able to build up on each other’s ideas in order to maximize creativity.
-
3.
Participants freely share ideas onto a medium. Commonly used techniques to achieve success include maintaining a criticism-free zone, having a predefined goal/problem, allowing individuals and the group time to complete idea generation period, and utilizing small groups. Brainstorming is often easy to organize and conduct (Fig. 1).
Fig. 1 
Referring back to our improving customer satisfaction at our fictional lemonade stand example, ideas have been placed around a central topic in a simple, easy-to-read configuration
-
1.
-
(ii)
-
1.
This is a technique of idea generation that highlights quantity of topics generated.
-
2.
It is an offshoot of brainstorming that aims to generate 108 different ideas within 30 min, focusing on quantity more so than quality.
-
3.
Six participants in the group plus a moderator: each participant develops three ideas every 5 min; ideas are then written down and passed to the next individual – participants effectively inspired by each other’s ideas and encouraged to constantly reinterpret and innovate off said ideas – complete 6 rounds, totaling 30 min, 108 ideas.
-
1.
-
(iii)
-
1.
A visual map comprised of the planned output of what is usually a team-based brainstorming session. Often, there is a premeditated problem/question/goal.
-
2.
This device collectively brings together multiple often disorganized plans to create categorical structure of organized thoughts regarding a particular problem.
-
3.
The plan of action is usually as follows: agreement on the problem and development of a question, recording of ideas onto medium, subsequent organization of thoughts and ideas, creation of headers and effectively categorizing ideas under each header, drawing the affinity map and encapsulating each grouping, and discussion of recorded ideas/groups (Fig. 2).
Fig. 2 
A visual representation of a simple affinity diagram related to improving specific parameters regarding lemonade stand operations. The visual representation includes headers above in larger font with details pertaining to each header listed below
-
1.
-
(iv)
-
1.
A visual tool used to evaluate cause and effect in systems, in addition to highlighting the complexity of intersystem relationships.
-
2.
Allows for visualization of relationships between ideas in an affinity map or product of brainstorming.
-
3.
Affinity map ideas are drawn in a circular fashion around the problem. Group members then go through interrelationships between ideas and problems or questions being asked, with cause and effect relationships being one of the more common relationships displayed (Fig. 3).
Fig. 3 
Mapping a relationship diagram may be used to display cause and effect or simply display idea interrelationships
-
1.
-
(i)
-
(c)
Seven basic tools of quality – Originally introduced to improve quality in the engineering community, the tools include fishbone diagram, check sheet, control chart, histogram, Pareto chart, scatter diagram, and flowchart. Developed with relative simplicity in mind, these include several graphical tools to aid in assessing issues related to planning, quality control, and quality improvement. This list is by no means exhaustive and does not address more advanced statistical analytic tools [7]:
-
(i)
Fishbone diagram/Ishikawa diagram/cause and effect diagram [2, 7, s8]:
-
1.
This diagram aids in the evaluation of causes related to an effect.
-
2.
The key idea is that each category can be a source of variation ultimately influencing the problem/goal. The causes/categories are usually discovered via brainstorming or other previously defined tools.
-
3.
A problem/question/goal is defined and categories that introduce variation in different settings. The settings and their corresponding variations may include the “6 Ms” in manufacturing (machine, method, material, man power, measurement, and mother nature), or the “7 Ps” in marketing (product, price, place, promotion, people, positioning, and packaging), and the “5 Ss” in the service industry (surroundings, suppliers, system, skills, and safety). We highlight three of the “5 Ss” in the fishbone diagram below to demonstrate its effectiveness (Fig. 4).
Fig. 4 
Here displayed are several of the “5 Ss” to demonstrate the value of a fishbone diagram in presenting information with cause and effect relationships in mind. The causes in this case ultimately lead to poor product quality
-
1.
-
(ii)
-
1.
Check sheets are commonly used tools to record data for analysis. They also provide historical records and tabulated data through various organizational methods.
-
2.
Information may be tabular or graphical and usually presented in a simple, user-friendly fashion with clear labeling.
-
3.
A check sheet is often used when data can be readily observed and tabulated. Data is often reported in frequency of events/problems/incidences and often arises from a process involving production of a part or element.
-
4.
A check sheet can be created as part of the evaluation of an event or problem. A decision on the length of data collection is then decided upon. The intake form should be set up so that the data is recorded simply (i.e., by Xs, Os, or check marks). Then, labels should be set up and the check sheet tested for a certain time period to measure appropriateness. Record data as the problems or events occur (Fig. 5).
Fig. 5 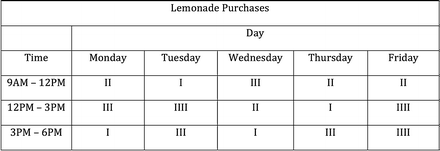
A check sheet created in order to figure out the peak times of lemonade purchasing done by consumers
-
1.
-
(iii)
Control chart [7]:
-
1.
Helps analyze processes with variability over time and compares these data points to upper, lower and average controlled values.
-
2.
Differentiates common from uncommon causes of variation and assesses the effectiveness of change while conveying process performance and monitoring the variation over time.
-
3.
Control charts are able to help identify issues as they affect processes. The ranges of values are often highlighted, as well as the stability and patterns associated with a particular process.
-
4.
The basic process begins with choosing the appropriate control chart and determining the time period and data to be studied. Comparisons are made between data points and time while displaying upper control, lower control, and average lines. Continuously recalculate the “out-of-control” data and investigate causes (Fig. 6).
Fig. 6 
The basic visual presentation of a control chart based on tabulated data is achieved. This is an oversimplified version intended to demonstrate the value of the visual tool in graphically displaying variability of data. The average has been calculated based on tabulated data. See caption for further information. Charted data appears based on Table 26.2 on the right side of the page. The black line represents the average. Gradually enlarging dotted-to-solid lines represent standard deviations from the norm, beginning with one SD represented by fine dots to three SD represented by the solid line
-
1.
-
(iv)
-
1.
This tool represents a bar graph of arranged data.
-
2.
Histograms help depict a snapshot of the data pertaining to a particular process, summarizes large data sets by visualizing data distribution, compares measurements/specs, communicates information, and may assist in the decision-making process.
-
3.
A short description of the process includes first collecting data points from a particular process. The next step often includes counting data points and using a tally process in order to create bins (as demonstrated below). Bins contain the data range, made appropriate to fit the data set. This is often complemented by determining intervals (width/starting points), counting the frequency of values within each bin, and finally plotting the data (Fig. 7).
Fig. 7 
This histogram represents the customer frequency based on age. Seventy-five data points have been plotted with bins organized in 5-year intervals. Our histogram may reveal a pattern of age distribution among customers to the lemonade stand and ultimately affect further business models
-
1.
-
(v)
Pareto chart – originally based on the “80/20 rule of Pareto” (80 % of wealth held by 20 % of people) [2, 7]:
-
1.
This is a bar chart arranged in descending height from left to right with relatively more important data on the left. Classically, the bars are used to represent frequency and money.
-
2.
Helps identify most significant issues and breaks larger problems into smaller sections, at the same time designating where efforts should be focused. The ultimate result is better use of limited resources.
-
3.
A model for a Pareto chart begins with a categorized data, usually including but not limited to frequency, quantity, cost, and/or time. Typical time periods may include a work length, full day or week/month. Data is then recorded and organized into a graph with the maximum value or tallest value to the left and subsequent values arranged to the right and so on. Each category percentage should then be calculated and cumulative sums are plotted and the data points are connected (Fig. 8).
Fig. 8 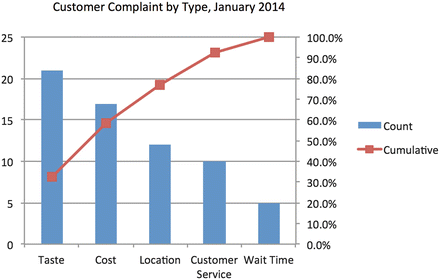
The most important customer complaints, arranged in the order of significance, are highlighted. Additionally shown is a line graph representing the cumulative percentage associated with each subsequent complaint
-
1.
-
(vi)
Scatter diagram [7]:
-
1.
A scatter diagram is often utilized to study relationships between two different variables.
-
2.
Interrelationships between variables are visualized by incorporating data from different sets on a grid in order to identify changes in the relationships of those variables over time.
-
3.
Creation of a scatter diagram begins with a summary of tabular data. The data points are then plotted with the x-axis usually identified as the cause and the y-axis related to the effect. Data points are then plotted and trend lines may be added to better visualize the direction and strength of the correlation (Fig. 9).
Fig. 9 
A scatter diagram relating information regarding the ambient temperature and the number of drinks sold during the day. A clear trend is observed on hotter days, when desire and demand for a beverage may increase
-
1.
-
(vii)
Flowchart/run chart/stratification chart [7]:
-
1.
Diagrams the nature/progression of steps in a process.
-
2.
Flowcharts are reliable tools for training, promoting process, understanding, and identifying the problems and areas needing improvement.
-
3.
The first step in creating a flowchart is defining the process, in addition to creating a beginning and end point. Often, it may be beneficial to write ideas down in a brainstorming session prior to creating the flowchart. To complete the chart, sequence the ideas and draw in arrows to present the direction of ideas (Fig. 10).
Fig. 10 
A flowchart that may be shown to newly hired employees in order to provide a visual example of the order intake process, beginning from customer presentation to the stand. The chart may highlight areas of the interaction which need to be addressed prior to an adequate order intake
-
1.
-
(i)
-
(d)
Deciding and executing:
-
(i)
Nominal group technique [4, 7]:
-
1.
Nominal group technique (NGT) is a common method used for idea generation or decision-making.
-
2.
NGT entails persons working in the presence of one another with only minimal interaction. This may be more appropriate than other methods when some individuals are significantly more vocal than others or when individuals prefer to work in silence. Being based on written responses, NGT may be more appropriate in the discussion of controversial topics by avoiding or lessening the dominance of individual group members. NGT is structured and easy to organize, and peer influence is still a factor in group discussion stage, although less than with other methods.
-
3.
Decision-making via NGT begins with clarification of the statement or question, followed by silent deliberation and independent idea generation for a fixed time period. Members may then go through ideas one individual at a time while a moderator records ideas. Discussion is not encouraged at this point in time and any participant may pass his or her turn to add additional ideas. Upon completion of answer generation, a discussion is held to review each response. Final lists may be created by a technique such as multivoting to narrow down choices.
-
1.
-
(ii)
-
1.
The Delphi technique is a means of information gathering or decision-making among a group. Responses or answers to questions and problems are collected over several rounds of questionnaires and does so anonymously. Originally developed as a means for an expert panel to face problematic issues. An in-person group meeting is not always required.
-
2.
The workings of the Delphi technique usually include multiple rounds of question asking, with responses subsequently gathered and data recorded. Responses are read aloud so as to attempt to influence thought processes of present individuals. These results are redistributed; often revised and new sets of data are created and recorded. Groups may prioritize each answer or comment, and often an agreement may be reached by consensus, voting, or averaging. The concept here essentially remains that group decisions are commonly more significant than individual decisions.
-
1.
-
(iii)
Cost-benefit analysis (CBA) [2, 9]:
-
1.
Includes any number of projects that compare the potential costs and benefits of a given decision or plan. CBA aims to understand the soundness of a given action in addition to acting as a basis of comparison between competing ideas or projects.
-
2.
Consider the cost-benefit matrix below. It can help identify “low-hanging fruit.” See Table 1.
Table 1 This matrix is an over-simplified representation of a cost-benifit comparison. The table visually highlights desired options or outcomes
-
1.
-
(iv)
Multivoting [7]:
-
1.
This is a tool used to narrow down large lists into smaller, more manageable groups. Multivoting is often used after brainstorming to cut down large lists and when group judgment is necessary.
-
2.
Multivoting begins with exposing previously organized options to group members and designation of final list size. Options are usually numbered and each member given a certain quota of choices to vote for. Essentially, the longer the list, the more votes allowed. Each member then selects and ranks the most important choices based on the number of choices allowed. The group subsequently tallies votes and records final choices with discussion then ensuing.
-
1.
-
(v)
Force-field diagram/force-field analysis [1, 7]:
-
1.
The concept of a force-field diagram is rooted in decision-making based on comparing the forces behind each choice. Forces behind each choice can be weighted based on the importance of factors inherent to each of the forces. This is often shown by having forces on either side of the diagram, with more impactful forces being drawn in larger and broader (arrows) than less impactful forces.
-
2.
The factors or forces must be weighted carefully and skillfully; decisions are often subjective and significant participant influence is needed. Expert judgment is often needed to give strength to subjective matter (Fig. 11).
Fig. 11 
In this example, the pros and cons of incorporating food items for purchase at the lemonade stand are weighed out to demonstrate the value of a force-field analysis. More significant ideas are related to broader arrows
-
1.
-
(vi)
Interrelationship diagram/relations diagram – inherently similar to a relationship map [1, 2, 7]:
-
1.
Incorporates cause and effect relationship analysis via linking different aspects of situations.
-
2.
This diagram is primarily used when a complex issue is being analyzed for causes and a complex solution is required, more completely exploring the relations of an idea to help make a more educated decision.
-
3.
Begin by writing the main objective at the top of the medium and brainstorm ideas. Ideas may be incorporated from other sources such as affinity map/fishbone diagram. Relationship of each idea to other ideas is then discussed and arranged on the medium accordingly. Arrows are then drawn to determine cause and effect relationship between ideas. The next step includes counting arrows to determine which ideas are critical. Outgoing arrows usually relate cause while incoming arrows relate effect.
-
1.
-
(i)
-
(e)
Implementing:
-
(i)
Activity network diagram (also known as an Arrow Diagram and similar to the Critical Path Method) [2, 7]:
-
1.
Defines order of tasks, scheduling, and relationship to resources.
-
2.
This setup is useful when the steps, sequences, and duration of the project or process are known. Usually project schedule is quite critical and timing is everything.
-
3.
Developing the diagram begins with listing of necessary tasks and orienting sequences (which tasks should be done before? during? immediately after?). Tasks are then diagramed (timing is usually carried out from left to right). Using circles to highlight events, “dummy” events may also be added to represent potential distractions from the main or critical path (Fig. 12).
Fig. 12 
An oversimplified version of an activity network diagram. Tasks are emphasized within circles and arrows to represent workflow. Additionally, timing of each task may be filled in alongside arrows to indicate task duration. Longer paths often require more time to complete tasks. Our example utilizes the basic path to adding food items to the menu
-
1.
-
(ii)
Gantt chart [7]:
-
1.
A Gantt chart graphically displays a project timeline and the major activities that make up the timeline.
-
2.
Normally organized by time, duration, and completion status. Useful for scheduling or monitoring tasks and conveying status or plans. The sequence and duration must be known. The order of events may or may not be dependent on completion of previous tasks.
-
3.
The first step includes identifying tasks and the associated milestones and duration of each task. The x-axis often represents time, while the y-axis represents tasks. Status bars are then created and filled in horizontally according to task completion or projected completion dates (Fig. 13).
Fig. 13 
The Gantt chart serves to demonstrate the timeline of events in a project to develop food items at our stand. Realistic task end dates are highlighted in red, while the worst case end dates of each task can be seen in green
-
1.
-
(iii)
Tree diagram [7]:
-
1.
A visual tool to help assessments move from general to a more specific thinking. May be used to evaluate implementation of ideas and consequences.
-
2.
By breaking down broad categories into increasingly detailed ideas, a tree diagram forms a branching pattern of construction to aid in visualization, develops actions to deliver a plan, and may also be used for root-cause analysis, process analysis, evaluating, and communication development. The tree diagram is truly versatile.
-
3.
Creation of a tree diagram begins under guidance of a general statement, problem, or goal. Specific tasks are required to accomplish this idea. Those tasks or actions may be decided upon via techniques such as brainstorming, affinity diagrams, relationship diagram, or other idea-generating methods. Further levels of detail will subsequently be achieved and each idea can be evaluated and reevaluated in order to be deemed necessary and efficient (Fig. 14).
Fig. 14 
This tree diagram is based on the goal of improving visual appeal at the lemonade stand. The result is the generation of several ideas to be implemented that ultimately accomplish this goal
-
1.
-
(i)


References
Project Management Institute. Project management body of knowledge (PMBOK guide). Newtown Township: Project Management Institute; 2013.
Shirley D. Project management for healthcare. Boca Raton: Taylor and Francis Group; 2011.
Tomas S. Creative problem-solving: an approach to generating ideas. Hosp Mater Manage Q. 1999;20(4):33–45.
McMurray A. Three decision-making aids: brainstorming, nominal group, and Delphi technique. J Nurs Staff Dev. 1994;10(2):62–5.
Lepley C. Problem-solving tools for analyzing system problems: the affinity map and the relationship diagram. J Nurs Adm. 1998;28(12):44–50.
Linsey JS, Becker B. Effectiveness of brainwriting techniques: comparing nominal groups to real teams. In: Taura T, Nagai Y, editors. Design creativity 2010. London: Springer; 2011. 166 p.
Tague N. The quality toolbox. 2nd ed. Milwaukee: ASQ Quality Press; 2004.
Ishikawa K, Loftus JH, editors. Introduction to quality control. Tokyo: 3A Corporation; 1990.
Jeremy J, Duncan H. Qualitative research: consensus methods for medical and health services research. BMJ. 1995;311:376.
Author information
Authors and Affiliations
Corresponding author
Editor information
Editors and Affiliations
Additional information
If you have any questions about the information covered in this chapter or other medical safety and quality improvement-related topics, please contact us at http://www.medicalqualityandsafetyforum.com. The website will also provide a forum where you can ask specific questions about your safety and medical quality improvement projects or mentor upcoming medical quality leaders.
Rights and permissions
Copyright information
© 2016 Springer International Publishing Switzerland
About this chapter
Cite this chapter
Rojhani, S. (2016). Project Management: Basics. In: Atanelov, L. (eds) Resident’s Handbook of Medical Quality and Safety. Springer, Cham. https://doi.org/10.1007/978-3-319-24190-6_26
Download citation
DOI: https://doi.org/10.1007/978-3-319-24190-6_26
Published:
Publisher Name: Springer, Cham
Print ISBN: 978-3-319-24188-3
Online ISBN: 978-3-319-24190-6
eBook Packages: MedicineMedicine (R0)